BTCUSD - and now what?Morning Traders,
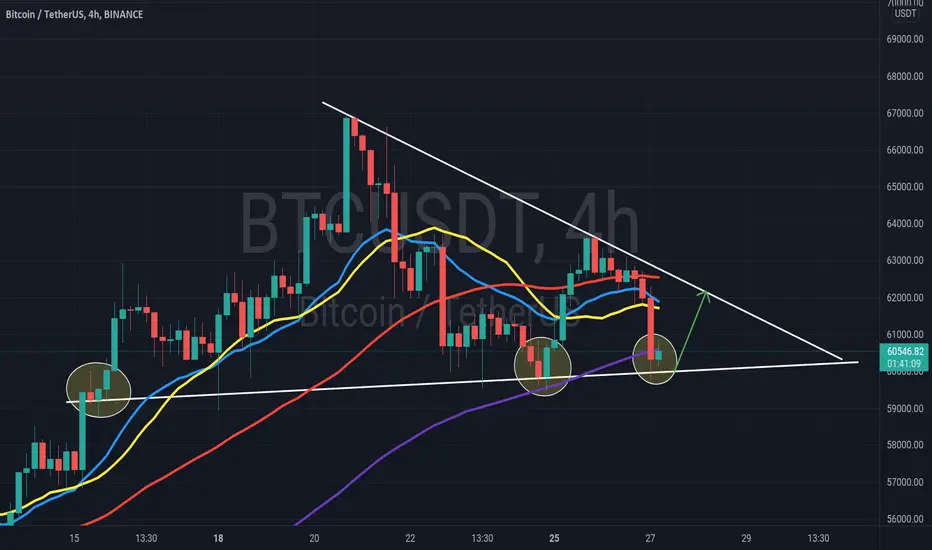
As we can see we have at this time downtrend. 0 is the highest high, 2 is lower high.
There is also formation TL4C. If the price breakup TL1 and candlestick will close above it, then we will have buy signal.
There is resistance level 62000.0. Price just passed 50% of the last swing let’s see if will hold high move.
As a support 61000 level should work. TL2 work as support as well, if the price decided to drop then signal will be when candlestick will close bellow TL2.
But be careful, price may return do TL and then go down.
Momentum is moving sideways and is not strong enough to push price higher.
Let’s wait and see what will happen next.
Please click “like” button” for this analysis. This is very important for me. I will see appreciation for free analysis.
cheers,
Jim
Btcusdidea

BTC/USD LONG SETUP TO NEW ALL TIME HIGHBTC /USD bulls remain focused on upside retracement levels and areas of potential technical resistance including the 67146, 68515, 69449, 71974, and 73245 areas. Following the pair’s recent gains, downside retracement levels and areas of potential technical support include the 63784, 61796, 60189, 58581, 56593, 57627, and 56293 levels. Traders are observing that the 50-bar MA (4-hourly) is bullishly indicating above the 100-bar MA (4-hourly) and above the 200-bar MA (4-hourly). Also, the 50-bar MA (hourly) is bearishly indicating below the 200-bar MA (hourly) and above the 100-bar MA (hourly).
Price activity is nearest the 50-bar MA (4-hourly) at 62569.78 and the 200-bar MA (Hourly) at 62564.27.
Technical Support is expected around 58000/ 56800/ 55500/ 53997.15/ 51245.86/ 49022.22 with Stops expected below.
Technical Resistance is expected around 59500/ 63000/ 65000/ 67146.16/ 68515.32/ 69449. 40 with Stops expected above.
On 4-Hourly chart, SlowK is Bearishly below SlowD while MACD is Bullishly above MACDAverage.
On 60-minute chart, SlowK is Bullishly above SlowD while MACD is Bearishly below MACDAverage.

BTC/USDTBTC make a H&S pattern on 4H and now breakout to downside measure is approximately 10% to red line /support.. but there is also a golden pocket like potencial support also.. and we se now is making potencial bull flag pattern where can be successful because RSI and Stoch are in oversold area.. lets see how 4h close.. cheers

BTC/USDT 4HOUR UPDATE Welcome to this quick BTC/USDT analysis.
I have tried my best to bring the best possible outcome in this chart.
Btc/usdt analysis is this tradline is very important and last two time is bounce this tradline and support level $59800
And resistance $62080
Sorry for my English it is not my native languages.
Do hit the like button if you like it and share your charts in the comments section.
Thank you...
BTCUSD Wait for the Trigger 🔥🔥Hello everyone, If like the idea, BTCUSD downtrend after Break bull bullish candle so that resistance Area by the Sell it is short time frame.
Please don't forget to FOLLOW , LIKE and COMMENT .
If you like my analysis.
Thank you and Good Luck!

#BTCUSDT Do no Panic! Just a correction. BTFD!Welcome to this quick Update, everyone.
If you are reading my updates for the first time do follow me to get more complex charts in a very simplified way.
I also post altcoin setups on Spot, Margin, and Futures.
BTC broke the resistance level and is currently retesting the important support area around 60k to 62k.
I expect BTC to bounce from here and rally all the way to the 65k level.
BTC is consolidating just above the resistance-turned-support trendline.
So there's nothing to panic about! It's better to hold more BTC at this point than Altcoins and also USDT to trade alts.
The secret is to wait for the right time to enter a trade.
Like yesterday we took many trades like SHIB and made a killing profit!
Entered at .028 and Closed at .047 with 5x leverage!!
I would just like to warn you about Risk Management as always.
Do not overtrade, you'll eventually end up losing money and preserve your funds.
Remember for the next rally we need a confirmation candle close above 65k level!
In a nutshell, BTC is good no issues as of now unless $57k is broken.
I am Holding mostly BTC and scalping on Futures and Spot!
FOLLOW ME IF YOU WANT TO KNOW MY TRADES!
What's your thought on this?
Do hit the like button if you like this update and share your views in the comment section.
Thank you
#PEACE

BTC/USD LONG SETUP(INVERSE H&S PATTERN)Bitcoin (BTC/USD) awaited fresh market sentiment early in the Asian session as the pair traded as high as the 63126.16 level during the European session after trading as low as the 62183.72 level during the Asian session. Traders lifted BTC/USD as high as the 63726.58 area during yesterday’s North American session, representing a test of the 38.2% retracement of the appreciating range from 58943.83 to 66999, its recent all-time high. Stops were recently elected above the 61287.25 area, representing the 23.6% retracement of the same depreciating range. Additional price retracement levels in the same depreciating range include the 63260, 64143, 65234, and 65399 areas. Traders are paying close attention to technical resistance around the 63750 level, a previous downside price objective related to selling pressure around the 66658 and 66037 levels.
BTC/USD bulls remain focused on upside retracement levels and areas of potential technical resistance including the 67146, 68515, 69449, 71974, and 73245 areas. Following the pair’s recent gains, downside retracement levels and areas of potential technical support include the 63784, 61796, 60189, 58581, 56593, 57627, and 56293 levels. Traders are observing that the 50-bar MA (4-hourly) is bullishly indicating above the 100-bar MA (4-hourly) and above the 200-bar MA (4-hourly). Also, the 50-bar MA (hourly) is bearishly indicating below the 200-bar MA (hourly) and above the 100-bar MA (hourly).
Price activity is nearest the 50-bar MA (4-hourly) at 62569.78 and the 200-bar MA (Hourly) at 62564.27.
Technical Support is expected around 59500/ 58000/ 56800/ 55500/ 53997.15/ 51245.86/ 49022.22 with Stops expected below.
Technical Resistance is expected around 67146.16/ 68515.32/ 69449.40 with Stops expected above.
On 4-Hourly chart, SlowK is Bearishly below SlowD while MACD is Bullishly above MACDAverage.
On 60-minute chart, SlowK is Bullishly above SlowD while MACD is Bearishly below MACDAverage.

BTC/USD Oct to NovExpire Time analysis = End of Year (2021)
TP= Take profit.
this is my idea (please be careful your BUY & Sell ).
Thanks for your Support and Your 👍
❤️❤️❤️❤️❤️❤️❤️🚀🔥
Life Run Time . . .⏳
#Mpouransari

The basics of SHORT or i'am wrong?Hi Everybody this is my neutral analysis about BTC. Not looking the news and with the eyes only pointing to the graphic the Weekly candle that is not finish yet. And the double top in the W Time frame makes me think that the loss of momentum and the Short orders are going to hit hard the BTC.
But is just my analysis stil last 2 days to close the Weekly candle. So, we will see.
Juest keep the eyes open. Not let the FOMO work in your brain.
Best regards.
All comments and suggestions are well received!

Bitcoin going to grow above 67000$Before that, I wrote about the correction of bitcoin and alts. The correction took place, bitcoin fell to the support line and pushed off from it. I now expect bitcoin to return to the $ 67,000 level and above, as well as the growth of all alts. At least technical indicators tell us about this, and something tells me that we will see a rocket.

Btc retracment to 48k
BTC touched 1 day chanle and break the 60' degree uptrend line.In my opinion If btc go down with 60 degree downtrend , will touch low of chanle line in 31 Oct and 47k and if btc goes with 45 degree downtrend line touch low chanle line in 3 Nov and 49k. After that date, Btc continues with 15 degree uptrend line

BTCUSDT , Opportunity for buying ... :D :DHello everybody
According to the previous analysis , the price exactly supported in our buy zone and went to near our target
At this time we are in upward channel and other time the price is impact to the below trendline of channel and now we can buy and take long position until the targets reach
Previous analysis :
Dont forget use stop loss and attention to money management
Good Luck
Abtin

BTCUSD LONGHello fellow traders, if you like the idea, do not forget to support with a like and follow.
DISCLAIMER
________________
THIS IS NOT IN ANYWAY AN INVESTMENT ADVICE! DO YOUR OWN DUE DILIGENCE BEFORE TAKING ANY TRADE.

BITCOIN ATH Support & ResistancesBITCOIN ATH Support & Resistances
Then Price can go even higher to 77-85-98
Good luck traders

BTCUSD in the final potential reversal zoneAfter defying many PRZ zones BTC reaches its final potential reversal area. Could BTC retrace more or less? Too bullish as for the charts and PRZs can be ignored. It defied all of the PRZs this month.
Many says it's going to 100k. For me I don't know. I read charts and hunting for a good swing rather than overtrading lol.
Thinking of a short term short position if this hits my short target. Too risky to FOMO near the new high.
NOTE: Elliot wave is subjective and harmonic patters can be invalidated.
Your capital might be at right this is pure TA only. Not a financial advice.

BTCUSD 2ZMOON 1.09HI CRYPTO WORLD !!!!
How are u? I am fine !!!
Daily BTCUSD chart is HERE!
We may experience a correction from current level.
god bless you ALL and have a great day!

HODL Your BTC!
Hello friends
I hope you have good trading days.
After several analyzes on different coins, I found this pattern.
We are at an important point in the weekly time frame.
Bitcoin once had a failed breakout from this area.
We expect this level to be successfully broken this time and the price to move above the channel.
About 400% movement.
And you can keep your bitcoins up to the top of the channel.
But keep in mind that our midline is not broken yet.
And we have to wait for that to happen.
If the level is broken, I think this will be the last bitcoin point for the high price.
And after reaching the top of the channel, the main Bitcoin drop will start.
And it will lose its ascending channel after moving in a falling triangle.
Of course, in my opinion, the first wave of bitcoin rise will enter the correction.
A really deep correction.
The biggest correction he has ever seen.
But after this deep correction, the next and very strong wave will start, which will be wave 3.
But if the channel is broken up, we will climb as much as the initial move of bitcoin.
Which I think is very unlikely.
And bitcoin will enter a heavy phase of decline.
Anyway, now is the time to enjoy bitcoin.
But the real crypto winter will start from the top of this channel.
Of course, this is a 51% theory, which is only 1% more likely to happen.

BTCUSDT , We are near buy zone areaGood evening guys
According to the chart , we are in upward channel
We have some reaction to this channel and trend and we expect that this reaction is active and it can happen the price go up and continue their trend
But becareful it is high risk position and if the close candle can make hammer candle in 4h time-frame we can go and check the chart in lower time frame to take signal and take long position and buy BTC
Previous analysis :
Dont forget stop loss
Be with us and sleep comfortably
Good Luck
Abtin

What should we expect from the next Bitcoin movement?
The given pattern shows some datas about the big picture of Bitcoin. Shark pattern (OXABCD) is generally work well as you can see but we should be careful.
The Bullish Shark Pattern might link with a Bearish 5.0 pattern, so what is it? This is a warning note to be careful. If (0XABCD) pattern link with a 5.0 bearish pattern and we havent got an enough volume to go high, we may expect to fall. I mean that (CD) leg might be a correction of the fall of (BC) leg so we can see a new decrease. If it happens, we may see in order
TP1:42793
TP2:39805
TP3:37543
TP4:35410
GOOD LUCK.

BTCUSDT 1hr Demand and Supply Zonehere are Lower timeframe BTC Importance BUY/SELL Zones... on daily timeframe btc tested fresh supply zone of weekly bt there is not strong evidence of bears in this area.

btc daily chartbitcoin daily chart in a up trend , an i think after the Correction btc can break the alltime high price .
RSI daily shows that price need correction for continue the up trend

THE RSI INDICATOR WILL TELL YOU WHEN BTC REACHES THE NEW ATHIf we look at the RSI indicator on the BTC monthly chart, we can see a very interesting pattern. In fact, we can see that for both cycles preceding the current one (perhaps also for the first cycle but unfortunately we do not have the data), the indicator had signaled the top very precisely: both bull runs ended once the IRS closed above the mid-uptrend overbought RSI signal. To date, we can say that this pattern is also repeating itself in this cycle: we had the first overbought RSI signal (fake), followed by the classic correction (bear trap) and then the resumption of the uptrend which, if this strategy is correct, will end when the IRS closes above the March 2021 signal.
Like if you appreciated the idea and comment below what you think, especially if you don't agree with me!

BTC/USDT | Opportunity to buyHi guys
In my opinion, Bitcoin has started a long-term uptrend
I had previously predicted this price increase:
What do you think? Comment for us
