BTC bounce levels ? From where you can think of long positions Hi, first and most imp advice is wait for market to settle down a lil bit don't force trades.If you are holders then buy at every bounce levels , Buy in parts. But if you are future traders your concern should not be that market prices are higher or lowers you should wait for proper entry
Here I pointed on some of the strong bounce levels of BTC 47 levels becomes weak as it was most hitted by BTC , Yesterday pump was not a actual strong pump as BTC volume was on the lower side it was just the manipulation of the market just future traders and scalper can take advantage of that situation
Now before taking entries you to watch for how this strong support reacts, I am mentioning a diff bounce levels from where you can think of long by looking at the volume inflow and reaction at support
1st level is 46600
2nd level is 45500
3rd level is 44100
From these levels BTC can bounce back most probably we will visit 45
Comment below what you think
Btcusdidea

Bitcoin levelsBtc correction and their levels if it breaks the 47-46k zone
44-42k will be potential support to hold on as of current speculation

BTCUSDTBitcoin On Very Strong Support We Can Expect Some Good Move From Here If Btc Didn't Breakdown Below $47000.
#Bitcoin #Btc $Btc #Crypto

Bitcoin- To rise from supportAfter breaking above 50k for a short period, Bitcoin has corrected and now is trading in 48k support zone.
A new leg up can follow and short term traders can target the previous high with a good R:R ratio

BTC is making Head & Shoulder bear signBTC is making head and shoulder on hour chart Bear signal on chart take avoid Entry for long


btcusdtbtcusdt
wait for confirmation and hold suport level (41-45)
we can buy bitcoin in 41600 if btc hold this level(41000)
first target is 64000 and second target 87000$
if we lost 41000 level in daily time frime this idea fail :(

BTC BullishBTC is on wave 3 and according to correction of elliott wave2 , end of wave 3 will be 75000

BTC/USDT 4rChart Analysis4th Wave of impulsive wave Completed
Now we Can see Correction of 5th wave 48.5K, 49K ,50K

BTC/USD BIG $BTC DUMP COMING!BIG $BTC DUMP COMING! Bitcoin can fall This is a pattern that is always repeated.
Bitcoin has a downward trend to MA50, then rises above it for a few weeks, and after falling to MA200. Friends, push the like button, write a comment, and share with your mates - that would be the best THANK YOU.

Bitcoin in Correction mode. Will Hit 42.5K zoneBitcoin has broken lower channel have retested it.
At this stage next support it can find is at 42500 zone. Most probably it should bounce off this support.
However if it is unable to hold this support, then next support is at 40800 zone.
If you like my analysis then do drop a LIKE and a COMMENT. Also do SHARE it with your friends.
Also don't forget to smash that FOLLOW button to get daily analysis of multiple crypto currencies and sometime ASX stocks.
Note - These are my personal notes and in no way a financial advice. Do your own research and Trade wisely

BTC/USD macd tells us everything The price can go down to $ 42,500, where there is good support for bitcoin.Friends, push the like button, write a comment, and share with your mates - that would be the best THANK YOU.

BTCUSD (Update) : Bullish or Bearish ??Well, as we saw last night, the price of bitcoin moved to $ 48,000 and then started a correction, this is a very important level both psychologically and technically, so this correction is normal and there is no need to panic, well now We have specified the next bit targets on the chart and expect that range to grow soon. Important support levels are in the range of 45,000, 42,000 and finally 40,000 ....

BTC/USD LONG TRADE IDEA4H Time Frame ⏳
➡️ Bitcoin has this channel in 4h time frame.
➡️ The bottom of this channel is the support of bitcoin (≈45,700), If price react to it then we can see another top which is around $50,000
➡️ But also there is a double top pattern and if BTC lose this channel then price corrects to $44,000.

Bitcoin to the Moon🚀🌚🎇 After weeks of suffering in the area between $ 30,000 and $ 40,000, Bitcoin has finally broken the $ 40,000 area and stabilized its price above this area. Bitcoin returned to static and dynamic support where it touched its dynamic support for the third time. The downside trend of the RSI has been broken for several weeks and we can expect the bitcoin to start moving towards the targets drawn in the chart.
The analysis is just a series of probabilities.
I hope you find this analysis useful🌹
Follow for more...
#DYOR

Bitcoin Update 14/08/21: Short-term Swing OpportunityBitcoin Update 14/08/21: Update: Currently 4% Gain from this Short-term Swing Opportunity, stops just below $43,812, TP @ $51,068 at the 61.80% Fibs, additional TP at the 78.60% @ $57,125 (19% Gain from current price level). Please see previous analysis below. Happy Trading :)
The Bitcoin Bulls are Back! After setting a new ATH @ $64,841 in April, Bitcoin experienced its the first major sell (some may say manipulated) off in this Bull Run Cycle (-50% from the top). We have been closely watching the BTC chart for a strong trend reversal signal. From the ATH @ $64,841, Bitcoin formed a triple bottom in the $28-30k region, the last bottom experienced on the 21st July is confirmed as our bottom here. The Swing Call Script gave further confirmation of the strong trend reversal as a Buy signal was triggered on the 4H Chart on the 22 July and further on the 6th August showing strong signs of bullish momentum back into the market.
From here we expect BTC to retest the current ATH @ $64k which is a 40% Gain from the current price @ $45k. Further to this, we can expect some heavy resistance between the 61.80% - 78.60% fibonacci level. A clear break past the 78.60% fibonacci level see BTC setting a new ATH at the 127.20% fibonacci level. Please see previous analysis below. Happy Trading :)
BTC finally testing the 200 SMA and is showing strong signs of bullish momentum as we see the BTC Bulls coming back into the market 🚀. After 4 failed attempts of trying to break above the key resistance @ $38,595 BTC has finally broken above this key price level. Since the crash BTC found its Bottom tanking down -51% on the 19th May to $28,787 from $57,777 and had previous retraced from the ATH price @ $64,841 to $46,814 (-27%). BTC has been in a whale accumulation zone for the past 27 days from 19th May to 15th June. Our Swing Call Script triggered a strong buy signal for #BTC LONG when the 13 EMA crossed up above the 50 SMA on the 10th June; BTC has since increased over 10% in just over 5 days. From the current price level we have longs positioned and the current TP 1 is at the 127.20% Fibonacci level @ $74,647 (85% gain from current price level) and TP 2 at the 161.80% Fibonacci level @ $87,122 (116% from current price level). Note the price targets are for long term swings, we may be in this accumulation phase a little longer. Happy Trading :). See previous analysis below.
Bitcoin Update 02/04/21 Next Target @ $66,953 13% Gain New ATH in April
I've loved charting BTC last Month, analysis has been quite spot on just waiting on our new ATH now @$66,953 13% Gain from current price level. #Bitcoin has found key support around $58k price level. It looks like the Bitcoin Bulls are back in the market. Worst case scenario from here in the short-term could see the price test the 50SMA, and breaking below this level would see another test of the 200SMA before the anticipated move to the upside and our target of $66.953 at the 127.20% Fibonacci level. See previous analysis below. Happy trading :)
Update 29/03/21 Bitcoin next Target @ $66,953 21% Gain
Nice bounce from the whale accumulation zone at the 78.60% Fibonacci Level. Looks like the BTC Bulls are back in the market.
See previous analysis below.
BTC Monthly Outlook Update (23/03/2021) Approaching Whale Accumulation Zone at the 78.60% Fibonacci level @ $52,371. Interesting next few days from here as a bounce from the 200 SMA at the whale accumulation zone could finally see us break through the key resistance at the current ATH level from 14/03/21 @ $61,690. April is set to be a very interesting and pivotal month for the cryptocurrency space. See previous analysis and monthly outlook below. Happy Trading :) #whaleaccumulationzone
Update 21/03/21: Yesterday the Bulls failed to push the price higher and we had a small retracement down from $59.5k to $55.6 where we found some support of the current price level (-7%). From here the worst case scenario would find us in a key whale accumulation zone @ 78.60% Fibonacci level $52,371. However this scenario is unlikely to play out and as expected from the previous outlook before, we expect the Bulls to come back in the market, pushing as further to higher highs as we have been consolidating around this key price range between $54.5K to the current ATH @ $61.8k. If we fail to break past the previous ATH , the bearish scenario may see a test of the 200 SMA around the 78.60% Fibonacci level, otherwise the Bullish scenario is still in play. Note that from this current trend from 28th January we have only tested the 200 SMA once and a bounce from this level may signal a much stronger bullish move towards our price target $77,335 @ the 161.80% Fibonacci extension and further $107,340 @ the 261.80% Fibonacci level. So far great performance this month from £BTC as March is usually quite a bearish month looking back at the past. April looks ready for us to really fly, testing the 161.80% Fibonacci extension , but note this may not be a straight forward push but all the fundamentals are pointing towards the $70K as our next significant area of interest for the Bulls, currently a 16% gain from the current price level would see BTC reach $66,953 127.20% Fib extension. See previous analysis from 1st March 2021 below. Happy Trading :) $BTC #HODL
*Update 20/03/21
#BTC Monthly Outlook Update from 1st March 2021; 13 EMA crossing up 50 SMA showing strong bullish sentiment as we are about to enter the last week of the month, expect the bulls to come back and to push the price higher. Currently the 127.20% Fibonacci Target ($66,953) has not been tested yet, but we expect some big movement in price over the next few days and further going into the last week of the month (Yes, it has been March Madness), 13% Gain from the current price level @ $59,390 to $66,953 127.20% Fib extension. Our next target after this is $77,335 @ the 161.80% Fibonacci extension . From our analysis at the beginning of the month It looks like scenario 2 has been in play, see below previous analysis from 2nd March 2021.
In addition to previous price analysis, the Cryptocurrency 'Super Cycle' is in play as we are just at the brink of global adoption. 2017/18 was the hype era, we cannot continue to set targets based on the price movements during the cycle mainly fuelled by hyper and euphoria, it is now 4 years later and real development has been happening behind the scenes, a lot of people cannot quite comprehend the growth and the different cycle that we are now in as Moore's Law of exponential growth can only give us a hint at the growth that is about to be experienced over the next 4 year cycle. An increased influx of capital injection into this now trillion dollar market will only continue, as Defi takes its hold on current Global financial infrastructure, and yes history repeats itself, We call this the 'Roaring 20s' just like before at the end of WW1, the pandemic has only accelerated the current adoption rate of blockchain technology. As some are already aware, the best time to grow a million dollar portfolio was from 2009 to 2019 just after the housing market crash. The second best time in our lifetime is Now! from 2021 to 2029 after the pandemic market crash. We are still very much Bullish for BTC to reach our EOY Target of $356,000, See below key fundamentals which support our bullish sentiment.
*(March 02, 2021 Update)
BTC is currently consolidating at 61.80 Fibonacci Level. BTC outlook for the month ahead is still very much bullish . Although the sellers have been in control of the market since soaring to a new ATH on 21/02/21, BTC took a sharp retracement as expected at these new level of resistance as well as a new ATHof$58,792 on the Gemini Exchange. As from historic highs we see a lot of profit taking occurring after 3 weeks of setting new constant highs from the previous low of the last push wave which saw BTC setting a high of $42K and then sharply retracing down to $28,787 where we found the previous resistance and also the beginning of the last phase which saw one of the greatest run of Bitcoin in history, reaching the current ATH of $58,792.
With the current push phase now over we find ourselves asking how low can we go from here and when do we expect to break past a new ATH . This outlook is based on 2 possible scenarios which could both play out. We have seen the 50% Fibonacci retracement level respected on the last 2 Push phases which both set new ATHs, the first being $42K and latter, the recent high of $58K. As we have seen a strong retracement over the past 7 days back down to the 50% Fibonacci, it may be time for the BTC Bulls to regain control of the market as the current fundamentals point to the 50%-38.2% Fibonacci level of key resistance as well as a point of accumulation for the BTC whales, more importantly the $39,000 mark when looking left at the previous key resistance before the parabolic move to the $58k ATH .
With this in mind, from the current levels we could see the price of BTC sink further before the much expected move which could see BTC testing the previous High of $58k and further pushing to the 127.20% Fibonacci extension level setting a new ATH @ $66,953.
Scenario 2 would see the current push towards the ATH continue but may face some resistance, and further consolidation expected around $46k-$49k as they are the key Whale Supports towards the upside, so a further retracement could be in play, possibly testing the 50% Fibonacci level, as well as the 50 SMA , with a bounce confirming an explosive move to the upside which could see BTC easily smash past the 127.20% Fib extension level setting new fresh Highs between $67,000-$78,400+ by mid to late March. Use the buy zone indicated to map out your position as a possible 52% gain is achievable from the Buy zone. Stochastics showing an extremely oversold market condition. Happy Trading :) *
Key Supporting Fundamentals for BTC:
Strong Interest of Institutional Players
A survey of institutional investors and wealth managers who already engage with bitcoin reveals that 85 per cent plan to increase their investment in the cryptocurrency over the next two years.
The survey, which was commissioned by Nickel Digital Asset Management (Nickel), a regulated investment manager connecting traditional finance with the digital assets market, also reveals that between now and 2023, 72 per cent expect professional investors in general to invest in bitcoin for the first time or increase their exposure.
Current Economic Instability
The policy of the US Federal Reserve and the economic instability that has arisen as a result of the unprecedented emission of new dollars may further play a role in the growth of Bitcoin price...10% of the $380 billion stimulus money could be going directly into cryptocurrencies and Bitcoin .
Digital Gold
Crypto currencies certainly look as if they’re here to stay. It makes a lot of sense to have them in an increasingly digitised world. While bitcoin has a strong tendency to polarise opinion, it has now gained acceptance among some of the world’s largest financial institutions and payments companies. MasterCard, for instance, has said it will begin supporting crypto currencies on its network later this year. PayPal already allows eligible users to buy, sell and hold bitcoin in the US and expects to roll out its service in other territories soon.
The Case For Global Adoption and New Reserve Currency
Cryptocurrencies promise to help solve problems that are particularly acute in emerging markets (EM). Their governments are often centralized but relatively unreliable, which destabilizes currencies, opens the door to profiteering middlemen, and erodes public trust. Blockchain, the technology behind Bitcoin’s decentralized network, promises to cut out the grasping hands of governments and middlemen, and speed up transactions with more transparency and lower fees. It is offering what many EM customers are desperate for.
The Development and Extensions of Blockchain Technology
Due to the nature of blockchain technology’s ability to benefit all parties involved in different business operations. Since it was introduced in 2009 through the application of Bitcoin , blockchain technology continues to attract not just the financial institutions of the world, but also other fields and industries in insurance , law, entertainment and the Internet of Things ( IOT ) applications. Several scholars and advocates have also strongly suggested the use of the technology in voting systems globally, medical records and vehicle registrations by the state to further increase efficiency, simultaneously eradicating fraud in many areas. This technology does not only aim to improve conventional business operations but can also empower the greater society out of poverty as 1.7 billion adults in the world remain unbanked. The widespread adoption of a cryptocurrency like bitcoin running on the blockchain would mean that anyone with access to the internet can send and receive value from point A to B without the need of a third party.
Although many Banks were very hesitant and in fact spread fear in the markets due to cryptocurrencies being linked to nefarious activities on the dark web. A recent study by Goldman Sachs suggested that the adoption of blockchain technology in facilitating seamless cross border transactions without the worry of fraudulent transactions could save up to $6 billion a year; as the new models currently being developed by the bank would mean inefficient payment and accounting networks would be eradicated.

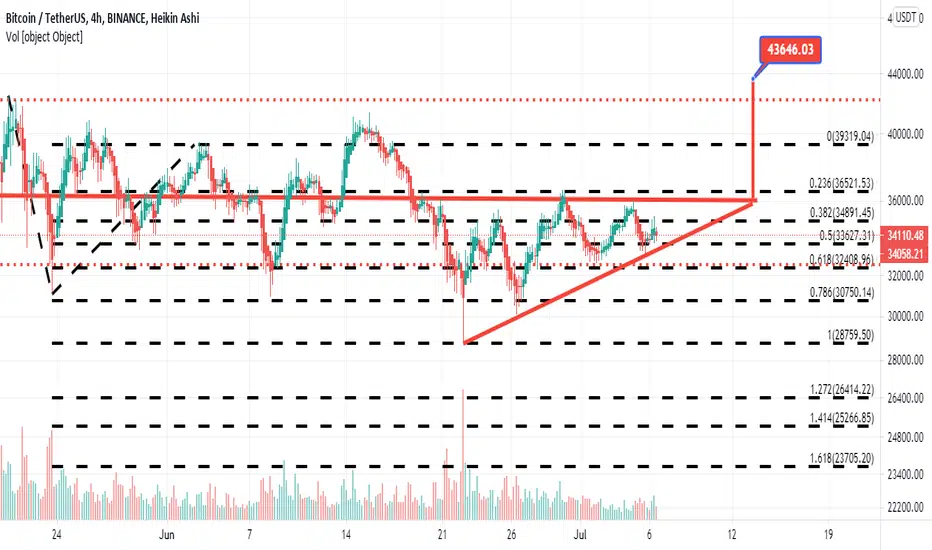
For Education Purpose ''Not Fınancıal Advise''Hi everyone,
BTC is looking good for 4H graph and If BTC breaks the 36000 resistance powerfully, we may see 43470 level. But be careful to volume. Good luck.

BTCUSD - Bitcoin Next Bullish moveBTCUSD - Bitcoin Next Bullish move expected
The currently BTCUSD market is at the strong support level and also on support trend line

LongBitcoin long opportunity. If bitcoin retraces to that level, I'll be looking for long opportunities with the order flow been bullish.

BTCUSDT gonna Short!BTCUSDT pullback done!
Now, its create hidden bearish divergence formation! And i anticipated she gonna create Classical Head & Shoulder.

BTC/USD BIG $BTC DUMP COMING!BIG $BTC DUMP COMING! Bitcoin can fall This is a pattern that is always repeated.

BTCUSDIf range 1 is not broken
There is a possibility of correction up to range 2
And this will be the movement of Kish Vmat for the bears
