BTCUSD BUY setupright now price is in the bullish trend it needs to respect the market structure and make Higher low and start going up
Btcusdidea

Scalp short BTCTesting diagonal resistance since uptrend started last year. High probability short with tigh invalidation
Bitcoin is losing steamAlthough Bitcoin made some new local highs in the past few days, these are marginal and without conviction.
Considering the 50% rise in not even a month, a correction is not only normal but is healthy.
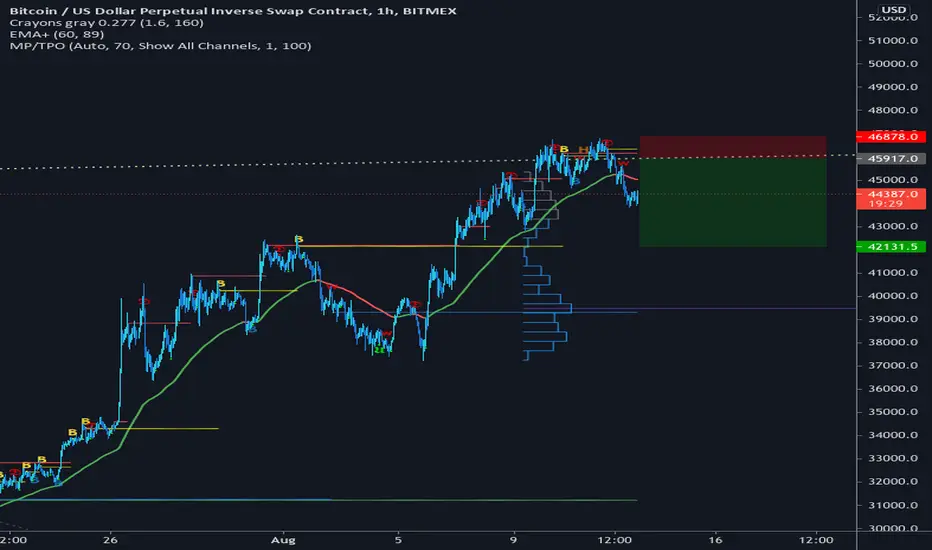
From the technical point of view, 47k zone could be a double top, and the rising trend line is also broken.
I expect a drop to 42k zone

BTCUSD UPDATEPossible correction incoming after a rejection at $466696 with a shooting star @ D1
Support levels: 44k, 43k, 40k
Time to trail your stops or close some position of some coins to buy the dip
We will trade the flow; the trend is our friend.
Trade safe!
#bitcoin #buythedip #e2kclicks

btcusd analysisCheck very well guys I will try and clean my chart next time it was just a fast analysis, but I know you will love it.

BTC Short at The Most Logical Level EverI'm waiting for 48.8k to short BTC, it's the logical level to short if the trend continues.
The reason :
-At the support turn resistance (Green Line)
-At the gap area ( Blue area, (i think it will fill the upper gap then will fill the lower gap ))
-At 0.5 - 0.618 the fibonacci area (Golden Zone)
-At the supply zone
-Entering the growing moon phase (you can see in the price before, always go down after entering the growing moon phase)

BTCUSD Under A Big Resistance : Please Read The CaptionAs we can see, the price of Bitcoin has reached an important level of resistance and it is possible that it will start to correct the price from this range. The first significant support level is $ 42,550 and the second support level is $ 40,000. Also, if enough volume is entered from the purchase order, this resistance level may be broken and we will reach our next targets, the first target is $ 47,850 and the second target is $ 50,600. Be sure to ask if you have any questions.

BTCUSD Idea and SignalHave a pullback and Growing When touched Support 44500 ( This scenario is 60% likely to occur )
If and when breaking the support have falling ( and this one 40% likely to occur )

Bitcoin- where to buy?Since the recent 30k low, BtcfUsd has risen 50% in a very short period of time.
At this point, a correction could follow and in my opinion, 45k is not a good place to buy.
I will wait with my buying orders for the price to roll back and 40.500-41k is the zone that I'm looking for


BTC IDEA 2 SCENARIO(scenario 2 for me its better)
scenario 1 shows increases in my opinion somewhere to around $ 50k, scenario 2 which in my opinion is better because RSI is very high, MACD on 4h chart curves down and shows sellers strength if we go down to $ 40-42k for btc it's a good idea to buy altos and hold them while the btc goes sideways.

btcusd longbtcusd buy :
Reasons :
1)ema lines crossed
2)hill type pattern trend has been formed
it will come down to the support level and then the entry point will be the first support level i.e the blue line and the next support level would be the take profit level
take profit : green line
entry : blue line


BTCUSDBITCOIN was trading in a range for a long time, but now we are seeing a massive breakout of the resistance level. With the price closing way above it, turns the level into the support. I think that we will see a retest of this support with some consolidation and a move up. That might trigger a retest of the all time highs before this years end!

BTC Analysis 7th August 2021AS the chart tell us BTC price on 7th August 2021
BTC already break sideway range zone 30.000-40.800
BTC break out downtrend line from 64.000 which have three touching point 64.000 , 59.000, 42.000
BTC is testing the MA200 on Daily Chart around 44860
Senario 1: Fail MA200 testing 40000-42300 price zone then up again.
Senario 2: Break MA200 , heading to 49.000-51.000
Personal opinion: Strong sell around 49.000-51.000 price zone, since it would confirm the uptrend or not

BTC Duel Of Fates!As we look at the $42K price zone we see a lot of confluence in this zone. BTC is currently at a very important price juncture and how it reacts will dictate the direction the market takes in the coming weeks/months. Personally, I'm in the bullish camp and I believe BTC has the steam to continue the bull market, unlike many others believe. I believe this price zone is far more important than many realize and admittedly, failure at this price zone will not be a good sign for the bulls. We'll need to carefully monitor what direction the market takes this week and react accordingly.

BTC ANALYSIS AFTER BUYER HAVE REACHED THIER HIGHT THEY COULD AT THE POINT OF INTEREST WHICH IS KEY LEVEL FOR OB 41K+ ,SELLER ARE MORE IN THE MARKET AS THE TREND IS NOW A DOWN TREND.
So after every pullback we should be having more of shorts than buys!
Let's see how we make some moves with this analysis.

Bitcoin- Strong intraday reversalAs I said a couple of times this week, I expect a new leg up from Btc and the main crypto can reach 48k zone.
Yesterday, Bitcoin started the day badly and has dropped to a 37k low.
From here bulls took total control and BtcUsd has finished the day in the green.
This is a clear indication for me that a higher low is in place and we can expect a higher high soon.
48k remains my target and dips should be bought.
Only under 36-36.5k we have reasons of concern.

Bitcoin: Pullback time!After Musk and Amazon sent BTCUSD on a massive rally, the time has come for a pullback. In this video, I will attempt to pinpoint
to what level I believe price will correct to.
I will identify three confluences to support my analysis.

BTC/USDTBTC is currently moving in a symmetrical triangle with more chances of a break on the upside......... Target mentioned

Bitcoin- Next target 48k?The correction could be over in Bitcoin's case, with a bullish engulfing pattern yesterday.
A steady BtcUsd above 40k would bring more confirmation for that and 48k could be buyers target

Bitcoin- New leg up after correction?After an impressive rally, BtcUsd has started to correct, just from the descending trend line.
As long as 35-36k zone is intact, the probability of a new leg up is very high.
I'm looking to buy dips for a new recent high above 45k

Can BTCUSD hit 46000$ level again?I think price conformation top of 40000$ level can change the Game.
