BTCUSD LONG SPOT & CFD CONFIGURATION Hello traders,
this is my analysis for BITSTAMP:BTCUSD and the way I will operate.
Post your idea/analysis below for discussion.
Thank you all for your support.
For mentoring services, FX signals, Crypto, Indices and Stocks PM me.
Btcusdidea

H4 BTCUSDTmost likely btc will be down, but this time does not rule out the possibility will be up too. just wait for the break out and beware to false break.


For Education Purpose ''Not Fınancıal Advise''The presented chart shows the data about an important resistance level 36542 . I expect that somewhat fall from there to nearly 30000.

Bitcoin- will this be the week?As I said in my previous analysis, it is clear for me from, watching the price evolution, that bulls are very weak when it comes to crypto market.
In Bitcoin's case, every rally was considered a good opportunity for sellers and I expect bitcoin to fall further.
Last week was a range trading one with price congesting and congesting.
A break under support looks unavoidable at this moment and Stop Losses under 30k should lead to acceleration.
20k is still my medium-term target with interim support at 25k
Only strong buying power and BtcUsd above 35k would change my opinion

BTCUSD vs GOLDBuy when the price going dip, Buy when the people worry, buy when the people panic, buy when the people on fear.
Hold it and take some coffee. close your ear don't hear anything about people said.
bitcoin is the best long term trade for me. not for daily or weekly. I see always for monthly
All billionaires do this way.
As we see, there is no buyers on bitcoin.
As my opinion, bitcoin correlation with GOLD.
Gold seems still uptrend.
Good luck. Play safe and manage your leverage.


Bitcoin trading in a range Bitcoin is trading in the range of $30,000 - $40,000 with huge wicks on both sides. Bitcoin is in the range for almost two months. The lower point of the trading range is $30,000-$31,000. The midpoint of the range is $35,000-$36,000 and the upper point of the range is $40,000-$41,000. A daily candle that closes below $31,000 is bearish and will bring more dump. BTC needs to break and hold above $36,000 to turn bullish and go towards the upper band of the range.

Where to buy Bitcoin ? BLXIdea for BTC
23.61 line is best and most appropriate line for a reversal
this will be the third touch of support on this line, and a great point for reversal
Coinciding with the curved trendline that has developed, it just makes sense
Resistance areas in red, green areas are support
~30K (29k if you are good)

BTCUSD - Elliott Waves Prediction on Weekly Chart (Logarithmic)Hi guys,
So I've decided to take a look at Bitcoin's weekly chart with Elliott Waves approach.
I need to mention that I'm considering the pandemic drop, and the following weeks until the price comes back into its original channel, as a slope. Let's take a look as if it never happened.
First, let's take a look at the 4 main rules of Elliott Waves and see if they match this prediction. I'll add a check or uncheck next to each item.
1- Wave 2 can never retrace past wave 1 -- check --
2- Wave 3 can never be the shortest wave -- check --
3- Wave 4 can never retrace past wave 3 -- check --
4- If wave 2 is a flat correction, then wave 4 will be a sharp correction (or vice versa) -- check --
Ok, so we have the basics and main rules of the EW theory is checked.
Now let's take a look at some major "kind of bendable" rules.
A- If wave 3 is the longest (extended), then wave 1 equals to or very close to wave 5 -- this is our prediction --
B- Most of the time, wave 2 fibo retracement matches the wave 4 fibo retracement -- check --
C- Almost all larger frame impulses have subdivided impulses in smaller frames -- check --
So, we might have this theory in place when it comes to larger frame prediction of Bitcoin.
The main rules are intact. A few other rules are also good. If you would like to read more about Elliott Waves principles, here's a nice 6 page PDF that has been published publicly.
www.researchgate.net
According to these statements, we must see a weekly close above 35500 area within the next 4-5 weeks.
Take into consider those blue trend lines, that is our main channel.
If we see a break and close below that blue channel on the weekly frame, this whole prediction might easily turn into a garbage because that break below will have the potential of a continuation of the bear market, so the price may move to the top of wave 1 or even below.
Which will ignore this whole schematic because when it comes to EW strategy, at least the main rules shared above must be followed precisely. If one of them is broken, you will need to restart counting waves.
So we consider the pandemic drop as a slope and 3rd wave extended, then we might predict the fifth wave now accordingly.
Most commonly, as stated in rule A, wave 1 will be equal or similar to wave 5. Both in price and, again most commonly, in date aspects too.
Based on this scenario, we have a huge potential of getting to see 100K to 125K by the end of this year or the beginning of 2022.
Feel free to check smaller frames to see if the subdivided impulses and corrections are there. You'll see that they are. And these subdivides are a variety of shapes, patterns etc. all leading to this weekly main strategy.
Looking forward to hearing back from you guys on this prediction and details. Take care.
As always; this is no financial advise of any sort and please DYOR!
Cheers.

💎BTC: Will This Falling Channel will Give Breakout Upside🤔🤔🤔Hello Dear Traders,
As u can see in chart btc is trading in falling wedge, most of the time falling wedge breaks upside.
Btc tested lower trendline of falling channel and on lower timeframe we can see buying pressure. if btc sustains above trendline and gives bullish cloisng on daily then we can expect btc retesting 33500-34000$ in 2 days.

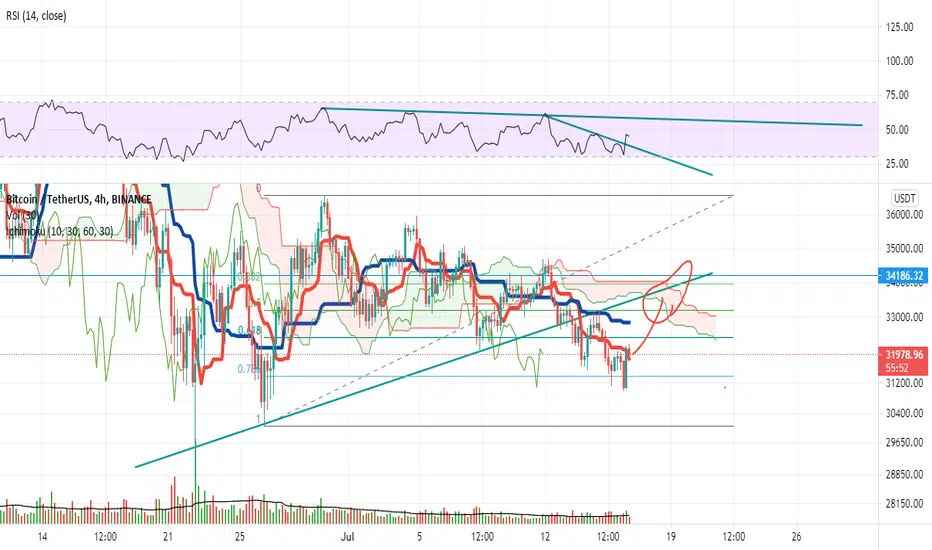
BTCUSDT - Three Drives Pattern Potential on 8H Time FrameHey Guys,
BTC seems to be forming a three drives pattern on 8 hours chart.
If this pattern completes as predicted, the price should hit 31500 area, between 14-15 July most probably, and then begin to rise after that to near the top of the first wave, 36500 area.
Following this up to take a long position. This is a great and reliable bullish pattern, only if it's completes as in the chart above. 1 final wave to go. Let's see.
Investment strategy: Long, only after if the pattern is complete.
PS: No financial advise, always DYOR.
Cheers.
