Bitcoin - Strategic Coil Within the Arcane Band.⊢
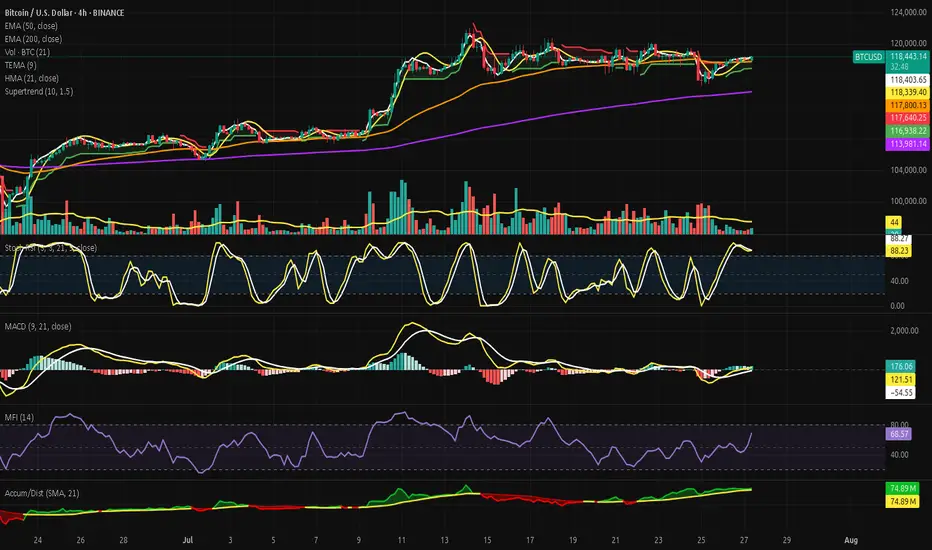
⟁ BTC/USD - BINANCE - (CHART: 4H) - (July 27, 2025).
◇ Analysis Price: $118.309,59.
⊣
⨀ I. Temporal Axis - Strategic Interval - (4H):
▦ TEMA9 - ($118.338,48):
∴ Price is currently below TEMA9, indicating near-term resistance;
∴ Curve is upward-sloping but flattening, suggesting fading acceleration;
∴ Acts as reactive signal line; minor rejection occurred on contact.
✴️ Conclusion: Momentum fading as price struggles to hold above dynamic resistance.
⊢
▦ HMA21 - ($118.324,83):
∴ Smooth curvature maintaining upward bias;
∴ Close proximity to TEMA9 shows compressed volatility regime;
∴ Price interacting with HMA without definitive breakout.
✴️ Conclusion: Tactical direction remains constructive, but confirmation is lacking.
⊢
▦ EMA50 - ($117.794,89):
∴ Strong medium-term support; price remains above it with clear respect;
∴ Acts as lower bound of the current compression channel;
∴ No bearish cross detected with TEMA or HMA.
✴️ Conclusion: Mid-term bullish support structure intact.
⊢
▦ EMA200 - ($113.979,81):
∴ Structure well below active price; rising and stable;
∴ Indicates long-term bullish posture is unbroken;
∴ No signs of major breakdown or transition to bear structure.
✴️ Conclusion: Structural uptrend remains unthreatened.
⊢
▦ SuperTrend Arcanvm - (ATR 10, 1.5 - $117.640,25):
∴ Price trades above the SuperTrend line, indicating continuation zone;
∴ Support zone lifted slightly, confirming minor trend maintenance;
∴ No signal reversal or close below since last shift.
✴️ Conclusion: Tactical upward bias protected by volatility-based support.
⊢
⨀ II. Momentum & Pressure Indicators:
▦ Stochastic RSI (3,3,21,9) - (%K: 88.23 / %D: 88.27):
∴ Deep into overbought zone; potential reversal region;
∴ Minor negative crossover forming (%K < %D);
∴ Pattern shows repeated false breaks from high zone.
✴️ Conclusion: Overextended with local fatigue building.
⊢
▦ MACD (9,21,9)- (Line: 164.40 / Signal: 106.94 / Histogram: +57.47):
∴ Bullish crossover confirmed and holding; histogram positive;
∴ Increasing MACD separation suggests underlying momentum;
∴ No divergence yet; consistent short-term upside energy.
✴️ Conclusion: Momentum favors bulls but remains immature.
⊢
▦ MFI (14) - (68.20):
∴ Trending toward overbought zone without breach;
∴ Steady increase reflects sustained volume-backed inflows;
∴ Not yet extreme; still has energy potential to fuel move.
✴️ Conclusion: Volume pressure supports bullish case with room left.
⊢
▦ Accumulation/Distribution + HMA21 - (74.89M):
∴ Line remains stable above short-term base; no outflow signals;
∴ Slight incline observed, confirming ongoing accumulation;
∴ No divergence with price; consistent flow.
✴️ Conclusion: Capital positioning remains supportive of continuation.
⊢
🜎 Strategic Insight - Technical Oracle:
∴ The current 4H structure on BTC/USD exhibits a compressed upward bias where dynamic resistance (TEMA + HMA) is being tested persistently but without explosive breakout;
∴ Momentum indicators (MACD, MFI) confirm early-stage bullish pressure, while structural supports (EMA50, SuperTrend) remain intact and responsive;
∴ However, Stoch RSI is saturated, suggesting that any continuation would likely require a cooling cycle or shallow retracement before sustainable thrust;
∴ This configuration aligns with a “Pre-Break Range Staging” - a technical limbo where buyers are present but cautious, and sellers are absorbed without significant follow-through.
✴️ Strategic Focus: Watch for confirmation above ($118.600) with volume expansion and MACD histogram follow-through, or a soft retest toward ($117.640/117.800) as reloading zone.
∴ Logic sealed. Tactical silence until resolution.
⊢
𓂀 Stoic-Structural Interpretation:
▦ Structurally Bullish - (Tactically Fragile Continuation):
∴ The long-term structure (EMA 200 rising, unbroken) confirms a preserved bullish frame;
∴ Mid-term support (EMA 50 + SuperTrend) is active and functioning as a technical base;
∴ However, price struggles to sustain above dynamic resistance (TEMA/HMA), and Stoch RSI signals short-term exhaustion.
✴️ Conclusion: The structure is upward, but the current tactical zone is sensitive. Any bullish continuation demands confirmation and discipline - no chasing.
⊢
▦ Tactical Range Caution:
∴ Support Zone - (Defensive): $117,640 / $117,800;
∴ Resistance Ceiling - (Breakout Trigger): $118,600;
∴ Tactical Neutral Band: $118,000 / $118,300.
✴️ Conclusion: No trade zone expands if compression persists. Breakout or breakdown must be decisive and accompanied by volume/momentum synchrony.
⊢
◩ Codicillus Silentii - Strategic Note:
∴ In moments of compressed structure near resistance, the market does not reveal itself through price - but through how it refuses to move. Silence becomes signal;
∴ What is observed here is not a lack of momentum - but deliberate withholding of directional intent;
∴ The system is balanced between emergent buy pressure (MACD, MFI, Accum/Dist) and short-term saturation (Stoch RSI), forming a strategic standoff:
No major actors are retreating, but none are charging forward either.
The candle bodies shrink while oscillators extend - a classic sign of non-confirmed bullish bias.
Emotional traders will chase; initiated ones will wait for the candle that breaks the silence, not the one that whispers hope.
✴️ Final Seal: The stoic operator does not react to pressure - he reacts to structure.
Tactical inaction is a move; Watching is positioning; Discipline is participation.
⊢
⧉
· Cryptorvm Dominvs · MAGISTER ARCANVM · Vox Primordialis ·
⚜️ ⌬ - Silence precedes the next force. Structure is sacred - ⌬ ⚜️
⧉
⊢
Btcusdindicators
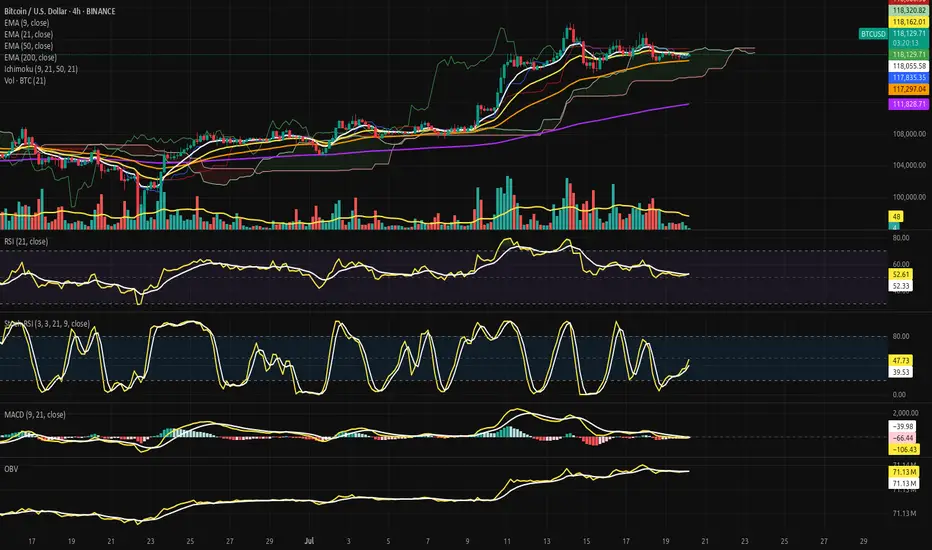
Bitcoin Suspended Beneath the Ichimoku Silence.⊢
⨀ BTC/USD - BINANCE - (CHART: 4H) - (July 20, 2025).
◇ Analysis Price: $117,919.29.
⊣
⨀ I. Temporal Axis - Strategic Interval - (4H):
▦ EMA9 - (Exponential Moving Average - 9 Close):
∴ Price is currently hovering just below the EMA9 at $118,035.43, showing weakening immediate momentum;
∴ EMA9 is now flat-to-downsloping, indicating short-term loss of control from intraday bulls;
∴ Recent candles have failed to reclaim closes above EMA9, reflecting micro-resistance and tactical fragility.
✴️ Conclusion: Logic sealed - EMA9 has lost command; tactical control has shifted to neutrality with bear undertones.
⊢
▦ EMA21 - (Exponential Moving Average - 21 Close):
∴ EMA21 currently sits at $118,164.50, acting as an overhead suppressor;
∴ The gap between EMA9 and EMA21 is compressing, signaling potential for either crossover or volatility breakout;
∴ Price action is now trapped between EMA9 and EMA50, with EMA21 forming the upper barrier of a tactical box.
✴️ Conclusion: Logic sealed - EMA21 serves as containment lid; rejection here confirms tactical indecision.
⊢
▦ EMA50 - (Exponential Moving Average - 50 Close):
∴ EMA50 rests at $117,262.74, offering foundational support within the current structure;
∴ Price has respected this level on multiple dips since mid-July, confirming its strategic function as mid-term equilibrium;
∴ The slope remains mildly upward - no sign of reversal, only compression beneath.
✴️ Conclusion: Logic sealed - EMA50 maintains its structural role as mid-range dynamic floor.
⊢
▦ EMA200 - (Exponential Moving Average - 200 Close):
∴ EMA200 remains well below at $111,765.30, untouched since early July;
∴ Its wide distance from price confirms that the broader structure remains in bullish territory;
∴ Its trajectory continues upward, anchoring the uptrend beneath all volatility.
✴️ Conclusion: Logic sealed - EMA200 secures the long-term structure; market remains elevated far above reversal threshold.
⊢
▦ Ichimoku Cloud - (9, 21, 50, 21):
∴ Price is currently within the Kumo (cloud) zone, defined between SSA and SSB - a region of ambiguity and compression;
∴ The Senkou Span A and Span B are nearly flat, signaling lack of directional command in the near term;
∴ Kijun and Tenkan lines are converged, offering no trend bias - equilibrium is dominating.
✴️ Conclusion: Logic sealed - Ichimoku confirms a neutralized compression state; breakout required for trend clarity.
⊢
▦ RSI (21) + EMA9 - (Relative Strength Index with Signal Smoothing):
∴ RSI value stands at (51.48), while the EMA9-signal rests at (52.25) - confirming a soft bearish crossover;
∴ The RSI has declined from its recent peak and now oscillates around the neutral 50-line;
∴ Momentum is waning without structural damage, indicating tactical cooling.
✴️ Conclusion: Logic sealed - RSI confirms suspended momentum; structural neutrality prevails beneath fading thrust.
⊢
▦ Stochastic RSI - (3, 3, 21, 9):
∴ Current values are: (%K = 35.33), (%D = 32.68) - with %K slightly above %D, forming a mild bullish crossover;
∴ The oscillator has just risen from oversold levels, indicating potential energy buildup;
∴ Prior cycles in this zone have produced false starts, so confirmation is essential.
✴️ Conclusion: Logic sealed - Stoch RSI hints at rebounding energy, but with fragile structure and low reliability.
⊢
▦ MACD - (9, 21, 9 - EMA/EMA):
∴ MACD Line = (–105.52), Signal Line = (–129.07), Histogram = (+23.55) - confirming a bullish crossover;
∴ The crossover occurred below the zero line, indicating a possible reversal from weakness rather than strength;
∴ Slope of MACD is positive but modest - insufficient to declare dominant shift.
✴️ Conclusion: Logic sealed - MACD is in bullish transition mode, but still recovering from beneath structural base.
⊢
▦ OBV + EMA9 - (On-Balance Volume with Trend Overlay):
∴ OBV currently reads (71.13M), and is slightly above its EMA9, signaling retention of volume without strength;
∴ Volume has not left the system - but neither has it surged; this is passive accumulation at best;
∴ No divergence exists for now, but lack of buildup implies neutral positioning.
✴️ Conclusion: Logic sealed - OBV is stable and neutral; no buyer escape, but no commitment surge either.
⊢
▦ Volume + EMA21 – (Volume Profile with Trend Average):
∴ Current volume bar = (13.91), sitting below the EMA21 baseline;
∴ The volume profile across recent sessions is declining - suggesting consolidation or exhaustion;
∴ No breakout volume spike has accompanied price stabilization - trend is under silent compression.
✴️ Conclusion: Logic sealed - volume fails to validate price levels; tactical fragility remains unresolved.
⊢
🜎 Strategic Insight – Technical Oracle:
∴ The H4 structure presents a state of compression beneath a neutral cloud, suspended between tactical short-term EMA's (9, 21) and safeguarded by a rising EMA50 backbone;
∴ Momentum oscillators (RSI, Stoch RSI, MACD) converge toward reactivation, yet none have broken decisively above neutral thresholds - reflecting potential, not power;
∴ Volume participation is inconsistent and fading, offering no confirmation for breakout - the market is in silent observation mode, not assertion;
∴ Ichimoku confirms indecision: price floats within Kumo, without command or breakout - equilibrium reigns;
∴ Price positioning remains elevated above the deeper structure (EMA200), but its current zone between EMA9 and EMA50 represents a coil of indecision;
∴ The overall condition is not bearish - but it is tactically suspended, lacking conviction, awaiting external ignition.
✴️ Conclusion: The Oracle confirms - the structure is intact, but tactical initiative is lost; the field is poised, not marching.
⊢
∫ II. On-Chain Intelligence – (Source: CryptoQuant):
▦ Short-Term Holder (SOPR):
∴ SOPR currently reads (1.001), meaning short-term holders are spending coins with no significant profit or loss - a signal of economic neutrality;
∴ The chart displays persistent lateral volatility around the (1.0) threshold since early July - no emotional dominance in market behavior;
∴ This pattern historically coincides with pre-expansion compression phases, rather than breakdown events.
✴️ Conclusion: Logic sealed - SOPR confirms behavioral neutrality among short-term holders; the market remains in a state of expectation, not realization.
⊢
▦ STH-MVRV - (Short-Term Holder Market Value to Realized Value):
∴ The metric is currently oscillating around (1.30), well above the danger zone at (1.0), but far below the euphoria threshold at (1.8);
∴ The structure reflects multiple euphoria rejections, followed by a return to balance - a classic cooling-off pattern without structural failure;
∴ Convergence between market price, realized value, and short-term cost basis indicates the market is retesting foundation zones.
✴️ Conclusion: Logic sealed - STH-MVRV confirms post-euphoric cooling with structural support intact; no active trend, no breakdown.
⊢
▦ Exchange Inflow Spent Output Age Bands - (All Exchanges):
∴ Inflows to exchanges have been consistently low in recent weeks, particularly among young coins (0d–1d, 1d–1w) - showing no urgency to sell;
∴ Aged outputs (>6m) remain dormant - long-term holders are not mobilizing;
∴ The absence of inflow pressure signals no macro panic or exit event, reinforcing the diagnosis of tactical compression.
✴️ Conclusion: Logic sealed - muted inflows confirm a lack of distribution catalysts; stable structure sustains the technical silence on the 4H chart.
⊢
🜎 Strategic Insight - On-Chain Oracle:
∴ All three on-chain metrics converge into a clear state of tactical equilibrium - not bearish, not euphoric, but suspended between action and observation;
∴ Short-Term Holder SOPR stabilizes at (1.001), marking a precise psychological stasis - profit-taking and panic-selling are both absent;
∴ STH-MVRV confirms a post-euphoria cooldown with structural preservation, implying that short-term holders have recalibrated expectations without abandoning their positions;
∴ Exchange inflows remain historically depressed, with no aged coins activating - a hallmark of silent markets preparing for resolution;
∴ The chain speaks softly: no exit, no aggression, no irrationality - only latency, and the potential energy of stillness.
✴️ Conclusion: The Oracle confirms - the on-chain architecture reflects suspended initiative; nothing is broken, nothing is charged - only paused.
⊢
𓂀 Stoic-Structural Interpretation:
▦ Structurally: Bullish;
∴ Price remains well above the EMA200 and EMA50, with no breach of long-term support;
∴ All EMA's (9, 21, 50) are compressing, but retain upward trajectory - confirming structural integrity;
∴ Ichimoku Kumo holds price within a neutral band, but does not reflect a breakdown.
⊢
▦ Momentum-wise: Suspended Compression.
∴ MACD shows bullish crossover from beneath, but lacks amplitude to confirm trend reversal;
∴ RSI is parked around 50 with a bearish signal crossover - signaling stagnation, not strength;
∴ Stochastic RSI is climbing out of oversold, but with no impulsive follow-through.
⊢
✴️ Final Codex Interpretation:
∴ The H4 structure is consolidating beneath short-term resistance and within equilibrium clouds;
∴ Momentum is rebuilding, but flow remains stagnant;
∴ Buyers have not exited, but neither have they re-initiated force;
∴ The chart breathes - but does not speak.
⊢
⧉
· Cryptorvm Dominvs · MAGISTER ARCANVM · Vox Primordialis ·
⚜️ ⌬ - Silence precedes the next force. Structure is sacred - ⌬ ⚜️
⧉
⊢
Bitcoin Strategic Breakout at the Threshold of Silence!⊣
⟁ BTC/USD - BINANCE - (CHART: 1D) - (Jul 09, 2025).
◇ Analysis Price: $110,767.80.
⊣
⨀ I. Temporal Axis - Strategic Interval - (1D):
▦ EMA9 - ($108,767.55):
∴ Price remains above the 9-day EMA, maintaining a short-term bullish posture;
∴ The moving average acts as dynamic support with positive slope.
✴️ Conclusion: Immediate trend remains intact, with momentum supported at $108,767.55.
⊢
▦ EMA21 - ($107,663.85):
∴ EMA21 acts as the structural support of the medium-term trend;
∴ Price maintains a healthy gap above it, confirming bullish continuity.
✴️ Conclusion: Structural integrity remains bullish - no threat of reversal below $107,663.85.
⊢
▦ Ichimoku Cloud - (Senkou A: $106,870.32 / Senkou B: $105,173.14):
∴ Price is clearly above the Kumo, with bullish Tenkan/Kijun alignment;
∴ Lagging Span (Chikou) is above both price and cloud - clean trend confirmation.
✴️ Conclusion: Primary trend remains bullish; cloud structure provides layered support between $106,800 and $105,100.
⊢
▦ RSI - ($61.33):
∴ RSI is rising, currently at 61.33, still below the overbought threshold;
∴ No divergence or bearish signal present; EMA9 of RSI is supportive at 56.94.
✴️ Conclusion: Momentum is healthy and climbing - room to extend toward the 70 level.
⊢
▦ MACD - (MACD Line: 251.71 / Signal Line: 836.26):
∴ Recent bullish crossover confirmed; histogram turning increasingly positive;
∴ MACD shows early-stage trend resumption with growing momentum.
✴️ Conclusion: Renewed bullish phase underway - MACD structure confirms sustained strength.
⊢
▦ Volume + EMA21 - (Current: 352.24 / MA: 244):
∴ Current daily volume significantly exceeds 21-day average;
∴ The breakout candle is technically validated by volume strength.
✴️ Conclusion: Real buying presence behind the move - not a hollow breakout.
⊢
🜎 Strategic Insight - Technical Oracle:
∴ All technical indicators are in alignment;
∴ Price is supported by volume, short-term EMA's, bullish Ichimoku structure, and clean RSI/MACD momentum;
∴ The price is approaching the (ATH - $111,317.37) and any confirmed close above it, backed by volume, could trigger a Fibonacci-based extension toward - ($115,000 / $117,300).
⊢
∫ II. On-Chain Intelligence - (Source: CryptoQuant):
▦ Exchange Inflow Total - (All Exchanges) - (13.4K Bitcoin):
∴ No abnormal spikes - inflows remain historically low.
✴️ Conclusion: Selling pressure is absent - no signs of miner or whale unloading.
⊢
▦ Exchange Reserve - (Binance) - (537.4K Bitcoin):
∴ Continuous outflow trend - reserves have declined sharply in recent weeks.
✴️ Conclusion: Structural supply contraction - classic hallmark of accumulation.
⊢
▦ Funding Rates - (All Exchanges)- (+0.006%):
∴ Slightly positive, well within neutral zone - no euphoria.
✴️ Conclusion: Leverage is present but controlled - not overheating.
⊢
▦ Open Interest - (All Exchanges) - (gradually increasing):
∴ OI rising gradually without abrupt spikes.
✴️ Conclusion: Positions are being built systematically - not impulsively.
⊢
🜎 Strategic Insight - On-Chain Oracle:
∴ The breakout is not driven by leverage, but rather by spot accumulation and institutional withdrawal;
∴ This environment mirrors previous (pre-expansion) phases (notably late 2020), when reserves declined and funding stayed flat;
∴ All vectors are aligned - a structurally sound rally is underway.
⊢
⧈ Codicillus Silentii - Strategic Note:
∴ The market exhibits complete silence beneath price - no inflows, no speculative buildup;
∴ Only those attuned to the deeper rhythm perceive the pressure building within this compressed structure;
∴ The Codex observes no disruptive anomalies; the energy is latent, not explosive - yet.
⊢
▦ Tactical Range Caution:
∴ Immediate Support: $108,767.55 - (EMA9);
∴ Structural Support: $107,663.85 - (EMA21);
∴ Previous ATH: $111,317.37;
∴ Breakout Extension Target: $115,000 - $117,300.
⊢
𓂀 Stoic-Structural Interpretation:
▦ Structurally Bullish - Tactically Confirming.
⊢
⧉
Cryptorvm Dominvs · ⚜️ MAGISTER ARCANVM ⚜️ · Vox Primordialis
⌬ - Wisdom begins in silence. Precision unfolds in strategy - ⌬
⧉
⊢

Bitcoin Between Conviction and Caution - The Market Suspended?⊢
⟁ BTC/USD – BINANCE – (CHART: 1W) – (Date: June 23, 2025).
⟐ Analysis Price: $101,226.28.
⊢
⨀ I. Temporal Axis – Strategic Interval – (1W):
▦ EMA21 – ($96,740.64):
∴ Price remains above the 21EMA, confirming bullish structural integrity in medium trend;
∴ The slope of EMA21 remains positive, reinforcing sustained market momentum;
∴ Most recent candle printed a higher low above the 21EMA, reaffirming it as dynamic support.
✴️ Conclusion: The 21EMA upholds the current cycle's bullish engine - it is the first invalidation level for any mid-term reversal.
⊢
▦ SMA50 – ($85,002.38):
∴ SMA50 sits considerably below current price, reflecting distance from mean reversion zones;
∴ Market remains extended, but no immediate signs of pullback toward this structural level;
∴ The last interaction with SMA50 was in late 2023, when it confirmed trend resumption.
✴️ Conclusion: SMA50 defines the core mid-range support - no threat to it unless a breakdown accelerates below EMA21.
⊢
▦ SMA200 – ($49,241.87):
∴ SMA200 remains deeply below market, showing that the macro bullish structure remains unchallenged;
∴ Distance from SMA200 reflects the strength and maturity of this cycle’s trend;
∴ Long-term investors remain in profit and structurally supported.
✴️ Conclusion: No macro breakdown as long as price stays well above SMA200 - the secular bull phase is intact.
⊢
▦ Ichimoku Cloud – (Kumo, Tenkan, Kijun, Chikou Span):
∴ Price is trading clearly above the Kumo (cloud), showing sustained bullish dominance;
∴ Tenkan-sen and Kijun-sen lines are positively stacked, with Tenkan still leading;
∴ Chikou Span is above price and cloud, confirming long-term bullish alignment.
✴️ Conclusion: All Ichimoku components confirm bullish control - weakening only upon Tenkan/Kijun flattening or bearish cross.
⊢
▦ MACD – (MACD: 318.17 | Signal: 4,884.24):
∴ MACD line is far below the signal line, though attempting a bottoming curve;
∴ The histogram remains red but with decreasing amplitude - bearish momentum is fading;
∴ No bullish crossover yet - momentum remains negative but weakening.
✴️ Conclusion: MACD suggests waning bearish cycle, but no official reversal signal until crossover and histogram neutralization.
⊢
▦ RSI + EMA21 – (RSI: 57.71 | RSI EMA: 59.39):
∴ RSI remains in bullish territory above 50, although flattening below its EMA;
∴ No bearish divergence observed yet - RSI is consolidating;
∴ If RSI reclaims its EMA, strength may resume; if rejected again, loss of momentum may escalate.
✴️ Conclusion: RSI reflects structural strength, but cautious momentum - monitoring RSI/EMA relationship is critical.
⊢
▦ Volume + SMA21 – (Vol: 2.51K):
∴ Weekly volume remains below the 21-week average, indicating weakening participation;
∴ Last few candles show declining volume despite price stability - possible distribution;
∴ Absence of buyer aggression may limit further upside near-term.
✴️ Conclusion: Volume suggests lack of conviction - momentum exists, but crowd participation is thinning.
⊢
🜎 Strategic Insight – Technical Oracle:
∴ Bitcoin's weekly chart maintains bullish structural posture above all key moving averages, yet momentum indicators reflect hesitation;
∴ The Ichimoku system confirms trend dominance, but MACD and RSI signal that internal strength is not expanding - only sustaining;
∴ Volume contraction reveals market indecision or fatigue, potentially foreshadowing consolidation or rebalancing phases;
∴ Despite no structural breakdown, directional conviction is lacking - further upside demands renewed volume and momentum alignment.
⊢
☍ II - GAP CME – BTC1! – Chicago Mercantile Exchange:
▦ Previous CME Close – ($99,640.00) + Spot Opening Binance – ($100,980.77):
∴ A clear upside gap is present between the institutional close and the retail spot open, measuring approximately $1,340.77, thus defining a latent Magnet Zone for downward pullback;
∴ This CME gap forms a critical vacuum range between $99.640 and $100.980, which will likely act as a liquidity reabsorption zone if spot retraces;
∴ No immediate fill has occurred, suggesting current bullish momentum persists despite latent imbalance.
∴ The latest weekly CME candle closes with a smaller real body and a pronounced upper wick — a classical signal of buy-side exhaustion below macro resistance ($102K–$103K);
∴ Despite the weakening thrust, no breakdown has yet been printed — the bullish structure remains technically intact above previous weekly lows;
∴ Volume prints are non-expansive, indicating lack of conviction among institutional buyers at this level — vigilance is required.
✴️ Conclusion: The CME structure reveals a latent institutional gap magnet to the downside, with price now suspended above an untested imbalance. The technical structure remains constructive but fragile. Further confirmation from the spot market will determine whether continuation or reversion will manifest in the coming cycle.
⊢
∫ III. On-Chain Intelligence – (Source: CryptoQuant):
▦ Exchange Inflow Total – (All Exchanges):
∴ A recent spike in total Bitcoin inflows aligns directly with the $101K zone, signaling increased movement of coins from wallets to exchanges;
∴ Historically, such inflow spikes near local tops indicate preparation for distribution or profit-taking by large holders;
∴ Current inflow levels exceed previous consolidation phases, amplifying the risk of sell pressure activation.
✴️ Conclusion: The market is facing elevated short-term risk from exchange-bound liquidity — inflows confirm readiness to sell into strength.
⊢
▦ Spot Taker CVD – (Cumulative Volume Delta, 90-Day) – (All Exchanges):
∴ The 90-day CVD curve shows clear flattening and early reversal near resistance, indicating a shift in taker behavior;
∴ Passive sell-side absorption appears to dominate, reducing the strength of buy-side aggression;
∴ Price action continues upward while CVD retreats, forming a classic hidden distribution divergence.
✴️ Conclusion: CVD reveals taker exhaustion - without resurgence in spot demand, current price levels are vulnerable to sell-offs.
⊢
▦ Exchange Inflow Mean – (7-Day Moving Average) – (All Exchanges):
∴ The 7DMA of inflow mean remains elevated, suggesting sustained presence of large-sized transactions heading toward exchanges;
∴ This behavior often precedes institutional or strategic sales, especially when combined with total inflow spikes;
∴ No decline in the inflow mean implies continuous preparation for short-term distribution.
✴️ Conclusion: Elevated inflow mean confirms that whales and large actors are preparing or executing strategic exits.
⊢
▦ Funding Rate – (All Exchanges):
∴ Rates across global derivatives platforms remain slightly positive but without speculative imbalance;
∴ The neutral-positive range suggests cautious optimism among traders - not overleveraged, but not afraid;
∴ No signs of euphoric long build-ups, which reduces liquidation risk but weakens breakout fuel.
✴️ Conclusion: A neutral funding environment supports consolidation, not explosive upside — no immediate directional conviction.
⊢
▦ Funding Rate – (Binance):
∴ Binance-specific funding remains tightly aligned with global averages, reflecting no localized distortion;
∴ Positive, stable readings indicate low speculative friction, but also lack of trend-defining aggression;
∴ Historical patterns show that breakout rallies typically require a surge in funding rate — not present yet.
✴️ Conclusion: Binance traders are balanced - not short-squeezed nor euphoric - bias remains neutral until imbalance arises.
⊢
▦ Realized Price – Short-Term Holders (MVRV-STH) – (~$47.5K):
∴ Price trades far above the STH realized price, indicating most recent buyers are deep in unrealized profit;
∴ This dynamic historically increases the chance of sell pressure at resistance zones, especially when inflows are high;
∴ No downward compression or convergence - suggesting strength remains, but realization is a persistent risk.
✴️ Conclusion: STH's are exposed to high profit levels - the market is primed for potential realization, but not structural weakness.
⊢
🜎 Strategic Insight – On-Chain Oracle:
∴ Exchange-based signals (Inflow Total, Mean) confirm active preparation for sell-side flow;
∴ Spot aggression is fading as per CVD divergence, weakening breakout thesis despite strong price structure;
∴ Neutral funding and passive miner/on-holder behavior reflect structural balance - not panic, not euphoria.
✴️ Conclusion: The market rests in a zone of speculative tension - directionally undecided, but operationally sensitive to imbalance triggers.
⊢
⌘ Codicillus Silentii – Strategic Note:
∴ The temporal structure signals resilience, but lacks expansion - technical relief exists without structural thrust;
∴ On-chain flows unveil transactional friction at current levels, with capital cycling toward liquidity zones (exchanges);
∴ Market energy is neither compressed for breakout nor collapsed into capitulation - a state of coiled hesitation;
∴ Asymmetry remains hidden within equilibrium - vigilance, not movement, defines the moment.
⊢
𓂀 Stoic-Structural Interpretation:
▦ Structurally Neutral:
∴ Price holds above key macro supports (EMA21, SMA50), confirming preservation of the bullish superstructure;
∴ Long-term holder behavior and miner flows remain passive - structural integrity is undisturbed;
∴ However, no active thrust or trend validation emerges - the system sustains but does not ascend.
⊢
▦ Tactically Cautious:
∴ Exchange inflows and CVD divergence signal short-term vulnerability near key resistances;
∴ Technical indicators (MACD, RSI, Volume) reflect a condition of deceleration - momentum is reactionary, not foundational;
∴ Until price reclaims volume-weighted levels with confirmation, the posture remains defensive and watchful.
⊢
⧉
⚜️ Magister Arcanvm (𝟙⟠) – Vox Primordialis!
𓂀 Wisdom begins in silence. Precision unfolds in strategy.
⧉
⊢

Bitcoin Under Resistance: Neutral Core, Bearish Pressure.⊢
⟁ BTC/USD – BINANCE – (CHART: 4H) – (Date: June 22, 2025).
⟐ Analysis Price: $103,041.65.
⊢
⨀ I. Temporal Axis – Strategic Interval – (H4):
▦ EMA21 – (Exponential Moving Average 21-Period) – ($103,957.85):
∴ The current price is below the 21EMA, signaling weakness in short-term momentum;
∴ The slope of the moving average is negative, reflecting ongoing downward pressure;
∴ Recent attempts to reclaim the level were rejected, reinforcing its role as dynamic resistance.
✴️ Conclusion: The 21EMA acts as an active intraday resistance, and its breakout is a primary condition for any directional shift.
⊢
▦ EMA50 – (Exponential Moving Average 50-Period) – ($104,101.19):
∴ The 50 EMA remains above the price and the 21EMA, confirming a bearish trend alignment over the mid-term;
∴ The widening gap between EMA's suggests a well-established downward trend;
∴ A reclaim of both EMAs is required to revalidate bullish structure.
✴️ Conclusion: The 50EMA stands as a structural mid-term resistance, whose breakout would mark a tactical trend reversal.
⊢
▦ VPVR – (Volume Profile Visible Range) - (75, Up/Down):
∴ The POC (Point of Control) is concentrated around the $104,000 – $105,000 zone, just above the current price;
∴ This region reflects the highest volume concentration and tends to act as passive resistance or a redistribution zone;
∴ There’s a visible volume gap between $100,000 and $102,000, creating vulnerability to rapid price moves.
✴️ Conclusion: Price remains below institutional interest concentration, limiting upside potential unless volume reclaims the POC zone.
⊢
▦ BB – (Bollinger Bands - 20-Period SMA, 2.0 StdDev):
∴ The previous candle tapped the lower band and triggered a technical buy reaction (mean reversion);
∴ The mid-band aligns precisely with the 50 EMA (~$104,100), reinforcing confluence resistance;
∴ The channel shows slight downward expansion, suggesting volatility may continue to favor bears.
✴️ Conclusion: The recent bounce is technical relief; there is no structural reversal unless the price reclaims the mid-band.
⊢
▦ RSI – (Relative Strength Index) – (41.76):
∴ RSI is recovering from oversold territory but remains below the neutral 50 mark;
∴ The absence of a clear bullish divergence with price weakens the reversal thesis;
∴ RSI resistance lines sit between 45 and 50 – key levels that must be breached to confirm relief.
✴️ Conclusion: RSI signals technical relief, but still operates within a bearish zone — no clear evidence of dominant buying force yet.
⊢
▦ MACD – (Moving Average Convergence Divergence) – (MACD: –135.56 | Signal: –539.84):
∴ MACD line is crossing the signal line from below, generating an early bullish reversal signal;
∴ The histogram is contracting on the negative side, showing seller exhaustion;
∴ Readings remain deep in negative territory, requiring further confirmation.
✴️ Conclusion: MACD hints at momentum reversal, though structural validation requires a return to the positive zone.
⊢
▦ VOL – (Volume Bars):
∴ Volume increased significantly during the recent bounce, indicating reactive buyer demand;
∴ However, follow-through volume was not sustained — warning of potential bull trap;
∴ The absence of consistent volume undermines the durability of the bounce.
✴️ Conclusion: Volume shows reactive presence, but lacks sustained confirmation — recovery may be short-lived.
⊢
🜎 Strategic Insight – Technical Oracle:
∴ Bitcoin on the 4H chart is staging a relief move after recent sell-side pressure, yet remains below all key EMAs, under volume-based resistance, and without confirmation from momentum indicators.
∴ The structure is best defined as technical relief, not a confirmed trend reversal.
⊢
∫ II. On-Chain Intelligence – (Source: CryptoQuant & BGeometrics):
▦ Exchange Inflow Total - (All Exchanges) = (Latest Spike Zone ~103K):
∴ A recent uptick in Bitcoin inflows to exchanges is visible at local price levels, aligning with prior rejection zones;
∴ Increased inflows suggest potential intent to distribute, especially at resistance;
∴ Historically, such inflow patterns precede local price weakness or continuation of retracement.
✴️ Conclusion: Exchange inflow data warns of potential short-term sell pressure, supporting a cautious outlook near current levels.
⊢
▦ Funding Rate – (Binance Perpetual) – (Near Neutral to Slightly Positive):
∴ Current funding rates remain slightly positive but balanced, reflecting lack of directional conviction from leveraged traders;
∴ The absence of aggressive long bias reduces the risk of long squeezes but also suggests weak bullish momentum;
∴ Historically, neutral funding rates precede volatile expansions when followed by imbalances.
✴️ Conclusion: Funding rate indicates a neutral sentiment posture - not bearish, but lacking speculative bullish fuel.
⊢
▦ Open Interest – (All Exchanges) – (~$33.2B):
∴ Open Interest is elevated, marking one of the highest levels since April;
∴ The price is falling while OI remains high - a classic divergence signaling potential liquidation risk;
∴ This setup increases volatility probability and indicates the market is loaded with directional exposure.
✴️ Conclusion: Open Interest suggests a high-risk environment; either a cascade of liquidation or a sharp reversal is imminent.
⊢
▦ Realized Price – (Market: $103K | Realized: ~$47.5K):
∴ The gap between market price and realized price is vast, reflecting that most market participants are sitting on large unrealized gains;
∴ This positioning exposes the market to profit-taking impulses;
∴ The lack of compression between these metrics implies no capitulation is underway.
✴️ Conclusion: Market remains well above realized cost basis, implying latent sell-side risk and no evidence of fear-driven exits.
⊢
▦ UTXO Age Bands – (Realized Price by Age = 6m–3y clusters above $90K):
∴ Long-term holders (6m–3y) maintain positions well in profit, with realized values near or above $90K;
∴ No major movement from these cohorts detected — suggesting continued conviction or strategic dormancy;
∴ Younger UTXO bands are positioned lower, indicating recent accumulation remains underwater.
✴️ Conclusion: No signs of distribution from experienced holders — current structure favors hodler passivity, not capitulation.
⊢
▦ Miner Outflows – (Miner Transfer Volume Stable):
∴ Miner outflows remain stable, with no sharp spikes in transfers to exchanges;
∴ Implies no immediate operational selling pressure from mining entities;
∴ Miner behavior remains conservative, awaiting directional confirmation.
✴️ Conclusion: Miners are currently not a source of sell pressure, reinforcing structural equilibrium in supply flow.
⊢
🜎 Strategic Insight – On-Chain Oracle:
∴ The on-chain structure supports a technically vulnerable, yet fundamentally intact market; ∴ ∴ Exchange inflows and high Open Interest signal short-term caution, while the lack of miner selling, stable long-term holder behavior, and distance from realized price all point to no deep structural breakdown;
∴ Expect heightened volatility with directional resolution dependent on external catalysts or spot-driven pressure.
⊢
⌘ Codicillus Silentii – Strategic Note:
∴ Temporal framework reveals local reactive strength, but lacks structural realignment;
∴ On-chain flow warns of directional tension - neither resolve nor breakdown confirmed;
∴ Macro environment holds liquidity in suspension, awaiting a trigger;
∴ All vectors align under strategic ambiguity - stillness is not stasis, but anticipation.
⊢
𓂀 Stoic-Structural Interpretation:
▦ Structurally Neutral:
∴ The broader structure is intact - no systemic breakdown, yet no resumption of trend authority;
∴ Exchange inflows and high OI generate latent fragility, despite holder and miner resilience;
∴ The system holds - but without forward thrust, the architecture is stable, not ascendant.
⊢
▦ Tactically Cautious:
∴ Technical signals show reaction, not reversal - EMA's remain unbroken, volume is passive, RSI is capped;
∴ On-chain risk (inflows, OI) outpaces confirmation of strength;
∴ Action without structure is speculation - the trader must remain coiled, not extended.
⊢
⧉
⚜️ Magister Arcanvm (𝟙⟠) – Vox Primordialis!
𓂀 Wisdom begins in silence. Precision unfolds in strategy.
⧉
⊢
