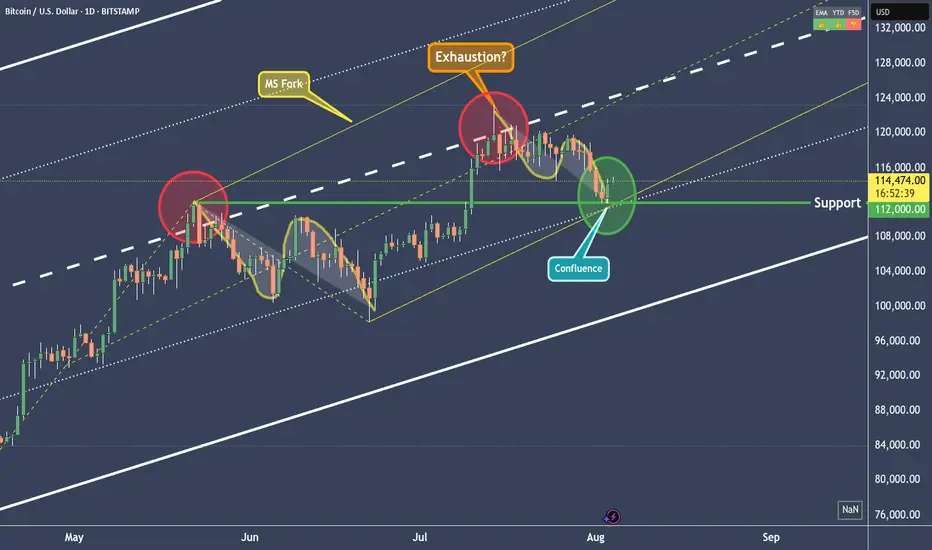
BTCUSD - Right to the point!In the last post (see the Linked Chart), I showed why BTCUSD would fall, and I also pointed out where the first price level for a possible pause might be.
On Friday, that level was reached, and the market seems to be turning *on the dot*. Will we now see higher prices again, or even a new all-time high? Let’s take a closer look:
The “confluence” point is marked by the white fork and the yellow modified Schiff fork. This point lies exactly on the 1/4 line. And this line often indicates temporary levels where at least a pause in the movement can be expected.
When we look at what Bitcoin did at this price level in mid-June, it seems likely that it will rise again. The overall pattern, from the centerline to the 1/4 line, looks extremely similar (see the A-B-C Wave Pattern)!
And yet, I’m not entirely convinced by the picture. Because this was the second time we reached the centerline.
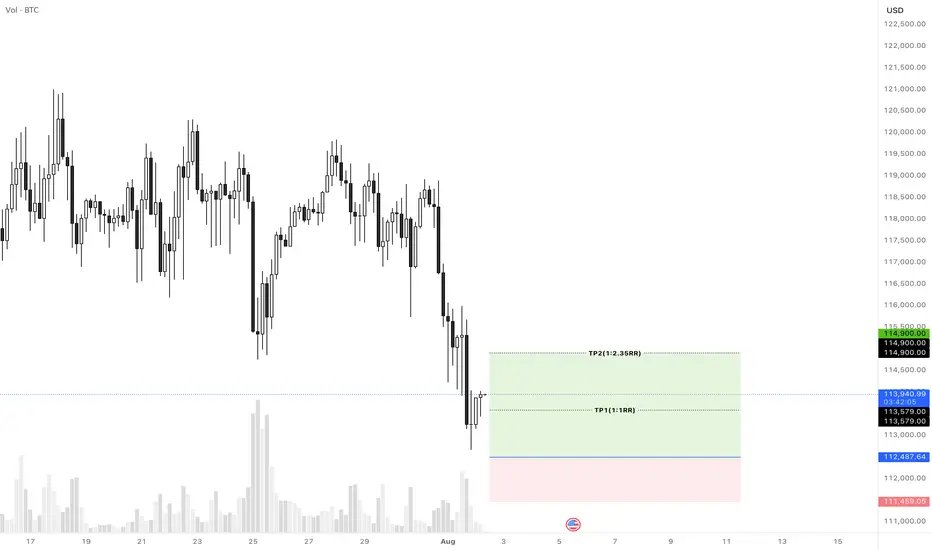
For the brave, this wouldn’t be a bad entry point—or an opportunity to increase the position after this pullback. A possible stop for traders could be placed just below the current low, with targets at the centerline of course.
But why not just lean back, enjoy the profits, and switch into observation mode for now…
I will also make a video that explains the details and connections more clearly.
Happy Monday and stay patient to fight the FOMO! §8-)
Btcusdlong
Updated chart: 1050 days of bull, 380 days of bearEach cycle fits quite neatly into ca. 1050 days of bull market and 375 days of bear. Sell in Sep/Oct 2025. Buy in Nov 2026.
An argument can be made that 2021 was a botched bull run. By the time we got to the second peak, Bitcoin was already running out of steam. One single peak would have topped around 100k. I blame SBF/Alameda.
People who are trying to extrapolate/do curve fitting through that 2021 peak will underestimate 2025.
2021 should be ignored as an exception.

Bitcoin buy setupHi everyone.
I think this area has a good potential to set an order and take at least 1% profit out of it..
Let's see how it reacts to this level...
Please consider the risk management.
Goodluck
Bitcoin - The cycle is just starting!⚔️Bitcoin ( CRYPTO:BTCUSD ) just created new highs:
🔎Analysis summary:
Bitcoin is currently - especially with the new all time high breakout - just perfectly following previous cycle behavior. Since there is no real resistance above current price, apart from psychological levels, I do expect a substantial rally back to the upper channel resistance trendline.
📝Levels to watch:
$300.000
🙏🏻#LONGTERMVISION
Philip - Swing Trader

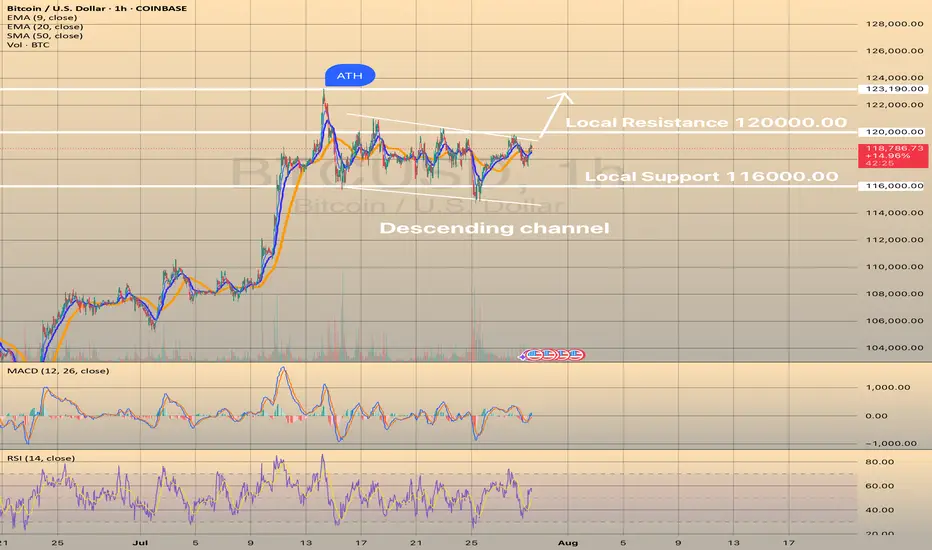
BTCUSD CONSOLIDATES BELOW RESISTANCE OF 120,000.00BTCUSD CONSOLIDATES BELOW RESISTANCE OF 120,000.00
Today the price rebounded from the SMA50 on 4-h chart and continues to consolidate below the resistance level of 120,000.00. Yesterday there was a minor pullback from this level, still the price is pretty much at the same levels as yesterday. The recommendation is still the same: would be safer for long trade to wait for a breakout of the resistance (120,000.00) with first target of 123,190.30 (ATH). However, the asset shows nice bullish set up: RSI started to show some strength with price consolidation below resistance.
BITCOIN UPDATE Bitcoin seems to be preparing to fix its lows so it’s time to target a trade to the up side because, it had dropped to a fair amount of lows
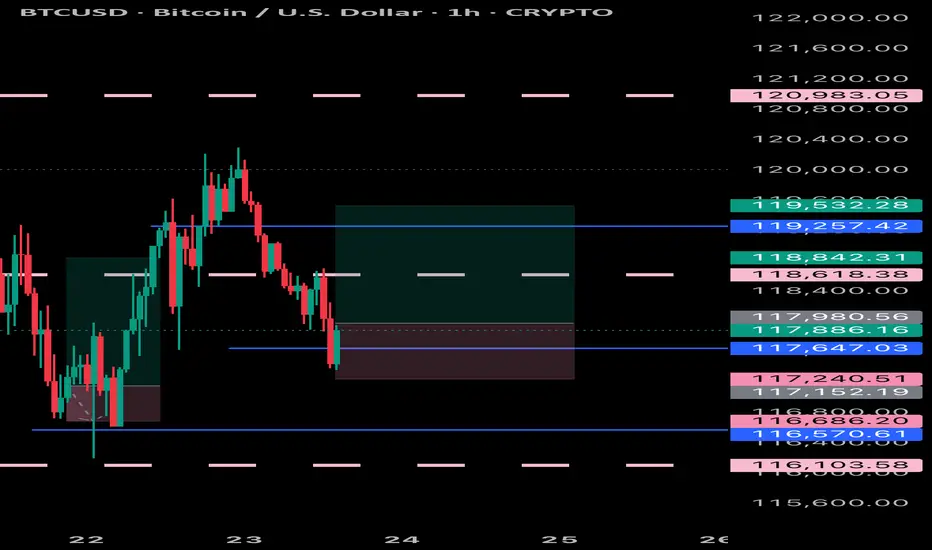
Accumulate BTC over 115K💎 BTC PLAN UPDATE (July 23rd)
NOTABLE NEWS ABOUT BTC
Bitcoin (BTC) and Ripple (XRP) are approaching their all-time highs, while Ethereum (ETH) continues to grow steadily toward the important $4,000 mark. These top three cryptocurrencies by market capitalization are showing signs of a new bullish momentum, supported by strong technical structures and increasing investor interest.
TECHNICAL ANALYSIS PERSPECTIVE
1. Main Trend
The overall trend remains bullish, with a clearly rising price channel (black diagonal line).
However, BTC is currently in a short-term correction phase, consolidating sideways after the recent strong surge.
2. Key Price Levels
🔵 Strong Support Zone: 116,000 – 117,000 USDT
This zone includes the 200-day moving average (MA200), horizontal support, and a previous bottom — making it a decisive area for the short-term trend.
If this zone breaks, BTC could fall to a deeper support area around 111,000 USDT.
🔴 Resistance Zone: 122,000 – 123,000 USDT
This is a previous peak and a recently “false breakout” area — a strong psychological resistance.
If broken convincingly, BTC could surge to the 130,000 USDT zone (Fibonacci extension 1.618).
3. Possible Scenarios
✅ Bullish Scenario:
Price retests the 116,000 – 117,000 support zone and then bounces.
If it breaks through the 122K resistance, the next target is 130,000 USDT.
❌ Bearish Scenario:
If price breaks below MA200 and the 116K support zone → it could drop to the deeper zone around 111,000 USDT.
4. Technical Signals
There is a triangle accumulation pattern (with flat tops and bottoms).
The “false breakout” at the resistance zone shows that buyers are not yet strong enough and a retest of support is needed.
Follow the channel for the latest and continuous updates on XAUUSD, CURRENCIES, and BTC.

BTC Bull & Bear historical Periods 3 Bull & Bear Markets
Bull markets took around 152 weeks...
then
V
v
v
v
v
Bear Markets took around 52-59 weeks..
then
v
v
v
v
v
v
v
Bull Market gain...
----------------------------------------------------------------------------------------------------------
After 2021 ATH
BTC recorded his current bottom after 52 weeks ( 15500 $).
BTC pumped after 59 weeks .
then what ?
Will the history will repeat itself again ??
if we will be alive inshallah ,we will see the next 152 weeks to ( October - November 2025 ) if this will be the New ATH of the next bull market or not :D
It is not a financial advice , PLZ DYOR

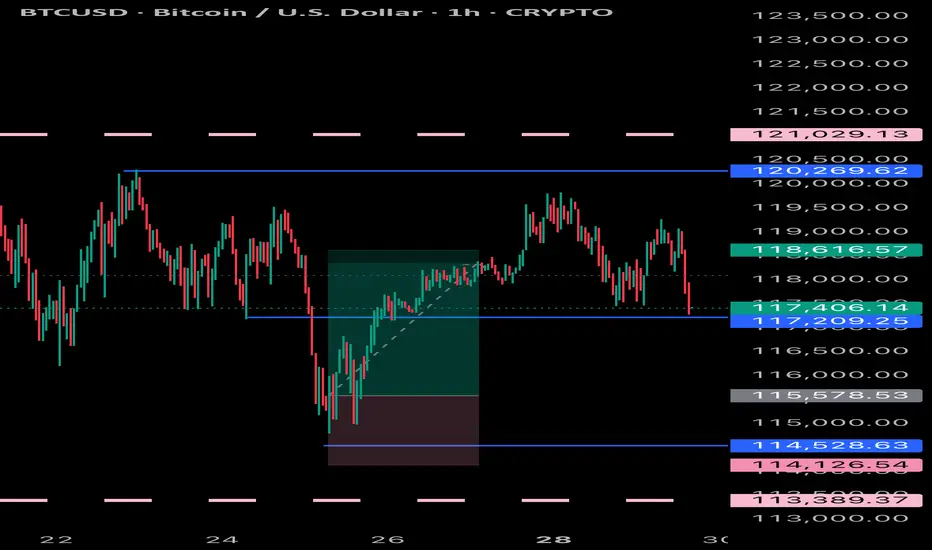
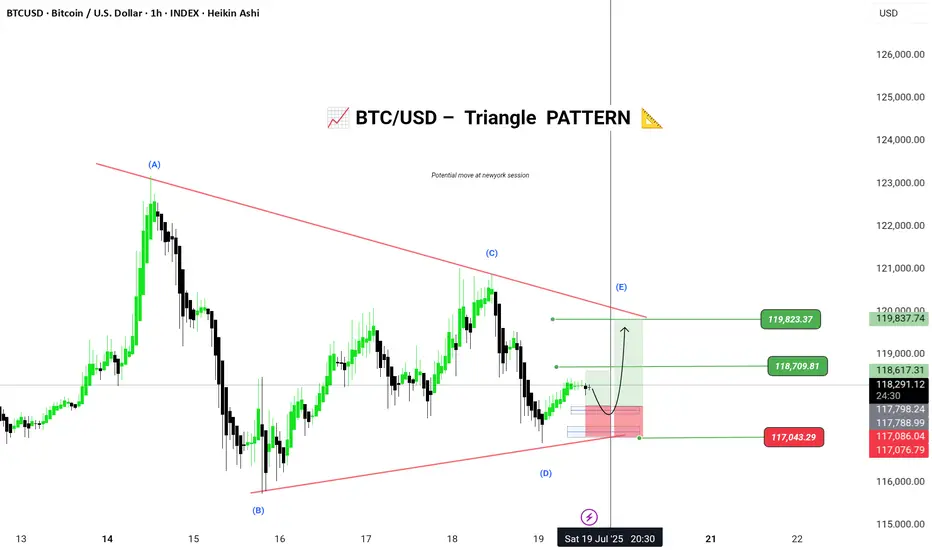
BTC/USD – Triangle Wave E Setup (Potential Bullish Breakout)Bitcoin is currently forming a contracting triangle (ABCDE) structure on the 1H chart. The market appears to be respecting the lower trendline support and could be completing Wave D, now preparing to push into Wave E.
🟢 Entry Zone: 117086 – 117076
🎯 Targets:
• 118709
• 119823
⛔ Stop Loss / Invalidation: Below 117043
🧩 Pattern: Elliott Wave Contracting Triangle
📅 Timeframe: 1H (Heikin Ashi)
📌 Chart by: @Greenfireforex
📌 Wait for a bullish confirmation candle above the support zone for a safe long setup. Triangle break could lead to momentum continuation toward the targets.
---
BTC Next Move within 11-15 DaysBTC will hit $62,528.74 Within 11-15 Days
The historical trend suggests that once Bitcoin (BTC) surpasses the $50,000 threshold, it typically enters a bullish phase, experiencing significant gains. This observation is based on past market behavior, where crossing this key price point has often led to increased investor confidence and subsequent price surges.

BTC sideways above 115k💎 BTC PLAN UPDATE (July 17)
NOTABLE NEWS ABOUT BTC
Bitcoin Price Forecast: BTC Recovers as Trump Steps In to Revive Crypto Legislation Momentum
Bitcoin (BTC) saw a mild recovery, trading around $119,000 at the time of writing on Wednesday, after falling nearly 2% the previous day. This rebound followed an announcement by U.S. President Donald Trump on Wednesday morning, stating that the GENIUS Act is ready to be passed by the House during the legislative “Crypto Week”, sparking optimism in the crypto market. Furthermore, institutional demand continues to grow, with spot Bitcoin ETFs recording over $400 million in inflows on Tuesday, extending the growth streak since July 2.
TECHNICAL ANALYSIS
🧠 Pattern Overview:
The chart clearly displays an Elliott Wave pattern (1) → (2) → (3) → (4) → (5) along with Fibonacci Retracement and Extension levels, helping to identify potential support and resistance zones.
1. Elliott Waves:
Wave (3) was completed around the $122,144 zone and the market is currently in the corrective wave (4).
Wave (5) is expected to move upward with targets at:
• 1.618 Fibonacci Extension: ~$127,404
• Or further: ~$130,747
2. Support Zone (grey area below):
Located around $115,000 – $116,000, which is:
• The 0.5 – 0.618 retracement of Wave (3)
• Aligned with the EMA200 and dotted black trendline support.
If the price falls into this area, it’s highly likely to bounce back and form Wave (5).
3. Danger Zone if Broken:
If this support fails, price may fall deeper to:
• $113,200 (0.786 retracement),
• Or even lower: $111,600 – $111,800
4. Potential Scenarios:
Two main outcomes:
• Continued Uptrend: Price bounces from the support zone and heads toward $127,000 – $130,000
• Breakdown: If the support breaks, a deeper decline may occur, breaking the wave structure.
Follow the channel for continuous and up-to-date analysis on XAUUSD, CURRENCIES, and BTC.

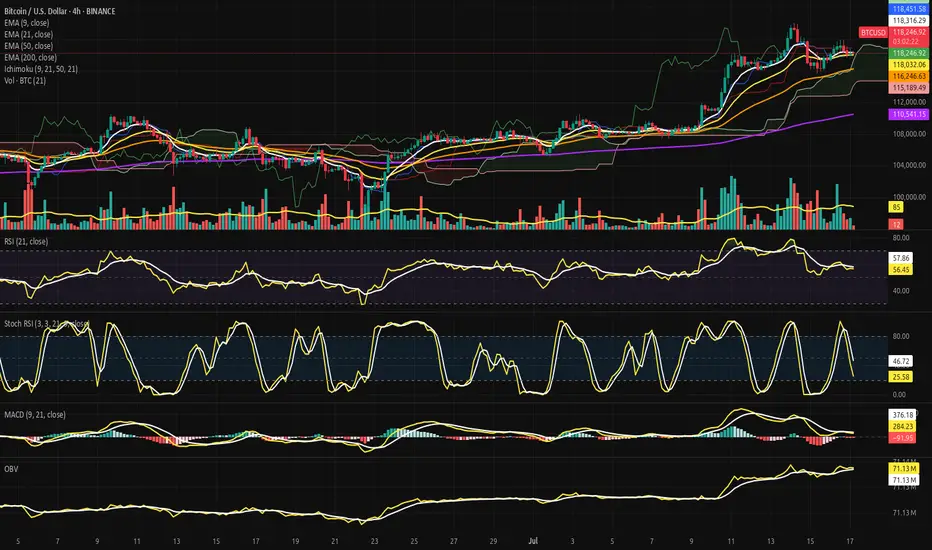
Bitcoin Strategic Compression Beneath the Cloud Gate.⊣
⟁ BTC/USD - BINANCE - (CHART: 4H) - (July 17, 2025).
◇ Analysis Price: $118,099.62.
⊣
⨀ I. Temporal Axis - Strategic Interval – (4H):
▦ EMA9 - (Exponential Moving Average - 9 Close):
∴ EMA9 is currently positioned at $118,286.83, marginally above the current price of $118,099.62;
∴ The slope of the EMA9 has begun to turn sideways-to-downward, indicating loss of short-term acceleration;
∴ The price has crossed below EMA9 within the last two candles, suggesting an incipient rejection of immediate bullish continuation.
✴️ Conclusion: Short-term momentum has weakened, positioning EMA 9 as immediate dynamic resistance.
⊢
▦ EMA21 - (Exponential Moving Average - 21 Close):
∴ EMA21 is measured at $118,018.67, positioned slightly below both price and EMA9, indicating a recent tightening of trend structure;
∴ The slope of EMA21 remains positive, preserving the medium-range bullish structure intact;
∴ EMA21 has been tested multiple times and held as support since July 15 - confirming tactical reliability as dynamic floor.
✴️ Conclusion: EMA21 stands as a critical pivot zone; any sustained breach would denote structural stress.
⊢
▦ EMA50 - (Exponential Moving Average - 50 Close):
∴ EMA50 is currently located at $116,240.85, well below current price action;
∴ The curve maintains a healthy positive inclination, affirming preservation of broader intermediate trend;
∴ No contact or proximity to EMA50 over the last 20 candles - indicating strong bullish detachment and buffer zone integrity.
✴️ Conclusion: EMA50 confirms medium-term bullish alignment; not yet challenged.
⊢
▦ EMA200 - (Exponential Moving Average - 200 Close):
∴ EMA200 stands at $110,539.69, forming the base of the entire 4H structure;
∴ The gradient is gradually rising, reflecting accumulation over a long time horizon;
∴ The distance between price and EMA200 reflects extended bullish positioning, yet also opens risk for sharp reversion if acceleration collapses.
✴️ Conclusion: Long-term structure remains bullish; early signs of overextension exist.
⊢
▦ Ichimoku Cloud - (9, 21, 50, 21):
∴ Price is currently above the Kumo (cloud), placing the pair within a bullish regime;
∴ Tenkan-sen (conversion) and Kijun-sen (base) lines show narrowing separation, suggesting momentum compression;
∴ Senkou Span A > Span B, and the cloud ahead is bullishly twisted, though thinning - indicating potential vulnerability despite structural advantage.
✴️ Conclusion: Bullish regime intact, but loss of momentum and cloud compression warrant caution.
⊢
▦ Volume + EMA21:
∴ Current volume for the latest candle is 3 BTC, compared to the EMA21 of 84 BTC;
∴ This indicates an extremely low participation phase, often associated with distribution zones or indecisive consolidation;
∴ Previous impulsive candles (July 15) reached well above 100 BTC - the current contraction is stark and strategically significant.
✴️ Conclusion: Absence of volume threatens trend continuation; energy depletion apparent.
⊢
▦ RSI - (21) + EMA9:
∴ RSI (21) is positioned at 55.73, marginally above neutral zone;
∴ EMA 9 of RSI is 57.71, crossing downward against RSI - bearish micro signal;
∴ No divergence is present versus price action - oscillator confirms current stagnation rather than exhaustion.
✴️ Conclusion: RSI losing strength above neutral; lacks momentum for breakout, but no capitulation.
⊢
▦ Stoch RSI - (3,3,21,9):
∴ %K is 21.44, %D is 45.34 - both pointing downward, in deacceleration phase;
∴ Recent rejection from overbought zone without full reset into oversold - signaling weak bullish thrust;
∴ Historical cycles show rhythmical reversals near current levels, but only with supportive volume, which is absent now.
✴️ Conclusion: Short-term momentum failed to sustain overbought breakout - micro-correction expected.
⊢
▦ MACD - (9, 21):
∴ MACD line is at -104.80, Signal line at 268.16 - large separation, histogram deeply negative;
∴ The bearish crossover occurred with declining volume, implying fading momentum rather than aggressive sell-off;
∴ No bullish divergence formed yet - continuation of correction remains technically favored.
✴️ Conclusion: MACD confirms trend exhaustion; no reversal in sight.
⊢
▦ OBV + EMA 9:
∴ OBV is 71.13M, perfectly aligned with its EMA9 - indicating equilibrium in volume flow;
∴ No directional bias in accumulation or distribution - flatlining suggests passive environment;
∴ Prior OBV uptrend has stalled since July 15 - reinforcing narrative of hesitation.
✴️ Conclusion: Institutional flow is neutral; no aggressive positioning detected.
⊢
🜎 Strategic Insight - Technical Oracle: The current price structure presents a classic post-impulse compression configuration within a preserved bullish environment. Despite the higher timeframe alignment, multiple short-term indicators exhibit tactical dissonance and signs of momentum decay. This inconsistency reflects a market caught between structural optimism and tactical hesitation.
♘ Key strategic signals - Structural Alignment:
∴ All major EMA's (9, 21, 50, 200) remain stacked in bullish order with no bearish crossovers imminent;
∴ Price remains above the Ichimoku Cloud and above EMA50 - both confirming structural dominance by buyers.
♘ Momentum Degradation:
∴ RSI (21) is drifting below its EMA9, weakening the momentum required for further upside continuation;
∴ Stochastic RSI has rolled over aggressively, failing to reach oversold before reversing - mid-cycle weakness is confirmed.
♘ Volume Collapse:
∴ The current volume profile is critically weak - 3 Bitcoin against an average of 84 Bitcoins (EMA21);
∴ Price attempting to sustain above EMA's with no conviction signals distribution or passivity.
♘ MACD & OBV:
∴ MACD histogram remains deep in negative territory, and no bullish crossover is visible;
∴ OBV is flat - neither accumulation nor distribution dominates, leaving directional thrust suspended.
✴️ Oracle Insight:
∴ The technical field is Structurally Bullish, but Tactically Compressed.
∴ No breakout should be expected unless volume decisively returns above baseline (84 Bitcoins EMA);
∴ Below $117,800, the structure risks transition into a corrective phase;
∴ Above $118,450, potential trigger zone for bullish extension if accompanied by volume surge.
♘ Strategic posture:
∴ Wait-and-observe regime activated;
∴ No entry condition satisfies both structure and momentum at present;
∴ Tactical neutrality is advised until confirmation.
⊢
∫ II. On-Chain Intelligence - (Source: CryptoQuant):
▦ Exchange Reserve - (All Exchanges):
∴ The total Bitcoin reserves held on all exchanges continue a sharp and uninterrupted decline, now at ~2.4M BTC, down from over 3.4M in mid-2022;
∴ This downtrend has accelerated particularly after January 2025, with a visible drop into new lows - no accumulation rebound observed;
∴ Historically, every prolonged depletion of exchange reserves correlates with structural bullish setups, as supply becomes increasingly illiquid.
✴️ Conclusion: On-chain supply is structurally diminishing, confirming long-term bullish regime intact - mirrors technical EMA alignment.
⊢
▦ Fund Flow Ratio - (All Exchanges):
∴ Current Fund Flow Ratio stands at 0.114, which is well below historical danger thresholds seen near 0.20-0.25 during local tops;
∴ The ratio has remained consistently low throughout the 2025 uptrend, indicating that on-chain activity is not directed toward exchange-based selling;
∴ Spikes in this indicator tend to precede local corrections - but no such spike is currently present, reinforcing the notion of non-threatening capital flow.
✴️ Conclusion: Capital is not rotating into exchanges for liquidation - volume weakness seen in 4H chart is not linked to sell intent.
⊢
▦ Miners' Position Index - (MPI):
∴ The MPI sits firmly below the red threshold of 2.0, and currently ranges in sub-neutral levels (~0.5 and below);
∴ This suggests that miners are not engaging in aggressive distribution, and are likely retaining Bitcoin off-exchange;
∴ Sustained low MPI readings during price advances confirm alignment with institutional and long-term accumulation behavior.
✴️ Conclusion: Miner behavior supports structural strength - no mining-induced supply pressure present at this stage.
⊢
🜎 Strategic Insight - On-Chain Oracle:
∴ Across the three strategic indicators, no on-chain evidence supports short-term weakness;
∴ Supply is declining - (Exchange Reserve ↓);
∴ Funds are not preparing for exit - (Flow Ratio stable);
∴ Miners are not selling - (MPI subdued).
✴️ This constellation reinforces the thesis of Structural Bullishness with Tactical Compression, and suggests that any pullback is not backed by foundational stress.
⊢
𓂀 Stoic-Structural Interpretation:
∴ The multi-timeframe EMA stack remains intact and aligned - (9 > 21 > 50 > 200);
∴ Price floats above Ichimoku Cloud, and above EMA21 support, confirming elevated positioning within a macro bull channel;
∴ On-chain metrics confirm supply contraction, miner retention, and absence of fund rotation toward exchanges - structure remains sovereign;
∴ RSI - (21) slips under its EMA9 with low amplitude, indicating absence of energetic flow;
∴ Stoch RSI fails to reset fully and points downward - suggesting premature momentum decay;
∴ MACD histogram remains negative, while volume is significantly beneath EMA baseline (3 BTC vs 84 BTC);
∴ Price faces resistance at Kijun-sen ($118.451), acting as tactical ceiling; no breakout signal detected.
⊢
✴️ Interpretatio Finalis:
∴ Structural integrity remains unshaken - the architecture is bullish;
∴ Tactically, however, the battlefield is fogged - silence reigns in volume, hesitation in oscillators;
∴ A true continuation requires volume resurrection and resolution above $118,450. Until then, neutrality governs the edge.
⊢
⧉
Cryptorvm Dominvs · ⚜️ MAGISTER ARCANVM ⚜️ · Vox Primordialis
⌬ - Wisdom begins in silence. Precision unfolds in strategy - ⌬
⧉
⊢
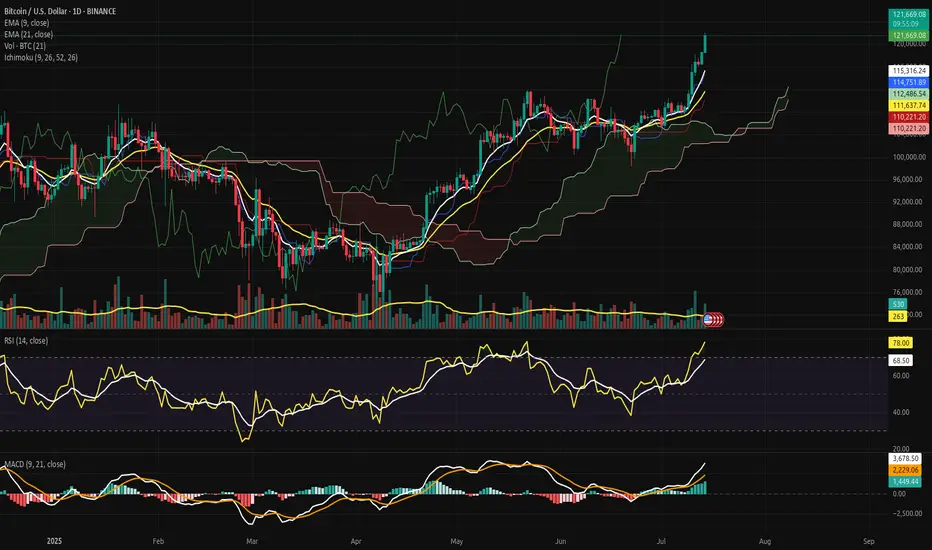
Bitcoin Ascends into the Clear Sky: Structural Break Confirmed.⊣
⟁ BTC/USD - BINANCE - (CHART: 1D) - (Jul 14, 2025).
◇ Analysis Price: $121,662.29.
⊣
⨀ I. Temporal Axis - Strategic Interval - (1D):
▦ EMA9 - ($115,313.08):
∴ The EMA9 is aggressively sloped upward, serving as dynamic support during the latest expansion phase.
✴️ Conclusion: Bullish control confirmed; momentum is guided tightly by the EMA9 anchor.
⊣
▦ EMA21 - ($111,636.30):
∴ EMA21 remains positively inclined, acting as a structural trend base beneath price and volume clusters.
✴️ Conclusion: Market remains structurally sound as long as price stays above the 21-day mean.
⊣
▦ Volume + EMA21 - (Volume: 497.79 BTC - EMA21: 262 BTC):
∴ Volume surge surpasses the rolling average, confirming institutional participation and breakout legitimacy.
✴️ Conclusion: Volume expansion validates price movement - no signs of divergence or exhaustion detected.
⊣
▦ RSI + EMA9 - (RSI: 77.99 - EMA9: 68.49):
∴ RSI has entered overbought territory, yet its trajectory remains upward and wide above its smoothing band.
✴️ Conclusion: Bullish momentum sustained; overbought conditions not yet reversing.
⊣
▦ MACD - (9, 21, 9) + EMA's smoothing:
∴ MACD: 3,271.60 | Signal: 2,013.81 | Divergence: +1,257.79;
∴ The MACD line is expanding positively over its signal, confirming momentum acceleration.
✴️ Conclusion: Technical conviction favors bullish continuation; signal remains clean and unsaturated.
⊣
▦ Ichimoku Cloud - (9, 26, 52, 26):
∴ Price is decisively above the Kumo cloud - “Clear Sky” territory;
∴ Senkou Span A = 121,653.30 | Senkou Span B = 112,486.54;
∴ Tenkan and Kijun lines are sharply elevated, confirming trend authority.
✴️ Conclusion: Zero resistance above; cloud projection supports further upward development.
⊣
🜎 Strategic Insight - Technical Oracle:
∴ All indicators are aligned in a rare harmonic convergence, signaling trend expansion with no current topping structure;
∴ Market shows the behavior of an advanced impulse wave entering Phase II expansion;
∴ Strategic play remains bullish - pullbacks, if any, should be shallow and fast.
⊣
𓂀 Stoic-Structural Interpretation:
∴ Structurally Bullish – Tactically Advancing
⊢
⧉
Cryptorvm Dominvs · ⚜️ MAGISTER ARCANVM ⚜️ · Vox Primordialis
⌬ - Wisdom begins in silence. Precision unfolds in strategy - ⌬
⧉
⊢
FOMO price increase, create new ATH💎 Update Plan BTC weekend (July 11)
Continuously creating a new ATH, preparing to have a short sale?
The reinforcement of Bitcoin price around the upper boundary of the previous consolidation area was broken at $ 108,355, which ended on Wednesday. The price has soared to the highest level of the new time of $ 116,868 on Thursday. At the time of writing on Friday, the price is fluctuating above $ 116,600.
When BTC entered the price exploration regime and if the trend of increasing continues, the price can expand the momentum to an important psychological level of $ 120,000.
Technical analysis angle
Our community has continuously chose the trend of increasing as the mainstream for all previous transactions and currently preparing to welcome 120k as forecast.
The relative power index (RSI) on the daily chart reaches 71, higher than the excess buying 70, showing a sharp increase. However, traders should be cautious because the ability to adjust the decrease is very high due to over -purchase. Meanwhile, the average divergence dynamic indicator (MACD) has shown a price intersection at the end of June. The indicator also shows that green histograms are increasing on neutral zero, showing that the rising momentum is being strengthened and continues to increase.
However, if BTC must be adjusted, the price may extend the decline to search and support around the upper boundary of the unified area that has been broken earlier at $ 108,355.
Plan has been constantly accurate in the past 2 months, which is the positive signal of the channel that brings value to the community.
Please follow the channel to receive accurate scenarios about gold and BTC
==> Comments for trend reference. Wishing investors successfully trading
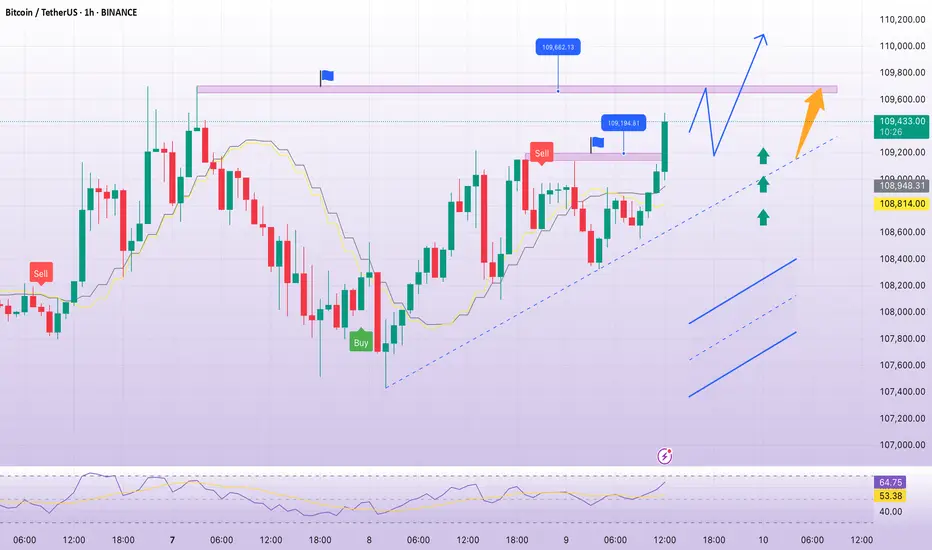
BTC back to 110K, ATH effortPlan BTC today: 09 July 2025
Related Information:!!!
Cryptocurrencies are trading in a volatile environment driven by tariff-related uncertainties ahead of the release of the Federal Reserve's (Fed) Minutes from the June meeting, scheduled for Wednesday. Bitcoin (BTC) continues to exhibit technical weakness, trading below the key resistance level near $109,000. Trading activity in the spot market remains subdued, with K33 Research reporting a 4% decline in weekly volume to $2.1 billion.
Aside from a few selective rallies, as evidenced by Wednesday’s top-performing tokens, most altcoins are underperforming relative to Bitcoin, reflecting limited engagement from the retail segment. Nonetheless, Ethereum (ETH) is showing early signs of a potential upward move after breaking above the former resistance-turned-support level at $2,600. Ripple (XRP), meanwhile, has extended its recovery above $2.33, posting over 1% in intraday gains.
personal opinion:!!!
Continued efforts by the bulls, breaking ATH above the 110,000 price zone. The time is near for the FED to lower interest rates.
Important price zone to consider :!!!
support zone : 109.200
resistance zone : 109.700
Sustainable trading to beat the market
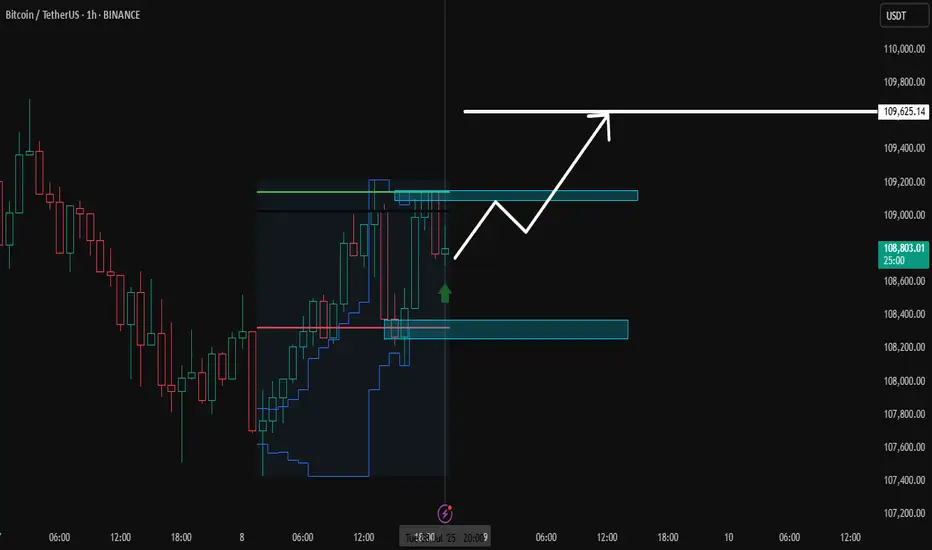
bitcoin in 1hour timeframeIn line with the previous analysis, the likely path for Bitcoin on the one-hour timeframe looks like this...follow for more...
BTC up following H1 trend linePlan BTC today: 07 July 2025
Related Information:!!!
Bitcoin (BTC) trades slightly below $109,000 at the time of writing on Monday, following its highest weekly close on record. Institutional and corporate demand continues to serve as a key catalyst, with Metaplanet acquiring an additional 2,205 BTC on Monday, while US-listed spot Bitcoin Exchange Traded Funds (ETFs) saw over $769 million in net inflows last week.
As market participants assess the latest bullish indicators, focus now shifts to broader macroeconomic developments, including new trade-related headlines and reports suggesting that the administration of US President Donald Trump may extend the current tariff pause until August 1.
personal opinion:!!!
BTC moves sideways in the trend line, trend line support 108,300
Important price zone to consider :!!!
support zone : 108.300
Sustainable trading to beat the market

waiting for new ATH this week , btc💎 BTC PLAN UPDATE FOR THE BEGINNING OF THE WEEK (07/07)
NOTABLE BITCOIN NEWS: Focus on 4 key points today
1. Elon Musk – “America Party” to Support Bitcoin
Elon Musk has confirmed that his newly formed political party, the “America Party,” will support Bitcoin, stating that “fiat is hopeless.”
2. Cup-and-Handle Pattern Analysis: Targeting $230K
According to technical analysis by Cointelegraph, BTC is forming a “cup and handle” pattern on the monthly chart, which could lead to a target peak of $230,000 if a breakout continues.
3. BTC Price Holds Steady Around $109K Amid “Crypto Week” and Trade Tensions
Bitcoin is currently trading around $109,000, influenced by “Crypto Week” and concerns over U.S. tariffs.
4. Institutional Inflows Increase, But Market Demand Weakens
According to CoinDesk, institutional investors are still buying BTC, but not enough to offset declining demand in the spot market, negatively affecting short-term market sentiment.
⸻
TECHNICAL ANALYSIS PERSPECTIVE
The short-term trend remains bullish. However, the steep slope of the trend indicates buying pressure is still being contested and unstable.
BTC remains stuck at Fibonacci levels—pay close attention to the resistance zones at 112K and 115K. If these two resistance levels are broken, investors may get the answer to whether BTC can approach the 120K level.
In the short term, both gold and BTC are moving sideways, indicating that market liquidity and investor capital are unstable and being divided across multiple portfolios.
==> This analysis is for reference only. Wishing all investors successful trading!

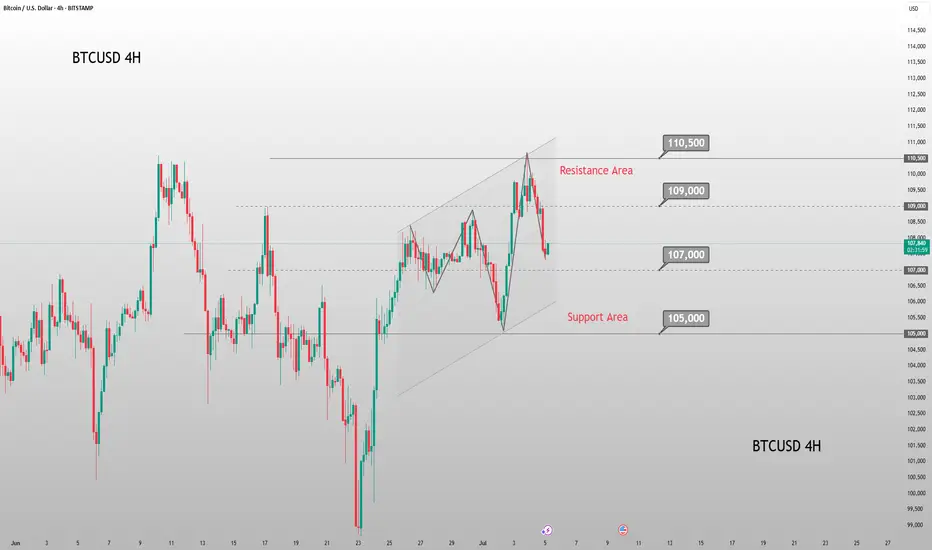
Weekend BTC Trend Analysis and Trading SuggestionsLet's review this afternoon's market performance. The BTC price, as we anticipated, rebounded to around 109,000 in the afternoon before plummeting sharply. Living up to "Black Friday", this violent drop was well within our expectations. In the afternoon's live trading, we also reminded everyone that as long as there was a rebound to the upper zone, it was a good opportunity to go short. This drop has created a space of nearly 1,500 points. Currently, the BTC price has pulled back to around 107,800.
From the current 4-hour K-line chart, after a strong upward surge, the market encountered significant resistance near the upper track of the Bollinger Bands. As bullish momentum gradually faded, the price started to come under pressure and decline, suggesting that the short-term upward trend may come to a temporary halt. At present, the market has recorded multiple consecutive candlesticks with large bearish bodies. The price has not only effectively broken below the key support level of the Bollinger Bands' middle track but also caused the Bollinger Bands channel to switch from expanding to narrowing, indicating that market volatility is decreasing. In terms of trading volume, it showed a moderate increase during the price pullback, which further confirms the authenticity of the bearish selling pressure.
BTCUSD
sell@108000-1085000
tp:107000-106000
Investment itself is not the source of risk; it is only when investment behavior escapes rational control that risks lie in wait. In the trading process, always bear in mind that restraining impulsiveness is the primary criterion for success. I share trading signals daily, and all signals have been accurate without error for a full month. Regardless of your past profits or losses, with my assistance, you have the hope to achieve a breakthrough in your investment.
break, BTC soon reaches new ATH💎 Update Plan BTC after NFP (July 3)
Notable news about BTC:
Bitcoin (BTC) recovered to $ 109,000 on Wednesday when the US agreement with Vietnam and the increase in global M2 supply of M2 money has promoted an increase in open interest rates (OI), soaring to 689.78 thousand BTC worth about $ 75 billion. The cryptocurrency market in general has increased the price along with BTC, with leading altcoins, Ethereum (ETH), XRP and Solana (SOL) increased by 7%, 3%and 4%respectively.
Bitcoin, the market cryptocurrency market increased by the trade agreement with Vietnam and M2 money supply soared
The cryptocurrency market has recovered on Wednesday, an increase of 2% to regain the market capitalization of $ 3.5 trillion.
Technical analysis angle
First, congratulate the investors who follow the plan when we previously traded according to the model and had a short signal at 108k and took profit and then Long in the 106k area.
Currently, BTC is in wave 5 and is trapped in the Fibonanci area of 2,618 golden ratio around the price of 109k, this is also the threshold of the price of investors who are under pressure before the price area goes to 112k
The 112k region is a psychological area of profit and will appear on the 109k sales situation before the BTC price may rise further in the last 6 months of the year.
Please follow the channel to receive accurate scenarios about gold and BTC /-Teart /-heart
==> Comments for trend reference. Wishing investors successfully trading

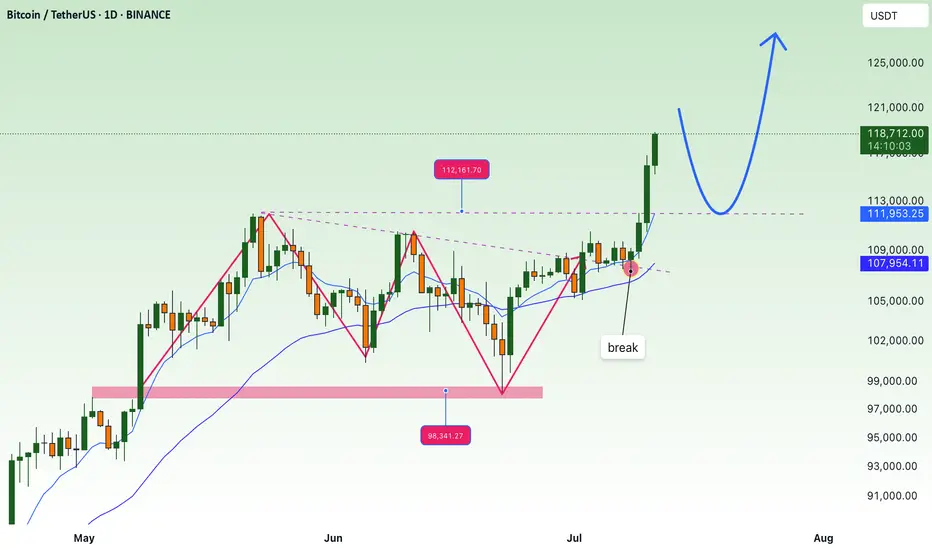
BTCUSD Trade Setup Idea on 1D Timeframe - Bullish MomentumBitcoin (BTCUSD) is currently trading at $109,348, showing strong bullish momentum on the 1H chart. The recent breakout from consolidation signals potential continuation, provided key resistance levels are breached and held.
Must Consider Analysis Timeframe : 1Day.
Strictly follow the trading rules for Entry..... only on Retracement.
SL on Previous or Close swing low.
🔍 Key Levels to Watch:
Bullish Continuation Confirmation: If price sustains above 112,150, we expect bullish momentum to accelerate.
Target 1 (TP1): 112,150 – Key breakout level that may act as support once reclaimed.
Target 2 (TP2 - Major): 121,128 – Long-term resistance and major profit-taking zone.
📊 Trade Logic:
A confirmed breakout and hold above 112,150 indicates strong buyer interest and could drive price toward 116,572 and 121,128.
The trend remains bullish as long as price holds above the breakout structure.
REMEMBER:- RESPECT THE LEVELS, LELEVLS RESPECT YOU THEN.
💡 Strategy: Monitor for retests and bullish candle confirmations above 112,150 to add or enter long positions with proper risk management.
! Disclaimer & Important Note:
This analysis is for educational and informational purposes only. It does not constitute financial advice or a recommendation to buy or sell any financial instrument. All trading involves risk. We are not responsible for any kind of loss incurred, whether financial, emotional, or otherwise. Always do your own research and consult with a licensed financial advisor before making any trading decisions.
Trading involves significant risk, and you should never invest more than you can afford to lose. Past performance is not indicative of future results.
The trade idea shared above reflects personal market interpretation and is subject to change based on new market conditions.
Posted by: THEPATELCRYPTO, 45Degree
Stay safe. Trade smart.
Follow for more ideas!
📍Posted by: THEPATELCRYPTO, 45Degree
📈 Stay safe. Trade smart.
🔔 Follow for more ideas!

BTC buying power is gradually increasing💎 Update Plan BTC at the beginning of the week (June 30)
Notable news about BTC:
Anthony Pompliano has merged Procap BTC with Columbus Circle Capital I, established Procap Financial - a Bitcoin warehouse company up to $ 1 billion. The company will deploy lending activities, derivatives ... in order to create a collection line from BTC, according to the similar model
Bitcoin price is stable at about $ 107.4K on June 27, before the expiry date of options worth up to US $ 40 billion, capable of causing strong fluctuations. At the same time, on June 29, BTC exceeded $ 108k, up ~ 0.68% compared to the previous day
In the past 7 days, BTC maintained around $ 104–107K despite tensions in the Middle East and the US economic data is not heterogeneous. Reduce slightly but receive support from organized cash flow and global trade progress.
Technical analysis angle
Overview of trends - many signs of increasing
Looking at the candle is signaling "Strong Buy" on many time frames, especially healthy momentum, the ability to breakout $ 116k if surpassed the $ 110k resistance
ETF liquidity and organizational capital flows are supporting the trend of increasing, strengthening the possibility of breakthrough.
Moving Averages:
Frame 1H: 64% Bullish signal (MA20 reversed), but there is a neutral signal from short -term ghosts
Daily/Weekly: Golden Cross (Golden Cross) between 50‑ and 200‑ MA, is a long -term trend increase signal
Oscillators:
RSI frame Daily ~ 55, showing neutral momentum, not too much purchased but there is a rise. Double Rounded Top model on the chart Daily, the current trend is neutral - Bearish if the breakdown supports Neckline ~ $ 106k; In contrast, strong recovery above $ 114k will invalid this model
Long -term / Swing Trade: Keep the position if the price is maintained> $ 106k, use $ 103–104K as a spare hole stop.
Short -term / Scalp Trade: can be in order when the test price is $ 106k–107k, small latches around $ 110k.
==> Comments for trend reference. Wishing investors successfully trading
