#BTC/USDT Update#Bitcoin Liquidity below the $60k has been taken. The price bounced right from the second EMA.
The third EMA is around $58.3k, The level I've been talking about in my previous updates.
The weekly close will provide more clarity.
Stay tuned, I'll keep this chart updated.
Thank you
Btcusdlong

Btcusd weekly Target Bitcoin (BTC) is recognised as the world's first truly digitalised digital currency (also known as a cryptocurrency). The Bitcoin price is prone to volatile swings; making it historically popular for traders to speculate on. Follow the live Bitcoin price using the real-time chart, and read the latest Bitcoin news and forecasts to plan your trades using fundamental and technical analysis.
Confirm Chart btcusd weekly Target

btcusd longBitcoin Price (BTC) Real-Time Live Price
Bitcoin News: Read the Latest Analysis on BTC
This guide is designed to help day traders navigate the cryptocurrency marketwith control and confidence and is built on decades of experience garnered by
analysts and authors. We will study a wide range of fundamental, technical and psychological
trading techniques that will help you master short-term trading in one of the most talked about and volatile marketplaces.
Bitcoin (BTC) is recognised as the world's first truly digitalised digital currency (also known as a cryptocurrency). The Bitcoin price is prone to volatile swings; making it historically popular for traders to speculate on. Follow the live Bitcoin price using the real-time chart, and read the latest Bitcoin news and forecasts to plan your trades using fundamental and technical analysis.confirm signal

btc long idea. i am bullish on these points. No Fear. But BTC. Make Money. thats easy
STOP LOSS : PROTECTED LOW POINT
TP : LIQ POINT
ENTRY ZONE : 64500-66000

BTC uptrend.When this MA crosses that MA, it could be a signal indicating a potential change in trend, thereby providing you with a good entry opportunity.
The price quickly moves upwards after breaking above the upper edge of the rectangle. If we have a buy order placed at the upper edge of the rectangle, we have made a profit. Just as the rectangle declines, here, once the price breaks out, it will move a distance equal to the width of the rectangle.

Bitcoin wave analysis 2023 - 20242023: sideway in range $16k - $30k to form A-B of B of 2
2024: go up at least $48.5k to form C of B of 2
Wave analysis details:
Bitcoin has started sub-wave orange A of white A of yellow B of 2
Since sub-wave yellow A of 2 has 3 swings (A-B-C), so wave 2 is flat correction which sub-wave yellow B has to go above 61.8% of A (around $48.5k)

BTC Market Insights: Expert Financial AnalysisIn today's financial landscape, Bitcoin (BTC) continues to capture attention and spark discussions among investors worldwide. As a seasoned financial analyst, I bring you insights into the latest developments shaping the BTC market.
Bitcoin's recent price movements have been dynamic, influenced by factors ranging from institutional adoption to regulatory shifts and macroeconomic trends. Understanding these dynamics is crucial for investors seeking to navigate the volatile cryptocurrency market.
In this analysis, we'll delve into key indicators and technical patterns driving BTC's price action. From support and resistance levels to market sentiment and fundamental drivers, we'll provide a comprehensive overview of the current state of the BTC market.
Additionally, we'll explore emerging trends and potential catalysts that could impact Bitcoin's trajectory in the coming days and weeks. Whether you're a seasoned crypto trader or a newcomer to the space, this analysis aims to equip you with valuable insights to make informed decisions in the ever-evolving world of digital assets. Stay tuned for a deep dive into the BTC market and actionable strategies for navigating its fluctuations.

BTC AnalysisDear traders
Contrary to popular belief that Bitcoin will stagnate in 2023 and grow spectacularly in 2024, the chart is behaving otherwise. In my opinion, when everyone expects a recession, Bitcoin will start to grow significantly and reach a new ATH price at about100k. Thus, the majority of people will wake up and start buying Cryptos at high prices, which is really late.
If you intend to hold long-term and get maximum profit from this market, it is the best time. Perhaps Bitcoin's behavior will be contrary to the stock market and will be able to attract the attention and trust of the majority of society (in my opinion, the stock market will bubble and collapse in the near future).
Yours sincerely

BTCUSD Analysis. i will long.Hello everyone. i want share my idea about Bitcoin price action.
We all saw Bitcoin bull run after ETF approval that means institutional are still in this game. at the moment last all time high we have at 73800, after that we saw rejection from sellers which tested well the strongest daily support.
If we we look at the picture from far we will see some technical signal which is head and shoulders, this technical movement gives me short signal but ill tell you some reasons why i think at bitcoin long.
First - Bitcoin has pretty bullish movement and this fall after all time high was logic, all market need correction after strong movement.
Second - Bitcoin touch to daily support at 61000$ where buyers long and we saw 8000$ movement in only one day. Yeah that's right bitcoin price came back to that zone but buyers are still active
Third - USDT dominance (index of Tether dominance on market) is still pretty bearish, USDT dominance after strong fall, came into 1 week Fibonacci high volume buy zone, got rejection from buyers but that rejection was not enough and for me it was correction of that index after strong fall.
Fourth - Bitcoin has still bull run, the last movement, what was today, for me that is continuation of trend and daily candle which closed 8000$ upside movement, after touch Strong daily support.
Here is my reasons why i will try to find low for open my long position. i will update that post with trading signal.
Always make your research!!!!

BITCOIN WITH CUP SHAPE !!! HELLO TRADERS !!!
As i can BTC is just completed our last given target as we had mention in our previous buying setups which is attached with current chart in comment sessions friends it had created a technical pattern which is cup shape as we can see technically it had created a double top and now rejecting from that resistance zone we are expecting it to complete a cup shape now before starting a new Bull run fundamentally Gray-scale ETF approved as we saw a pump and dump in GBTC in volume & price too SEC Chairman says on 12th Jan that Bitcoin is a highly speculative volatile asset used for illicit activity. at that time markets make a dump from 49K to 41.4K also those investors who bought near 17K 20K 25K cash out at resistence level but as we are always following both Technical + Fundamental always bring to us a great experience in markets ... so we follow to the given TPs its just an trade idea kindly share ur thoughts with us it help alote to other traders we appreciate Ur love and support Stay Tuned for more updates ..

BTC Insights: Expert Financial AnalysisIn the dynamic world of finance, Bitcoin (BTC) continues to captivate investors, serving as a focal point for discussions and speculation. As a seasoned financial analyst, I offer fresh perspectives on the current state of the BTC market.
Bitcoin's recent movements have been characterized by volatility, driven by a myriad of factors including institutional adoption, regulatory developments, and market sentiment. Understanding these nuances is essential for investors seeking to navigate the ever-changing landscape of cryptocurrencies.
In this analysis, we'll explore key indicators and technical patterns influencing BTC's price dynamics. From support and resistance levels to emerging trends and fundamental drivers, we'll provide a comprehensive overview of the factors shaping Bitcoin's trajectory.
Furthermore, we'll discuss potential catalysts on the horizon and their potential impact on BTC's price in the short and medium term. Whether you're an experienced crypto trader or a newcomer to the space, this analysis aims to provide actionable insights to help you make informed decisions in the dynamic world of digital assets.
Stay tuned for an in-depth exploration of the BTC market and expert perspectives on its future direction.

Bitcoin Analysis: Facing Key Decision ZoneAs seen in previous analyses, we have reached and broken the target ($67,000). We are now operating in a pivotal zone that could either continue selling and break the rectangle from the bottom towards $63,000, or break it from the top and rise back to $67,000, which has now become a resistance zone after previously serving as support.
As indicated by technical analysis, clarity will emerge after this brief pause, especially as the new day's opening candle approaches, revealing who will dominate this challenging zone.
I wish you success in your decision-making and finding the right place at the right time, and I hope this analysis proves helpful to all.

btcusd confirm chartBitcoin (BTC) is recognised as the world's first truly digitalised digital currency (also known as a cryptocurrency). The Bitcoin price is prone to volatile swings; making it historically popular for traders to speculate on. Follow the live Bitcoin price using the real-time chart, and read the latest Bitcoin news and forecasts to plan your trades using fundamental and technical analysis.
Bitcoin price action for the past three weeks has been confusing for sidelined participants. On the one hand, investors are ignoring BTC and trading altcoins, and on the other hand, traders are expecting a potential dip.
btcusd confirm signal

Decrypting Bitcoin: Insights from a Financial ExpertIn the fast-paced world of finance, few assets have captured the imagination and sparked as much debate as Bitcoin. As a seasoned financial expert, exploring the intricacies of this digital currency unveils a narrative brimming with innovation, volatility, and transformative potential.
Bitcoin's Genesis:
Born out of the aftermath of the 2008 financial crisis, Bitcoin represents a radical departure from traditional monetary systems. Its decentralized nature, underpinned by blockchain technology, challenges the status quo of centralized banking and heralds a new era of digital finance. With a fixed supply and transparent ledger, Bitcoin offers a glimpse into a future where trust is decentralized and censorship-resistant.
The Rise of Digital Gold:
In an era plagued by economic uncertainty and fiat currency debasement, Bitcoin has emerged as a digital counterpart to gold. Its properties as a scarce, fungible, and portable asset have attracted the attention of institutional investors and retail enthusiasts alike. With a growing recognition as a store of value and a hedge against inflation, Bitcoin's ascent from obscurity to prominence underscores its disruptive potential within the financial landscape.
Navigating Market Volatility:
Despite its growing adoption and mainstream acceptance, Bitcoin remains susceptible to bouts of extreme volatility. Price fluctuations, fueled by market sentiment and regulatory developments, are characteristic of an emerging asset class navigating uncharted waters. However, for astute investors, volatility presents opportunities for profit and portfolio diversification, provided they possess a robust risk management strategy.
Democratizing Finance:
Beyond its role as a speculative asset, Bitcoin holds the promise of democratizing finance and fostering financial inclusion. By circumventing traditional banking infrastructure, Bitcoin provides individuals in underserved regions with access to a global financial network. Moreover, its open-source ethos has spurred innovation, giving rise to a burgeoning ecosystem of decentralized applications and financial services.
Harnessing the Potential:
As financial professionals grapple with the complexities of digital asset management, Bitcoin offers a compelling avenue for portfolio diversification and risk mitigation. Whether embraced as a long-term investment or utilized for speculative trading, Bitcoin's asymmetric risk-reward profile presents opportunities for savvy investors to capitalize on market inefficiencies and emerging trends.
In conclusion, the evolution of Bitcoin represents a convergence of finance, technology, and socio-economic change. As a financial expert, deciphering the intricacies of Bitcoin unveils a narrative marked by disruption, innovation, and transformative potential. Amidst the flux of market dynamics, Bitcoin stands as a testament to the power of decentralized finance and the democratization of wealth creation.

BITCOIN DESTINED TO BUST | 83K+ TARGETCRYPTOCAP:BTC is in a clear multi-week symmetrical triangle pattern, consolidating between the low 70s and low 60s. Many traders seem to be preparing for a move downward, but I think we will see the opposite.
Bitcoin has bounced on the lower trend line of the triangle pattern, confirming a third touch. Bitcoin is also back above its long-term uptrend support line after losing it for the past few days. Institutions are also piling on shorts for Bitcoin, and we have seen a clear trend in this bull market—that overleveraged players will get wiped out. Their shorts are our fuel to pump.
Wait for a breakout, and then 80K+ is the short- to medium-term target.

ETHUSD / Long Trade Active ✅💡Hello Traders!
This is my idea for ETHUSD. I expect a bullish breakout as the price liquidates the old lows.
My expectation is to see the price to close the FVG and also to set a new PWH as we are in a bullish trend.
Please LIKE 👍, FOLLOW ✅, SHARE 🙌, and COMMENT ✍ if you enjoy this idea! Also, share your ideas and charts in the comments section below! This is the best way to keep it relevant, support us, keep the content here free, and allow the idea to reach as many people as possible.
____________________________________
www.tradingview.com

I think the price will decreaseReference order
Entry point 65574
manage command 66209
stop loss 66662
Manage order 64667 closing 70% of volume
target 64110

Maybe 13k & we start see upside to 80kHey traders & investors
we all know that we are in recession and Bitcoin flowing the stock market not like before. so my prediction for next year is clear and i hope im right .
i will be happy to discuss this idea with you just leave a comment with your opinion .
Thank you
Remember this is not a financel advice .

BTC going up rapidly after 66800 BULLS Hold... Too much support for BTC in the 60k range for it to go short.
Find your fave alt and buy buy buy. Eyes on EOS and REN
Follow my ideas and drop some comments
I will be updating as I exit and enter
This is a strong two week hold.
LEGOOOOOOOOOOOOO....

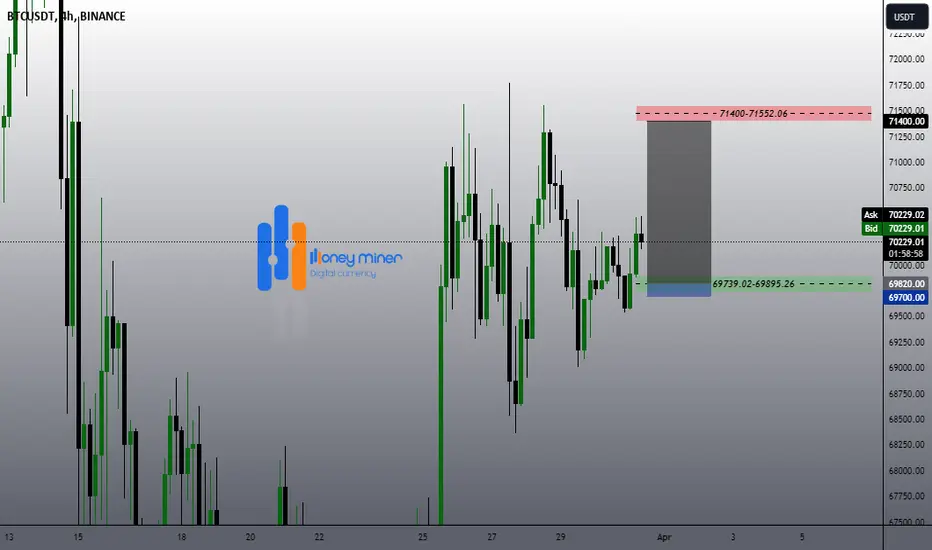
BTCUSDTBitcoin time frame 4 hours
Bitcoin can move towards the target of 71400 after retesting the 69800 range.
We can enter a long position with a small stop loss that gives us RR 13.
Btcusd weekly chartBitcoin Weekly Forecast: BTC looks set for correction amid increasing sell signals
Bitcoin price hovers around the 2021 ATH of $69,138 after a 65% year-to-date returns. The Momentum Reversal Indicator (MRI)’s warning sell signal of a down yellow arrow hovers above the ongoing weekly candlestick. This technical formation suggests that the next up candlestick would flash a red ‘one’ sell signal. This signal, from a theoretical perspective, forecasts a one-to-four down candlesticks.
Bitcoin (BTC) price action remains unchanged as it trades below the 2021 ATH for the fourth consecutive week. With Grayscale’s ETF outflows slowing down, investors expect a positive outlook for the crypto markets, but the short-term directional bias, at least from a technical perspective, remains bearish for BTC.

btcusd chart long Bitcoin (BTC) is recognised as the world's first truly digitalised digital currency (also known as a cryptocurrency). The Bitcoin price is prone to volatile swings; making it historically popular for traders to speculate on. Follow the live Bitcoin price using the real-time chart, and read the latest Bitcoin news and forecasts to plan your trades using fundamental and technical analysis.
btcusd sell 69640
target 65233
confirm signal btcusd sell

BTC price will increase againAs a seasoned financial expert, I am compelled to explore the evolving landscape of cryptocurrency, particularly Bitcoin, and its impact on the global financial system. In this analysis, I aim to shed light on the multifaceted nature of Bitcoin and its implications for investors and financial markets.
Bitcoin, often hailed as digital gold, has emerged as a disruptive force within the financial industry. Its decentralized nature, limited supply, and pseudonymous transactions have captivated the imagination of investors seeking alternative assets and hedging strategies.
One of Bitcoin's most compelling attributes is its potential as a store of value. Similar to gold, Bitcoin offers a hedge against inflation and economic uncertainty, with proponents arguing that its fixed supply and deflationary nature make it a viable long-term investment.
Furthermore, Bitcoin's underlying technology, blockchain, has far-reaching implications beyond the realm of finance. Its transparent and immutable ledger system holds promise for revolutionizing various industries, from supply chain management to digital identity verification.
From a portfolio management perspective, Bitcoin's low correlation with traditional assets presents opportunities for diversification and risk management. While its volatility remains a concern for some investors, others view it as a source of potential alpha in a rapidly evolving market.
Moreover, Bitcoin's growing acceptance as a mainstream asset class is evidenced by institutional adoption and regulatory recognition. Major financial institutions, corporations, and even governments are beginning to integrate Bitcoin into their operations, signaling a broader acceptance of cryptocurrencies within the traditional financial system.
However, it's essential to approach Bitcoin investment with caution and a comprehensive understanding of its risks and rewards. Regulatory uncertainty, technological vulnerabilities, and market manipulation are factors that investors must consider when navigating the Bitcoin ecosystem.
In conclusion, Bitcoin represents a paradigm shift in the way we perceive and interact with money. As a financial expert, I encourage investors to embrace the potential of Bitcoin while remaining vigilant and informed in their investment decisions. Whether viewed as a speculative asset or a revolutionary technology, Bitcoin continues to redefine the boundaries of finance and offers new avenues for wealth creation and financial inclusion.
