Updated longterm BTC chart: The road to 1 million.I am a BTC bull, but I see far too many overly optimistic price projections on tradingview.
They seem to draw an exponential channel, instead of the current one, that is curved.
While of course it can be that BTC goes out of the current channel, and bursts through the upper resistance, thus reverting back to its original exponential trend,
I like to be more conservative. Because as of now, there is still no reason to believe that BTC will do so, only because it has pumped now already 6 months earlier than 4 years ago.
This could just mean that we also reach the peak 6 months earlier.
The fundamental price drivers will remain the halvings and mainstream adoption.
We can also clearly see that the factors between the subsequent peaks is diminishing every time.
From x38 to x16 and now probably to around x6 and so on.
It cannot just continue to do the same increases again and again, then we would have prices of 100 million USD by 2025 or some insane stuff like that.
That is not very scientific but sensationalist, and we should remain realistic here, even if that means being more conservative. Conservative with 1.3 million in 2030 LOL.
Try telling that someone in the stockmarket hehehe!
Anyways, there is indeed the chance that BTC leaves this channel and creates a faster rising one, but the future datapoints are not here yet, so we must use
the past points for extrapolation.
But no matter what happens, I am convinced that BTC mainstream adoption WILL happen. It's not an "if" question, but a "when" question.
Btcusdlong


$BTC #BTC #Bitcoin #Elliottwave long trade setup.This count is based on my assumptions so anything can happen not a trading or financial advice just for educational purposes only kindly do your own ta thanks trade with care good luck.

BTC 3 h : The time has come to ascend in this time frameThis time frame has created a downward trend for some time and this trend was broken in a few candlesticks ago, and now it is time to rise in this time frame.

Bitcoin AnalysisTo make a better decision, you should wait until the dollar index reacts to the support and resistance ranges
Do not rush to buy!

This isnt the bottom yet on BTCI dont care what moonboys will tell me, i dont believe its the bottom yet.
Maybe im wrong (i could be) but i think we are heading down soon again, maybe we visit 24-25k first, but the bigger picture is forming lots of bearish action.
Have a great day.

BTCUSDT WE HOLDING LONG BOIIIII TP COMING SOON!THIS IS NOT A FINANCIAL ADVICE....this video is provided for educational, informational, and entertainment purposes only, without any express or implied warranty of any kind, including warranties of accuracy, completeness, or fitness for any particular purpose.
Let's look closely on this pair for a day or 2. Big momentum is coming.

BTCUSDT current 4h candle has a higher probability of being greeThis current 4h candle (UTC 12:00 - 16:00) has a higher probability of being a green one.

BTC current 15m candle has a higher probability of being a greenThe current 15m candle (UTC 8:45-19:00) has a higher probability of being a green one.


BTC update, plan is readyBTC update...
Bitcoin hit Fibonacci 0,5 perfectly... No clean trade signals yet, but we are almost there...
While everyone thinks were going to 25k, manipulation can take place with an early pullback...
Trading plan is ready, waiting for these setups🐨

BTCUSDT AnalysisBTC is trying to test 24k level.
If BTC breaks through 24k level then its next target would be 28K.
If BTC does not break through 24K then it is likely to trade sideways between 22k and 24k in the short run.

BTCUSDT trading inside weekly resistance zoneThis weekly resistance range is indeed a strong one as price is not able to easily move above it even on intra week basis. However, once price trades above this resistance for a a day or so it is more likely that the weekly candle will close above this resistance zone.
By looking at the several attempts and the price trading longer in the resistance zone rather than below it, suggests the probability to break it further up side is higher. And that increases the probability for the weekly price to close above this weekly resistance zone higher.

Bitcoin Challening The Daily 314 Moving AverageBTC/USDT is challenging the 314ma on the daily chart. The SPX already just made it over. They tent to be mirrors of each other. You know, like the couple that finish each other sentences (ain't they annoying?).
This really is pump or get rejected time - sort of like a first date.
OK, enough - that's my take on it.
This is a moment of rejection or perfection. Sideways isn't really an option.

BTC/USDT Trade Strategy for FOMC!Bitcoin is currently trading right around the $23k area.
Lower Support is around the $22.3k level.
This is my strategy for the meeting:-
I am holding no leverage long positions as of now.
I have placed orders for Doge and BTC.
Lower levels to long BTC are $22322, $22569, and $22689.
These can easily get filled with choppy price action.
FOR NEW TRADERS:- Do not trade at all!
Wait for the market to settle down and get entries a few hours after the announcement.
DYOR, This is not financial advice.
The two scenarios are shown in this chart.
Which one do you think is highly likely?
Invalidation:- Break and close below $21878, which will be our Stop Loss.
Do show your support, it motivates me to post frequently.
Thank you
#PEACE

LETS PUMP THIS BABY. BTC/USDT ANALYSIS THIS IS NOT A FINANCIAL ADVICE....this video is provided for educational, informational, and entertainment purposes only, without any express or implied warranty of any kind, including warranties of accuracy, completeness, or fitness for any particular purpose.
LET'S GATHER AT 25K AND TALK WHAT ARE THE NEXT POSSIBLE ZONE! TUNE IN!

Bitcoin to leg up?Bitcoin - 24h expiry - We look to Buy a break of 24011 (stop at 23379)
Our short term bias remains positive.
There is no clear indication that the upward move is coming to an end.
A break of the recent high at 23956 should result in a further move higher.
We are trading at overbought extremes.
Daily signals are bullish.
Our profit targets will be 25641 and 25941
Resistance: 23100 / 23500 / 23923
Support: 22700 / 22500 / 22300
Please be advised that the information presented on TradingView is provided to Vantage (‘Vantage Global Limited’, ‘we’) by a third-party provider (‘Signal Centre’). Please be reminded that you are solely responsible for the trading decisions on your account. There is a very high degree of risk involved in trading. Any information and/or content is intended entirely for research, educational and informational purposes only and does not constitute investment or consultation advice or investment strategy. The information is not tailored to the investment needs of any specific person and therefore does not involve a consideration of any of the investment objectives, financial situation or needs of any viewer that may receive it. Kindly also note that past performance is not a reliable indicator of future results. Actual results may differ materially from those anticipated in forward-looking or past performance statements. We assume no liability as to the accuracy or completeness of any of the information and/or content provided herein and the Company cannot be held responsible for any omission, mistake nor for any loss or damage including without limitation to any loss of profit which may arise from reliance on any information supplied by Signal Centre.

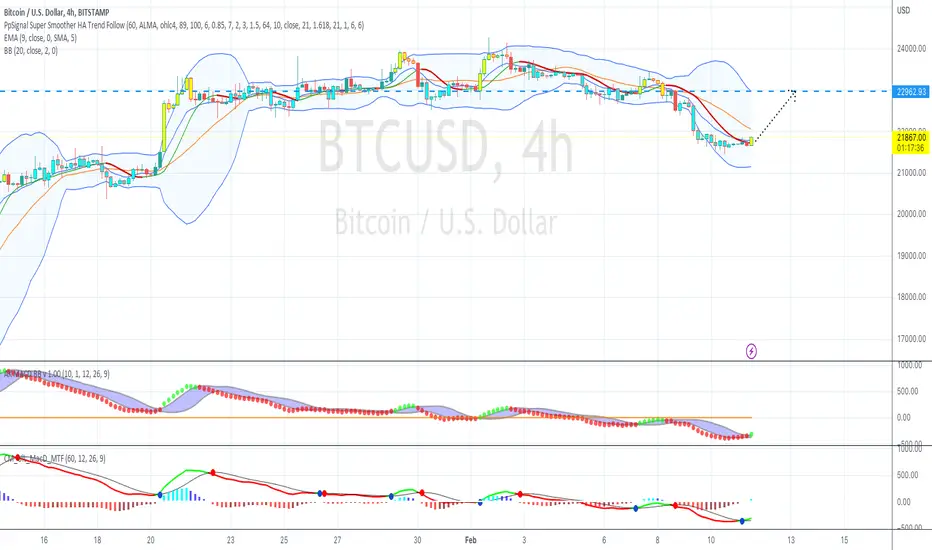
BTCUSD heading higher after retesting 4h support at 22860So the last post talked about getting the support around 22860 and bounce. It bounced yesterday and again today from that level which is 4 hour support area. Now it has blasted through the recent 4 hour resistance sitting at 23200.
Price is also trading currently above the monthly resistance and inside the weekly resistance zone. Lets watch the price action but it is looking promising. I think it is going to cross the recent high as it has higher probability but before that there could be a retest of 23200 level.

Psychology of a Market Cycle Ft. BitcoinPsychology of a Market Cycle Ft. Bitcoin
Tried to match the psychology of Market Cycle with Bitcoin, I think we are about to see a price target of $14-$16k before the actual rally begins.
This was a very well executed market cycle by the whales and market makers.
Healthy for long term.

Bitcoin - THIS Support MUST HOLD❗Hi Traders, Investors and Speculators of the Charts 📈📉
Here's a quick 3min video for a potential long-setup on Bitcoin with an entry point, a take profit point and a stop loss point.
Here's my previous analysis on near term price action on BTC, which played out almost exactly:
_______________________
📢Follow us here on TradingView for daily updates and trade ideas on crypto , stocks and commodities 💎Hit like & Follow 👍
We thank you for your support !
CryptoCheck

Bitcoin Monthly ProjectionsBitcoin is yet to see a true bottom and we still have time until the next halving

BTCUSD, I still have my eye on 30K! Evening all!
You know the drill by now!
Let's have a chat, BTC is a loose canon but we can get on the right side!
Leave us your thoughts below!
