Asymmetrical Triangle (Neutral) or AB=CD (Bullish) for BTC?BINANCE:BTCUSDT has formed bullish divergence on Daily TF and continues its upward momentum. BTC has also formed two trading patterns:
1. Asymmentrical Triangle: This neutral pattern can break out in either direction
2. Bullish AB=CD: This continuation pattern on the weekly tf coupled with bullish divergence on daily tf indicates imminent continuation of the bullish trend.
Buy stop order on break of LH could be a good trading idea!
Btcusdlong

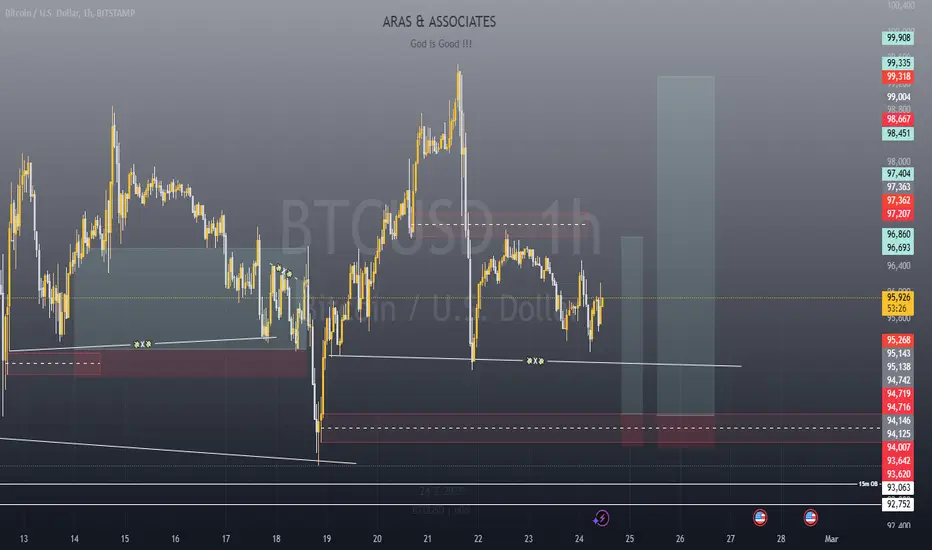
BTC 1HIt seems the dark days is going to take a break as moon is getting full and volume shows big cash got in !
predicted price has been shown !
BYBIT:BTCUSDT
THE MOON LOVES YOU !

Bitcoin (BTCUSD) Falling Wedge Breakout – Bullish Setup! 📌 Overview of the Chart Setup
This daily Bitcoin (BTC/USD) chart presents a technical breakout from a falling wedge pattern, a well-known bullish reversal signal. The price has been forming lower highs and lower lows over the past months, consolidating within a tightening structure. However, the current price action suggests an early breakout attempt, which could lead to significant upside movement in the coming weeks.
Let’s break down the key levels, technical insights, and trading opportunities visible in this chart.
📉 Chart Pattern: Falling Wedge (Bullish Reversal)
🔹 What is a Falling Wedge?
A falling wedge is a bullish continuation or reversal pattern characterized by converging downward-sloping trendlines. It typically signals a loss of bearish momentum, leading to a breakout to the upside.
🔹 Key Observations in the Chart
The price has been moving inside the falling wedge structure, with clear lower highs and lower lows.
The support level around $75,000-$80,000 has been repeatedly tested, forming a strong demand zone.
A trendline breakout has occurred, suggesting that bulls are regaining control over the price action.
Volume is expected to increase upon a confirmed breakout, reinforcing the bullish momentum.
📊 Important Technical Levels
1️⃣ Support & Resistance Zones
📌 Support Level: The $75,000-$80,000 zone has acted as a strong base, preventing further downside. Buyers have stepped in multiple times here.
📌 Resistance Level: The $95,000-$100,000 range represents a historical resistance where price has struggled to break through.
2️⃣ Trendline Breakout
The chart clearly shows a breakout above the falling wedge’s upper boundary, indicating a potential trend reversal from bearish to bullish.
If this breakout holds, Bitcoin could see strong buying pressure pushing it toward its next major resistance level.
📈 Trading Strategy & Setup
🔹 Entry Confirmation
To enter a long position, traders should wait for:
✅ A daily close above the wedge resistance (confirmed breakout).
✅ A successful retest of the breakout zone, which strengthens the bullish case.
A breakout retest is ideal because it provides a lower-risk entry point, ensuring the breakout is legitimate rather than a false move.
🔹 Target Price Projection
Using the height of the falling wedge as a projection, the potential price target is set at $118,000.
This level aligns with a 35%+ upside from the breakout zone.
Bitcoin must clear the $95,000-$100,000 resistance before reaching the final target.
🔹 Stop Loss Placement
A stop loss is positioned at $59,896, slightly below the previous major support zone.
This ensures that if the breakout fails, losses are minimized while still allowing price fluctuations within expected volatility.
🔹 Risk-to-Reward Ratio
Entry around breakout level (~$87,000)
Target: $118,000 (35% upside)
Stop Loss: $59,896 (~30% downside)
Risk-to-reward ratio: ~1:3, making this an attractive trade setup.
📢 Market Psychology & Sentiment
Why This Pattern Matters?
A falling wedge represents seller exhaustion. Over time, the bearish pressure weakens, leading to a bullish breakout.
If Bitcoin can maintain this breakout, momentum traders and institutional investors may step in, accelerating the rally.
Breaking above the resistance at $95K-$100K would confirm bullish dominance, potentially leading to new all-time highs.
Potential Risks
❌ Fake Breakout: If Bitcoin fails to hold above the wedge resistance, we may see a pullback to support before another breakout attempt.
❌ Macro Factors: External factors like regulatory news, interest rate decisions, and market-wide sentiment could impact price action.
❌ Bitcoin Dominance: If altcoins start rallying, some capital may rotate out of Bitcoin, slowing the upside move.
🚀 Final Thoughts: A High-Probability Bullish Setup
✅ The falling wedge breakout suggests a strong bullish shift, with a 35%+ potential upside.
✅ A confirmed breakout above $95K-$100K will act as a final confirmation before the next leg up.
✅ Risk is managed with a stop loss at $59,896, ensuring downside protection.
🔹 Best trading approach? Wait for confirmation, manage risk, and let the trend develop.
Would you like additional insights on entry techniques, volume confirmation, or potential invalidation points? 😊

BTC/USD Trading Analysis – Double Bottom & Rising Wedge BreakoutThis BTC/USD 4-hour chart showcases a potential bullish breakout setup based on technical patterns, key support and resistance levels, and price action analysis. The chart suggests a trend reversal following a downtrend, with signs of bullish momentum building up.
Let's break down the full technical analysis, covering the chart structure, key levels, price patterns, and trading strategy.
1. Market Structure & Identified Patterns
A. Double Bottom Reversal – Strong Bullish Signal
A double bottom pattern has formed, which is a bullish reversal signal that indicates the end of a downtrend.
This pattern consists of two significant low points (Bottom 1 and Bottom 2) near the $80,000 - $81,000 support zone.
The pattern confirms strong buying interest at this level, preventing further price drops.
A breakout above the resistance level would confirm the pattern’s validity, signaling a move toward higher targets.
B. Rising Wedge Formation – Potential Bullish Breakout
The price action is consolidating in a rising wedge, forming higher highs and higher lows within a narrowing range.
A rising wedge often suggests a potential breakout.
Since this wedge forms after a double bottom, the breakout is expected to be bullish, rather than a bearish breakdown.
If the price breaks above the wedge’s upper trendline, it will confirm a strong upward momentum.
2. Key Support & Resistance Levels
Support Levels:
Major Support Zone (80,000 – 81,000):
This level has been tested twice, confirming buyer strength.
It serves as the foundation for the double bottom pattern.
Stop Loss Level (72,921):
If the price drops below this level, it would invalidate the bullish setup.
This level is strategically placed to manage risk and protect against potential downturns.
Resistance Levels:
First Resistance Zone (95,000 – 100,000):
This is a critical level, as the price has faced multiple rejections here.
A breakout above this zone would confirm a strong bullish trend continuation.
Take Profit Targets:
TP1 (108,481): The first take-profit target aligns with previous highs and is a logical point for partial profit booking.
TP2 (114,372): This is the second profit target, calculated based on Fibonacci extensions and historical price movements.
3. Trading Strategy & Execution Plan
A. Entry Strategy
To execute a successful trade, we need to wait for confirmation of the breakout.
Ideal Entry: After a strong breakout above 95,000 – 100,000, indicating bullish momentum.
Confirmation Factors:
Increased trading volume → Signals strong buying interest.
Candle close above resistance → Confirms breakout.
Retest of broken resistance as support → Strengthens bullish continuation.
B. Risk Management
Stop Loss Placement: Below 72,921, ensuring limited downside risk.
Risk-to-Reward Ratio: The trade setup aims for a 1:3 or better risk-to-reward ratio.
C. Potential Scenarios
✅ Bullish Breakout:
If BTC breaks and holds above 95,000 – 100,000, we can expect a rally toward 108,481 (TP1) and 114,372 (TP2).
❌ Bearish Rejection:
If BTC fails to break resistance, it could retest 80,000 or drop lower, invalidating the bullish setup.
4. Final Thoughts – What to Expect?
This BTC/USD 4-hour chart analysis provides a high-probability bullish trade setup, supported by:
✅ Double Bottom Formation → Strong Reversal Signal
✅ Rising Wedge Breakout Potential → Momentum Building
✅ Key Resistance Breakout Levels Identified
📌 Conclusion:
If Bitcoin breaks above 95,000 – 100,000, expect a major bullish move toward 108,481 and beyond. However, if resistance holds, we might see a retest of lower support levels. Risk management is essential for a successful trade execution. 🚀

Potenial inverse head and shoulders pattern for Bitcoin This is the scenario I’m believing in for the near term for BINANCE:BTCUSD .
One more leg down to confirm the neckline around 78,300 USD.
Quick reversal price action to retest the 92,300 USD (ish) level.
If the breakout takes place to the upside, then I think we will retest the previous highs, with a higher probability of going much higher. Although I believe the tariffs will have a big impact on the USD (DXY index), which I believe will have a strong effect on BTC for the near term, around the coming 6 months. So, I believe the new high will most likely come in Q4 this year, making this cycle different from the historic crypto cycles. Although, there is still a chance that other countries will start to adopt more crypto-friendly policies for crypto or Bitcoin, making this thesis more uncertain. If the policies come out as positive, then I think there are good chances of reaching new highs earlier than Q4, 2025.

Bitcoin's Wedge Breakout – Big Move Incoming?"Key Observations:
Descending Wedge Breakout:
BTC has been trading within a descending wedge pattern, which is typically a bullish reversal formation.
The price has now broken above the wedge, signaling potential upside momentum.
Buy Setup:
A buy entry is marked around $83,900 - $85,000.
The stop-loss is placed near $79,154 - $80,000, just below the previous support.
The target is set at $90,126, aligning with a key resistance level.
Trade Strategy:
Bullish case: If BTC sustains above the breakout level, it could rally toward $90,000+, offering a strong risk-reward opportunity.
Bearish case: If BTC falls back below $83,305, it may invalidate the bullish breakout and revisit lower support.
Conclusion:
This setup suggests bullish potential with a favorable risk-to-reward ratio. Traders should monitor BTC’s reaction at the buy zone and adjust their stop-loss accordingly.

(BTC/USD) – Rising Wedge Pattern - Critical Breakout Setup🔍 Market Overview & Technical Breakdown
Bitcoin (BTC/USD) is currently forming a rising wedge pattern on the 4-hour timeframe, which is a bearish signal indicating a potential reversal. The price action shows higher highs and higher lows, but the narrowing wedge suggests that buying momentum is weakening.
BTC has been battling a major resistance zone around $85,000 - $87,500, struggling to break higher. If Bitcoin fails to hold above the key support level at $80,000, we could see a strong downside move. However, if BTC breaks the upper resistance, the bearish setup may be invalidated, opening the door for a push toward $95,000+.
📉 Rising Wedge Pattern (Bearish Formation)
A rising wedge occurs when the price moves upward within two converging trendlines, making higher highs and higher lows but with a weakening bullish momentum. This pattern often breaks downward, leading to a sharp sell-off.
Characteristics of This Wedge Formation:
✅ Upward Sloping Support & Resistance Lines: BTC is trending higher, but the slope is narrowing, showing a loss of bullish strength.
✅ Decreasing Volume: Volume is declining as price moves higher, indicating buyers are losing control.
✅ Bearish Breakout Probability: Rising wedges typically break down 75% of the time, suggesting a high likelihood of a drop below support.
🔑 Key Levels to Watch
🔺 Resistance Zones (Potential Breakout Levels)
1️⃣ $85,000 - $87,500 → Strong resistance; BTC has repeatedly failed to break above.
2️⃣ $90,000+ → A confirmed breakout would invalidate the wedge and shift the trend bullish.
3️⃣ $107,000 Target → If BTC breaks above resistance, we could see a move toward the psychological $100,000 - $107,000 level.
🔻 Support Levels (Bearish Breakdown Zones)
1️⃣ $80,000 - $82,000 → Key support within the wedge; a breakdown confirms the bearish move.
2️⃣ $75,000 → Strong historical demand zone; BTC could bounce here if it drops.
3️⃣ $70,000 and Below → Ultimate bearish target if selling pressure accelerates.
📈 Bullish vs. Bearish Scenarios
⚠️ Bearish Scenario (Rising Wedge Breakdown)
🔴 Entry: Below $80,000 (confirmed breakdown).
📉 Stop-Loss: Above $83,500 (to avoid fakeouts).
🎯 Take-Profit Targets:
TP1: $78,000
TP2: $75,000
TP3: $70,000
🔹 Confirmation: Look for increased selling volume and a retest of $80,000 as resistance after breakdown.
🚀 Bullish Scenario (Breakout Above Resistance)
✅ Entry: Above $87,500, confirming bullish momentum.
📉 Stop-Loss: Below $85,000 (to minimize risk).
🎯 Take-Profit Targets:
TP1: $90,000
TP2: $95,000
TP3: $107,000
🔹 Confirmation: BTC must break the wedge’s upper boundary with strong volume for bullish continuation.
📊 Technical Indicators & Market Sentiment
🔵 RSI (Relative Strength Index)
Currently near 60 – Showing bullish momentum but not yet overbought.
A move above 70 could signal an overbought market and potential reversal.
🔴 Volume Profile
Volume is decreasing as BTC rises, suggesting a possible exhaustion of buying power.
A breakout should be accompanied by strong volume to confirm bullish strength.
🟢 Moving Averages (EMA & SMA)
BTC is trading above key EMAs (50 & 200), supporting the bullish case.
A breakdown below the 50 EMA could accelerate selling pressure.
📢 Final Thoughts: High-Risk, High-Reward Setup
🚨 BTC is at a critical decision point! The rising wedge pattern suggests a bearish reversal, but confirmation is needed. If BTC breaks below $80K, expect a strong sell-off. However, if bulls manage to break above resistance, BTC could rally toward $100K+.
🔹 Risk Management Tip:
✅ Always wait for confirmation before entering a trade.
✅ Use stop-losses to protect your capital.
✅ Monitor volume & key levels for stronger trade signals.
🔥 What’s your take on this setup? Will BTC break down or push higher? Let’s discuss in the comments! 👇

Btcusd trade idea e read caption This chart represents a technical analysis of Bitcoin (BTC/USD) on the 1-hour timeframe from Coinbase. Here are the key elements of the analysis:
1. Order Block (Green Zone):
The green zone represents a significant order block, indicating an area where institutional buying or selling activity previously took place. The price has reacted strongly to this zone, confirming its importance.
2. Entry Point (White Line & Label):
The price has broken above the order block, suggesting a bullish entry. This level is marked as an optimal entry zone for a long position.
3. Price Movement & Target Levels (Yellow Arrows):
Two yellow arrows suggest that the price is expected to move upwards towards key resistance or profit target zones.
4. Target Levels (Dashed Lines & Blue Labels):
$88,000.17 and $90,681.03 are identified as potential profit targets, indicating resistance levels where the price may face selling pressure.
5. Current Price & Trend:
Bitcoin is currently trading at $85,511.26, with a 3.40% increase. The strong breakout suggests bullish momentum.
6. Market Volume (Right-Side Volume Profile):
The volume profile on the right shows high trading activity around the $84,000 level, which could act as support in case of a pullback.
Summary:
A breakout above a key order block suggests bullish continuation.
Entry is positioned above the breakout.
Target levels are set at $88,000 and $90,681.
High probability of upward movement based on volume and trend analysis.
This analysis suggests a bullish setup with potential gains if the price sustains above the order block and moves toward the target zones.

BTCUSD - A fresh look on the current supportIf you understand the mechanics of the Medianlines aka Pitchfork, then you understand the projected movement of the markets.
Whatever you measure with them, the same principal applies.
In the prior analysis, the framework of the Medianlines pointed us in the right direction.
Now it's time to reassess this product.
The 0 to 5 Count:
It's often a good indication when the last sprint happens. After P5, the count starts again from 0, up to 5 again. Here we see that the P5 was reached and we get the bounce, down to the Center-Line aka Medianline, where it finds support.
Could it move upward again? Absolutely, even if it where just for a pullback and the a further continuation to the downside. In fact, I even expect it to bounce up to the red resistance zone.
This would mark P2 before a harder drop down to P3, cracking the Centerline.
Most often after the Centerline is breached, we see a test/retest to it. (P3-P4), an exhaustion of the buyers and then the final hit on the head with a target at P5. In between P4 and P5, there's also the 1/4 line, where we often see a sudo-support. But it's not often that price starts to turn again and negating P5. It's mostly just a try, before the last drop to P5.
So there you have my coffee-ground reading.
Always remember, that even with such an accurate TA-Framework, we only shall trade what we see.
Many thanks to the loyal followers and all likes and sharing. I always love your feedback and constructive criticism. §8-)

Tue 18th Mar 2025 BTC/USD Daily Forex Chart Buy SetupGood morning fellow traders. On my Daily Forex charts using the High Probability & Divergence trading methods from my books, I have identified a new trade setup this morning. As usual, you can read my notes on the chart for my thoughts on this setup. The trade being a BTC/USD Buy. Enjoy the day all. Cheers. Jim

BTC confirms correction increase at Daily!BTC confirms correction increase.
Watch for short-term buying to 94000 area
Absolute Stoploss point at 76400

BTC: Pennant Pattern$BTC Bears have been in Complete Control & Regain the 18k Crucial Support..
According to pennant pattern , Bitcoin Might going to 11-12k Before break out.

Mon 3rd Mar 2025 BTC/USD Daily Forex Chart Buy SetupGood morning fellow traders. On my Daily Forex charts using the High Probability & Divergence trading methods from my books, I have identified a new trade setup this morning. As usual, you can read my notes on the chart for my thoughts on this setup. The trade being a BTC/USD Buy. Enjoy the day all. Cheers. Jim

Bitcoin Dropped Below $80k: Will This Nightmare Will Be Stopped?Hello, Skyrexians!
Despite the extreme fear tonight BITSTAMP:BTCUSD continues going down and finally broke $80k. Investors are panic selling right now and don't know what to do. But we pointed out earlier that the most impulsive part of bull run ahead and current dump is just the correction.
Let's take a look at the weekly time frame. Here we can see that the potentially strongest reversal signal has been broken. We are talking about divergence with AO. That is the reason why we marked that waves 1 and 2 like you see on the chart. According to this counting we can see that wave's 3 targets are at the $140k and $190k. At the same time we wanna tell you that the strong resistance is located at 1 Fibonacci level at $110k and we have seen it already.
Current dump is wave 2 inside wave 3. It has the target between 0.5 and 0.61. The first one has been already reached. We expect reversal from here. Moreover Fractal Trend Detector is showing us bull run support with the green zone and now we see its retest.
Best regards,
Skyrexio Team
___________________________________________________________
Please, boost this article and subscribe our page if you like analysis!

BTC USDT Buy ZoneAs discussed earlier safe zone for BTC USDT LONG/BUY .
Handel with care maximum possiblility of testing 89000 area place order accordingly.
Happy Trading ..

BITCOIN at Major Support - Will Buyers Push Toward 98,250?COINBASE:BTCUSD has reached a significant support zone, highlighted by previous price reactions and strong buying interest. This area has historically acted as a key demand zone, increasing the likelihood of a bounce if buyers step in.
The current market structure suggests that if the price confirms support within this zone, we could see a bullish reversal. A successful rebound could push the pair toward the 98,250 level, a logical target based on past price behavior and structural confluence.
Just my take on support and resistance zones—not financial advice. Always confirm your setups and trade with solid risk management.
Best of luck!

Rinse & Repeat !!!Hello everyone, a happy new trading week to you all !.
This setup is particularly a short-term buy for those looking to take advantage of BTC's range that has been refusing to take a side.
A good RRR trade that's sure to make you a bit of money. Use proper risk and money management (risk what you're willing to not get bothered by) and most especially, do your own analysis for extra confluence !.
Fri 21st Feb 2025 BTC/USD Daily Forex Chart Buy SetupGood morning fellow traders. On my Daily Forex charts using the High Probability & Divergence trading methods from my books, I have identified a new trade setup this morning. As usual, you can read my notes on the chart for my thoughts on this setup. The trade being a BTC/USD Buy. Enjoy the day all. Cheers. Jim

BTCUSD - Centerline Profit-Target in reachIt's not that far anymore.
Price is trickling down it's path.
I could imagine that near the confluence point, where the 1/4 line and the red Centerline meet, the PTG could be fulfilled.
However, a crack of the red U-MLH would generate a signal for a pullback up to the white Centerline.

$BTC.D and $DXY are in diametrically opposite directionsIn this blog space we have been discussing Bitcoin Dominance ( CRYPTOCAP:BTC.D ) since Dec 2024. On 9th Feb 2025 I posted a blog where we discussed the Fib Retracement levels in CRYPTOCAP:BTC.D chart and we said that we can expect more upside and has broken past 0.618. I said it is possible that the dominance can reach the 0.786 Fib level at 66.12%.
I tried to plot the Dollar index TVC:DXY in the same weekly chart as CRYPTOCAP:BTC.D and it was quite surprising that the FIB retracement levels in CRYPTOCAP:BTC.D are the same as the top to the bottom levels in the TVC:DXY chart. We are looking at the last 5 years for our analysis.
When CRYPTOCAP:BTC.D has broken past 0.618 Fib level and trying to reach 0.786 @66.12%. But the TVC:DXY has broken below 0.786 and in the near term the TVC:DXY level can end up at 0.618 Fib levels which can take TVC:DXY to 104.
So, in the near to medium term is CRYPTOCAP:BTC.D @ 66.12% and TVC:DXY @ 104.

BTCUSDBTC/USD is showing a potential buy opportunity following a breakout of the downward trend on the 30-minute timeframe. This breakout signals a possible shift in momentum toward the upside.
Trade Setup:
🟢 Buy Entry: 96,000
🔴 Stop Loss: 94,900 (Below key support to manage risk)
Target Levels:
✅ Target 1: 97,100
✅ Target 2: 97,800
✅ Target 3: 98,500
Risk Management:
⚠️ Always use a stop loss to protect capital in case of unexpected reversals.
📊 Risk-to-reward should be at least 1:2 or 1:3 for optimal trade setups.
💰 Avoid overleveraging—proper position sizing ensures account sustainability.
👀 Monitor price action closely, and adjust stop-loss levels as the trade moves in profit.
If BTC/USD holds above 96,000, bullish momentum could drive prices toward the targets. However, patience and confirmation from price action are key before entering the trade.

BTC's next market trendHello traders
The price is consolidating between 100096 and 96700, indicating a potential upward move toward 100096. If the price breaks above this level with strong momentum and volume, it is likely to continue rising toward 102360, where it may enter the bullish zone. Further bullish movement could push the price toward 106961, where it might face stronger resistance. The ascending trendline and recent bullish attempts suggest that buyers are trying to gain control, supporting the bullish outlook.
If the price fails to break 100096 and reverses, it may retest the lower support at 96700. A confirmed bearish trend will start if the price drops below 96700 and exits the ascending channel, leading to further downside movement. In that case, possible support levels to watch are 93723 and 91579, where buyers might attempt to regain control.
Traders, if you find this analysis helpful or have your own insights, drop a comment below! I’d love to hear your thoughts.

BTC is setting up nicely for the weakend Btc is forming a descending triangle that i think will bounce here... but for how long... i see upside potential to just before 100k i think bears will front run 100k and 99,8xx is about the highest we see before we get a flush this weekend... i really believe we see 89k in the not too distant future.. but as i always say... you can only chart until the next move so i will wait for the rejection at 100k and reasses my thought and trade plan...
Always stick to your trade plan and follow best trading practices(why did you get into this trade, is your idea still valid, where are you cutting losses, where are you taking profits) all of these factors should be know at least to you before you enter the trade.
Capital preservation is always the #1 key to making money.... Stay Green
