BTCUSD trading idea is ready ✅✅Hi Traders BTCUSD price is ready to fly
BTCUSD currently experiencing worldwide
Up trend has reached its highest price ever
I predict that the market will bounce back
From the resistance level move towards the Nearby support level
BTCUSD BUY FROM 66324
TARGET ZONE. 70307
If this post is useful for you
You can support me with like
And advice comments
Btcusdshort

BITCOIN WITH CUP SHAPE !!! HELLO TRADERS !!!
As i can BTC is just completed our last given target as we had mention in our previous buying setups which is attached with current chart in comment sessions friends it had created a technical pattern which is cup shape as we can see technically it had created a double top and now rejecting from that resistance zone we are expecting it to complete a cup shape now before starting a new Bull run fundamentally Gray-scale ETF approved as we saw a pump and dump in GBTC in volume & price too SEC Chairman says on 12th Jan that Bitcoin is a highly speculative volatile asset used for illicit activity. at that time markets make a dump from 49K to 41.4K also those investors who bought near 17K 20K 25K cash out at resistence level but as we are always following both Technical + Fundamental always bring to us a great experience in markets ... so we follow to the given TPs its just an trade idea kindly share ur thoughts with us it help alote to other traders we appreciate Ur love and support Stay Tuned for more updates ..

Bitcoin Analysis: Facing Key Decision ZoneAs seen in previous analyses, we have reached and broken the target ($67,000). We are now operating in a pivotal zone that could either continue selling and break the rectangle from the bottom towards $63,000, or break it from the top and rise back to $67,000, which has now become a resistance zone after previously serving as support.
As indicated by technical analysis, clarity will emerge after this brief pause, especially as the new day's opening candle approaches, revealing who will dominate this challenging zone.
I wish you success in your decision-making and finding the right place at the right time, and I hope this analysis proves helpful to all.

Decrypting Bitcoin: Insights from a Financial ExpertIn the fast-paced world of finance, few assets have captured the imagination and sparked as much debate as Bitcoin. As a seasoned financial expert, exploring the intricacies of this digital currency unveils a narrative brimming with innovation, volatility, and transformative potential.
Bitcoin's Genesis:
Born out of the aftermath of the 2008 financial crisis, Bitcoin represents a radical departure from traditional monetary systems. Its decentralized nature, underpinned by blockchain technology, challenges the status quo of centralized banking and heralds a new era of digital finance. With a fixed supply and transparent ledger, Bitcoin offers a glimpse into a future where trust is decentralized and censorship-resistant.
The Rise of Digital Gold:
In an era plagued by economic uncertainty and fiat currency debasement, Bitcoin has emerged as a digital counterpart to gold. Its properties as a scarce, fungible, and portable asset have attracted the attention of institutional investors and retail enthusiasts alike. With a growing recognition as a store of value and a hedge against inflation, Bitcoin's ascent from obscurity to prominence underscores its disruptive potential within the financial landscape.
Navigating Market Volatility:
Despite its growing adoption and mainstream acceptance, Bitcoin remains susceptible to bouts of extreme volatility. Price fluctuations, fueled by market sentiment and regulatory developments, are characteristic of an emerging asset class navigating uncharted waters. However, for astute investors, volatility presents opportunities for profit and portfolio diversification, provided they possess a robust risk management strategy.
Democratizing Finance:
Beyond its role as a speculative asset, Bitcoin holds the promise of democratizing finance and fostering financial inclusion. By circumventing traditional banking infrastructure, Bitcoin provides individuals in underserved regions with access to a global financial network. Moreover, its open-source ethos has spurred innovation, giving rise to a burgeoning ecosystem of decentralized applications and financial services.
Harnessing the Potential:
As financial professionals grapple with the complexities of digital asset management, Bitcoin offers a compelling avenue for portfolio diversification and risk mitigation. Whether embraced as a long-term investment or utilized for speculative trading, Bitcoin's asymmetric risk-reward profile presents opportunities for savvy investors to capitalize on market inefficiencies and emerging trends.
In conclusion, the evolution of Bitcoin represents a convergence of finance, technology, and socio-economic change. As a financial expert, deciphering the intricacies of Bitcoin unveils a narrative marked by disruption, innovation, and transformative potential. Amidst the flux of market dynamics, Bitcoin stands as a testament to the power of decentralized finance and the democratization of wealth creation.

Btcusd Bitcoin (BTC) is recognised as the world's first truly digitalised digital currency (also known as a cryptocurrency). The Bitcoin price is prone to volatile swings; making it historically popular for traders to speculate on. Follow the live Bitcoin price using the real-time chart, and read the latest Bitcoin news and forecasts to plan your trades using fundamental and technical analysis.
Bitcoin Price (BTC) Real-Time Live Price
Bitcoin News: Read the Latest Analysis on BTC
Confirm btcusd signal

$BTCUSD - Short again at 69500 for the best gainsEverything is in the chart but lets review my take.
Leaving wolfewave pattern aside, we were in an ascending triangle which broke down, uncommon but not rare sighting. Bulls were hoping it to break out but if I have learned anything from Bitcoin, it works against all odds.
So we broke down and now bulls are trying really hard to get back inside it, which will make this triangle completely invalid and we may see 71-72k once again.
On the flip side, if 69500 is not penetrated in next 4-8 hours, then we will retrace back as bulls will lose the steam and Asian markets will take over which is typically selling off things, and if Friday US market is in bad shape then bulls will turn bears to retest under 60k in coming week.

I think the price will decreaseReference order
Entry point 65574
manage command 66209
stop loss 66662
Manage order 64667 closing 70% of volume
target 64110

btcusd Bitcoin (BTC) is recognised as the world's first truly digitalised digital currency (also known as a cryptocurrency). The Bitcoin price is prone to volatile swings; making it historically popular for traders to speculate on. Follow the live Bitcoin price using the real-time chart, and read the latest Bitcoin news and forecasts to plan your trades using fundamental and technical analysis.
Bitcoin (BTC) price directional bias is on the balance as it sits atop a critical support for the second day in a row. The pioneer cryptocurrency reacted to the speech of Federal Reserve chair Jerome Powell with an abysmal move that lasted only briefly before falling back to its initial lull.
btcusd sell confirm signal

Btcusd sell confirm signal Bitcoin (BTC) is recognised as the world's first truly digitalised digital currency (also known as a cryptocurrency). The Bitcoin price is prone to volatile swings; making it historically popular for traders to speculate on. Follow the live Bitcoin price using the real-time chart, and read the latest Bitcoin news and forecasts to plan your trades using fundamental and technical analysis.
Btcusd sell now 65487
Target 62460
Confirm Chart

BTCUSD next move traders BTCUSD price is ready to fly
My dear subscribers
My technical analysis is for BTCUSD FLY
The price is coming around a solid key
Level 66518
Target zone 70587
Bis_ Bullish
Technical indicators Pivot point low
anticipates a potential price reversal
Super trend shows a clear buy giving a
Perfect indicators convergence perfect
Indicators convergence
Give us like and comments support us

btcusdBitcoin (BTC) is recognised as the world's first truly digitalised digital currency (also known as a cryptocurrency). The Bitcoin price is prone to volatile swings; making it historically popular for traders to speculate on. Follow the live Bitcoin price using the real-time chart, and read the latest Bitcoin news and forecasts to plan your trades using fundamental and technical analysis.
btcusd now sell 68763
targat 65453

Maybe 13k & we start see upside to 80kHey traders & investors
we all know that we are in recession and Bitcoin flowing the stock market not like before. so my prediction for next year is clear and i hope im right .
i will be happy to discuss this idea with you just leave a comment with your opinion .
Thank you
Remember this is not a financel advice .

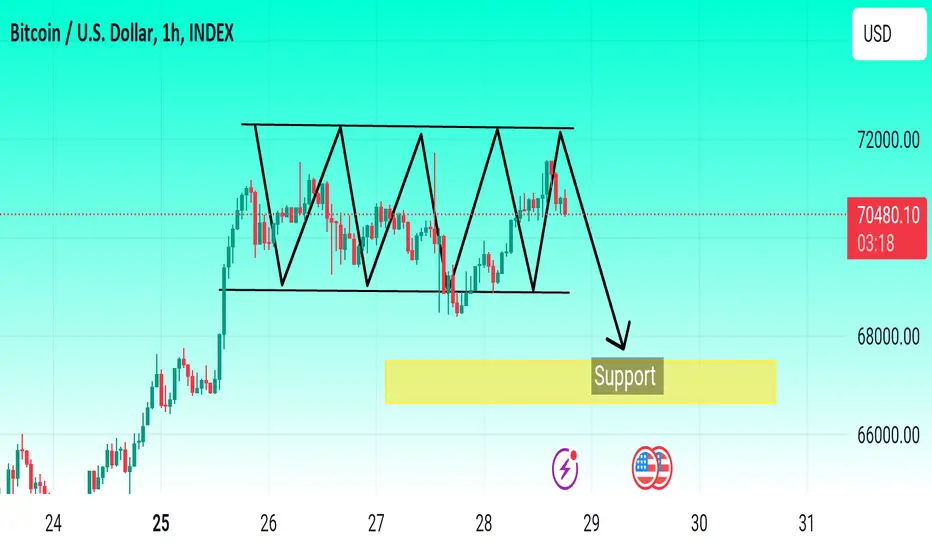
BTCUSD DOUBLE TOP SELL Here on BTCUSD price has formed a double top meaning more seller are entrying the market so going for SHORT is expected and targeting profits should be around a 65699 and also use money management

Btcusd Bitcoin Price (BTC) Real-Time Live Price
Bitcoin (BTC) is recognised as the world's first truly digitalised digital currency (also known as a cryptocurrency). The Bitcoin price is prone to volatile swings; making it historically popular for traders to speculate on. Follow the live Bitcoin price using the real-time chart, and read the latest Bitcoin news and forecasts to plan your trades using fundamental and technical analysis.
Btcusd sell 70400
Target 68000
Resistance 71400
btcusd sell signal
Bitcoin (BTC) is recognised as the world's first truly digitalised digital currency (also known as a cryptocurrency). The Bitcoin price is prone to volatile swings; making it historically popular for traders to speculate on. Follow the live Bitcoin price using the real-time chart, and read the latest Bitcoin news and forecasts to plan your trades using fundamental and technical analysis.
Bitcoin Price (BTC) Real-Time Live Price
Bitcoin has rallied by around 12% since Sunday’s opening print as demand for the largest cryptocurrency by market cap continues to increase prices. A technical, bullish, break of a short-term descending channel now suggests that Bitcoin will attempt to make a fresh record high in the near-term and likely ahead of next month’s halving event. Any pullbacks will find initial support around SWB:69K before just under FWB:65K comes into focus. The Average True Range (ATR) reading is at a multi-month high, while the CCI indicator shows Bitcoin nearing overbought territory. The chart set-up suggests Bitcoin will move higher over the coming days but a short-term turn lower cannot be discounted. confirm btcusd sell signal

BTCUSD Trading idea Hi Traders BTCUSD price is ready to fly
BTCUSD is currently experiencing a worldwide
Up trend and has reached its highest price ever
I predict that the market will bounce back
From the resistance level move towards the Nearby support level
BTCUSD Trade From 89824
Target zone. 76324
Give us like and advice comments

Btcusd sell confirm signal Bitcoin (BTC) is recognised as the world's first truly digitalised digital currency (also known as a cryptocurrency). The Bitcoin price is prone to volatile swings; making it historically popular for traders to speculate on. Follow the live Bitcoin price using the real-time chart, and read the latest Bitcoin news and forecasts to plan your trades using fundamental and technical analysis.
Confirm signal

BTCUSDT:Mainly short-selling at high positions, long with cautio
The large-level trend has turned bearish. Try to focus on high-altitude trading, and be cautious when going long.
Judging from the current trend, the resistance is mainly concentrated around 68000 and the support is around 64000. Trade around this range first. If it falls below 64000, you can make a small rebound. Don’t be too greedy when trading. Close the order in time when there is a profit.
The rebound resistance will be concentrated in the 64000-65000 range.

BTCUSD:Head and shoulders, short
The head is composed of a double top. The current form is closer to the head and shoulders . Once confirmed, the market will inevitably fall sharply, so my trading view is to go short as much as possible. The important resistance is 66,000, the support is around 58,000, and the target is 53,000-52,000.
This is a large trading space that requires sufficient trading funds and patience. If you have such conditions, you can follow my strategy and the probability of profit is about 90%.

BITCOIN head and shoulders and correction ❌❗Hello 🐋
based on the chart the price shaping head and shoulders pattern if we lose these the current support area we suppose it as a sign for correction ✔️📚
so we can see
correction to the downside, at least close to 60k is our main target ❌🧨
then
we can see more gain ✔🚀
👌 Attention: Take note of the price in the condensed chart (positioned below the primary chart in black).
📖💡 Feel free to express your perspective by commenting below. Thanks! 🐋

btc short to 59317Bitcoin broke the earlier trendline that i draw, since then im bearish. my next target is the big daily wick on the trendline that also comes together with 50 ema(yellow line)

btcusd sell Bitcoin (BTC) is recognised as the world's first truly digitalised digital currency (also known as a cryptocurrency). The Bitcoin price is prone to volatile swings; making it historically popular for traders to speculate on. Follow the live Bitcoin price using the real-time chart, and read the latest Bitcoin news and forecasts to plan your trades using fundamental and technical analysis.
Bitcoin (BTC) and Ethereum (ETH) Rally Further – Where to Next?
While ETF demand remains the prominent driver of Bitcoin activity, the markets continue to price in next month's BTC halving event where mining rewards will be slashed by 50%. The ongoing demand-new supply mismatch (demand outstripping supply) continues to underpin the move higher. Any short-term sell-off, normally attributed to leveraged longs bailing, is normally bought back on the same day, highlighting and reinforcing the strength of the recent move higher. While demand for spot Bitcoin ETFs may weaken, the supply-side dynamic will keep BTC moving higher over the weeks ahead.

BTCUSD - Top Down AnalysisStarting with the 1 hour timeframe, price-action is currently trading in a wedge formation below the 200 Simple Moving Average (SMA) RSI is also below 50 suggesting that bears are currently stronger.
Let's take a look at the 4hr.
With the 4hr timeframe we can get a better view of the wedge. RSI is below 50, and it appears price action wants to pullback to the 200 SMA.
Lastly let's take a look at the daily, the timeframe that really matters the most.
This timeframe convinces me that price action is likely to drop back down to the ascending trendline. However I believe on another retest, that ascending TL very well could break is we get strong bearish momentum. If PA breaks the ascending TL, expect 50k to be the next level of support in the days/weeks ahead.
That's it - That's all
Trade Safe
