BTCUSD short-term view.It is a good opportunity to sell BTCUSD in real time. Short-term is based on the right side of the swing trading, with a target of 93000-92500. In addition, the uncertainty of the news on BTCUSD. It is a good time to sell now.
Btcusdshort

BTCUSD Daily Trend Analysis from May 05, 2025Based on my analysis, BTCUSD is likely to experience a bearish trend over the next four trading days. A sell signal has been confirmed, with a stop-loss set at 97,939. Key support levels to watch are 83,974 and 80,491 — the latter becoming relevant only if the price breaks and closes below 83,974.
Please note: this is a personal market outlook and not a trading recommendation. Traders should rely on real-time technical analysis and implement appropriate risk management practices before making any trading decisions.

BTCUSDTLooks like BTCUSDT wants to make us smile again 🙂 A new opportunity for a Sell signal has emerged, and I’ll be taking advantage of it. However, don’t forget that in 35 minutes**, the *U.S. Services Purchasing Managers' Index (PMI)* data will be released — and that could cause some market volatility. I’m opening the trade with that in mind, so make sure you adjust your risk accordingly.
🔍 Criteria:
✔️ Timeframe: 15M
✔️ Risk-to-Reward Ratio: 1:1.60
✔️ Trade Direction: Sell
✔️ Entry Price: 94333.33
✔️ Take Profit: 93908.54
✔️ Stop Loss: 94598.39
🔔 Disclaimer: This is not financial advice. It's a trade I’m taking based on my own system, shared purely for educational purposes.
📌 If you're also interested in systematic and data-driven trading strategies:
💡 Don’t forget to follow the page and subscribe to stay updated on future analyses."

BTCUSDT Take ProfitHave I ever told you how much I love BTC? 😄 Yes! Our BTCUSDT trade has hit Take Profit!

BTCUSDTHello everyone! The downtrend in BTCUSDT continues with strong volume. Since May 3rd, the bearish trend has remained intact, and the current delta rate stands at -45%.
This indicates that the downward momentum is likely to continue for a while.
Therefore, I’m planning to open a short position on BTCUSDT.
You can find the entry, exit, and TP levels below.
🔍 Criteria:
✔️ Timeframe: 15M
✔️ Risk-to-Reward Ratio: 1:1.50
✔️ Trade Direction: Sell
✔️ Entry Price: 94586.48
✔️ Take Profit: 94113.32
✔️ Stop Loss: 94902.08
🔔 Disclaimer: This is not financial advice. It's a trade I’m taking based on my own system, shared purely for educational purposes.
📌 If you're also interested in systematic and data-driven trading strategies:
💡 Don’t forget to follow the page and subscribe to stay updated on future analyses.

Trading suggestions for BTCTwo days ago, I accurately predicted that the price of BTC would break through 97,500! 🚀
Currently, BTC is finding it difficult to break through the resistance level of 98,000 ⚠️. Given the current situation, it is recommended to decisively adopt a short-selling strategy at a high price level 📉.
⚡⚡⚡ BTCUSD ⚡⚡⚡
🚀 Sell@97500
🚀 TP 96000 - 95000 - 94000
Accurate signals are updated every day 📈 If you encounter any problems during trading, these signals can serve as your reliable guide 🧭 Feel free to refer to them! I sincerely hope they'll be of great help to you 🌟

Sell@97500, TP 96000 - 95000 - 94000🎉 Yesterday, I accurately predicted that the price of BTC would break through 97,000! 🚀 Now, a pullback is on the horizon ⬇️. Keep an eye on the support level at 93,000! 👀
⚡⚡⚡ BTCUSD ⚡⚡⚡
🚀 Sell@97500
🚀 TP 96000 - 95000 - 94000
Accurate signals are updated every day 📈 If you encounter any problems during trading, these signals can serve as your reliable guide 🧭 Feel free to refer to them! I sincerely hope they'll be of great help to you 🌟

BTCUSDTI’ve cancelled this trade. The new setup will be the one I’m sharing now. 🔄📉
A potential short signal is forming on BTCUSDT. However, it's not ideal to open the sell position right now — we need to wait for the price to reach a specific level. Once it does, we can execute the trade.
So, what are the entry, TP, and SL levels for this setup?
If you’ve just started following me, let’s get started!
🔍 Criteria:
✔️ Timeframe: 15M
✔️ Risk-to-Reward Ratio: 1:1.50 / 2
✔️ Trade Direction: Sell
✔️ Entry Price: 95652.05
✔️ Take Profit: 95300.05
✔️ Stop Loss: 95827.73
🔔 Disclaimer: This is not financial advice. It's a trade I’m taking based on my own system, shared purely for educational purposes.
📌 If you're also interested in systematic and data-driven trading strategies:
💡 Don’t forget to follow the page and subscribe to stay updated on future analyses.

BTCUSDTHello traders! A potential short signal is forming on BTCUSDT. However, it's not ideal to open the sell position right now — we need to wait for the price to reach a specific level. Once it does, we can execute the trade.
So, what are the entry, TP, and SL levels for this setup?
If you’ve just started following me, let’s get started!
🔍 Criteria:
✔️ Timeframe: 15M
✔️ Risk-to-Reward Ratio: 1:1.50 / 2
✔️ Trade Direction: Sell
✔️ Entry Price: 95828.00
✔️ Take Profit: 95507.18
✔️ Stop Loss: 95988.00
🔔 Disclaimer: This is not financial advice. It's a trade I’m taking based on my own system, shared purely for educational purposes.
📌 If you're also interested in systematic and data-driven trading strategies:
💡 Don’t forget to follow the page and subscribe to stay updated on future analyses.

Entry and exit strategy for Bitcoin pt3Hello again, I know that some of you are not in favour of Pi Cycle Top Indicator or even RSI but seems like there is too many signals at once indicating intermediate TOP in the price of Bitcoin!
According to MACD etc. this price pullback may be... brutal and will scare many, many early investors! I see price moving down to 40k or even lower so, either you HODL or sell now and re-buy when the price will be closer to support levels - two scenarios visible on the plot. In the long term perspective, we are in the middle of a bull run (according to many Glassnode indicators) so, don't let this pullback shake you off!
Entry and exit strategy for Bitcoin pt2 - Pi Cycle Top crossed, published early April
Entry and exit strategy for Bitcoin pt1 - first RSI bubble is exactly at the point of dotted line, published in late February

Bitcoin to 61k ?Follow up on my weekly idea.
There is potential sell on the 4 hour chart
Bitcoin is just below a weekly resistance and at the 4 hour resistance
Stop loss: 98500
Take profit: Around 61 k

Bitcoin BTC Has Started CorrectionHello, Skyrexians!
Hope we understood what is going to happen with the Bitcoin dominance, if briefly we are waiting for correction and this dominance dump will likely happen on BINANCE:BTCUSDT dump.
Let's take a look at the impulse which has been started at $75k, it looks like this impulse has been finished already with the 5 Elliott waves cycle. At the very top we can see the bearish divergent bar and bearish divergence with the Awesome Oscillator. Moreover oscillator started to print red columns, it means that momentum is gone and now it's time to go down.
Best regards,
Ivan Skyrexio
___________________________________________________________
Please, boost this article and subscribe our page if you like analysis!

The decisive day of major data (BTCUSD)Yesterday, it was mentioned that the expectation of continuing to buy after a retracement of 96k was completely correct. Followers also made good profits.
BTCUSD bulls are still strong. The retracement is mainly long trading, which needs to be paid attention to at present. 96k/95k are both good buying opportunities.
TP98K-100K

Can BTCUSD continue to be purchased? The answer is definitely.Can BTCUSD continue to be purchased? The answer is definitely.
The current trend is a rebound trend after a volatile decline. The space for a short-term increase of 1,500 points is very simple. The target position is 94,700-95,200. Friends who like to do short-term swing trading can follow.

Buy@9500096000: This represents the resistance level adjacent to the upper trend-line of the current ascending wedge. The price has repeatedly probed this zone but hasn't managed to achieve a decisive breakthrough, underscoring significant selling pressure at this crucial juncture 💥.
97500: It stands as a more elevated resistance milestone. Should the price powerfully breach the 96000 resistance barrier and sustain its upward momentum, it could potentially challenge this level 🎯.
⚡⚡⚡ BTCUSD ⚡⚡⚡
🚀 Buy@95000
🚀 TP 96000 - 97000
Accurate signals are updated every day 📈 If you encounter any problems during trading, these signals can serve as your reliable guide 🧭 Feel free to refer to them! I sincerely hope they'll be of great help to you 🌟

Bitcoin Repeating 2022 Structure? Same Setup, Same Outcome?Bitcoin’s current market structure is starting to mirror its 2022 setup—right before the big drop.
This chart shows a familiar pattern: a rally, a peak, first drop from the ATH, a bull trap… then the major second leg down.
If history repeats, CRYPTOCAP:BTC could be on the verge of another significant move.
Will it break the cycle this time—or follow the same path again?
📉 What do you think?
Share your take in the comments below.
Please support this idea with a LIKE👍 if you find it useful🥳
Happy Trading💰🥳🤗

Buy@92000 - 93000 TP 95000 - 96000 - 9700096000: This is the resistance level near the upper trend - line of the current ascending wedge. The price has tested this area several times but failed to break through effectively, indicating strong selling pressure at this level 💥.
97500: It is a higher - level resistance target. If the price can strongly break through the 96000 resistance level and continue to rise, it may test this level 🎯.
⚡⚡⚡ BTCUSD ⚡⚡⚡
🚀 Buy@92000 - 93000
🚀 TP 95000 - 96000 - 97000
Accurate signals are updated every day 📈 If you encounter any problems during trading, these signals can serve as your reliable guide 🧭 Feel free to refer to them! I sincerely hope they'll be of great help to you 🌟

BTC will ever go 100k?
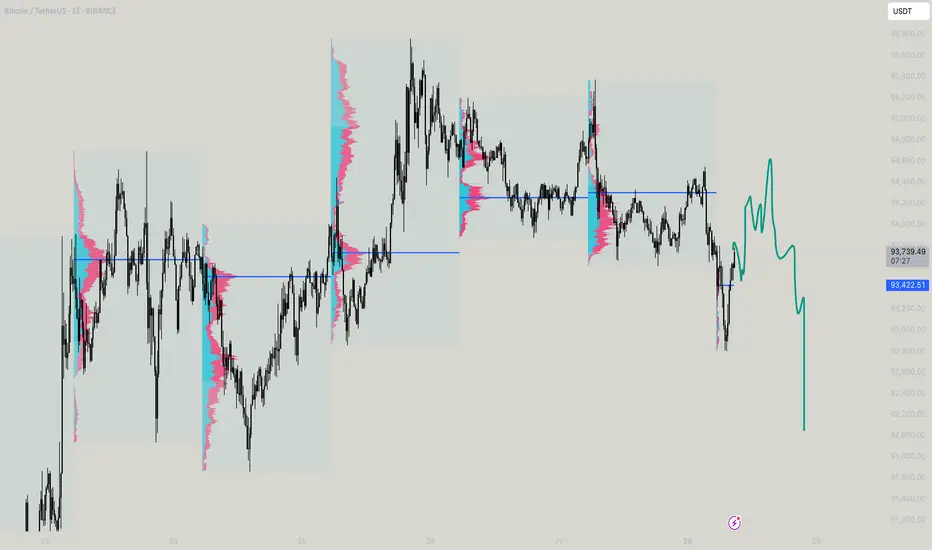
The immediate structure shows aggressive selling pressure — big thin volume zones (where there is less historical volume) are visible between $93,200 and $92,700. If BTC cannot reclaim and close strongly back above $93,900–$94,100 (preferably closing inside the old VA), the path of least resistance remains downward toward $92,500 first and even $91,700–$91,500 eventually.
In simple words: as long as BTC stays under $93,900, the market is favoring shorts, not longs. Quick bounces can happen, but they are more likely to get sold off unless a very strong reclaim happens. Bulls need to urgently push back above $94,100 to reattempt upside momentum, otherwise downside expansions toward lower value zones remain active.
TL:DR - Observe!
BTCUSD BEARISHMy calculations find that this asset, will indeed drop to the indicated price in coming days or weeks. This move will be overwhelmingly bearish.

BTCUSD 4 - Hour Chart Market AnalysisBTCUSD 4 - Hour Chart Market Analysis
I. Trends and Patterns 📈
Looking at the 4 - hour chart, the recent performance of BTCUSD has been characterized by complex fluctuations. In the earlier stage, there was a consolidation phase where the price oscillated within a relatively narrow range, forming a roughly rectangular consolidation pattern 📊. During this period, the forces of bulls and bears were relatively balanced 🤝, and the market was in a wait - and - see mode 🕵️. Subsequently, the price broke above this consolidation range and moved upward, indicating that the bulls had taken the upper hand 🐂, driving the price to gradually climb ⬆️.
Currently, the price is in an ascending wedge pattern, a common technical pattern. An ascending wedge is generally regarded as a reversal pattern. In an uptrend, although the price continues to reach new highs, the upward slope gradually flattens, suggesting that the bullish momentum is weakening while the bearish momentum is accumulating 🐻.
II. Key Support and Resistance Levels 📌
Support Levels
93000: This is a crucial support level, located near the lower trend - line of the ascending wedge and also a key low point during previous pullbacks. If the price moves downward, this level is likely to provide strong support. A break below this level may trigger further declines ⚠️.
91500: It is the upper edge of the previous consolidation range. If the price experiences a significant drop, this level may prevent the price from falling further sharply 🛑.
86000: It is the lower edge of the previous consolidation range. If the price continues to decline, this will be an important support line. A break below it may open up a larger downside space 📉.
Resistance Levels
96000: This is the resistance level near the upper trend - line of the current ascending wedge. The price has tested this area several times but failed to break through effectively, indicating strong selling pressure at this level 💥.
97500: It is a higher - level resistance target. If the price can strongly break through the 96000 resistance level and continue to rise, it may test this level 🎯.
⚡⚡⚡ BTCUSD ⚡⚡⚡
🚀 Sell@95000 - 94500
🚀 TP 93000 - 92000
🚀 Buy@92000 - 93000
🚀 TP 95000 - 96000
Accurate signals are updated every day 📈 If you encounter any problems during trading, these signals can serve as your reliable guide 🧭 Feel free to refer to them! I sincerely hope they'll be of great help to you 🌟

BTCUSD 4 - hour Chart AnalysisBTCUSD 4 - hour Chart Analysis
I. Trend Judgment
From the 4 - hour chart, BTCUSD is on an upward trend, consolidating at relatively high levels. Despite price fluctuations, bulls are still in control to some extent 🐂.
II. Key Levels
Support Area: The 90,000 - 91,500 range is a key support zone. The price has rebounded here multiple times, suggesting strong buying interest. If it drops back, it could be a buying opportunity 📈. 86,000 and 83,000 are additional lower - level supports.
Resistance Area: 95,000 is the resistance area. The price has faced hurdles here. If bullish momentum strengthens, breaking this could open up more upside 🚀.
III. Trading Strategies
Long - position Strategy: When the price retreats to the 90,000 - 91,500 support area and a bullish candlestick shows up, consider going long. Place stop - loss below the support and aim for 95,000. If broken, higher levels may follow 💰.
Short - position Strategy: Near 95,000, if a bearish candlestick appears with rising volume, try a small short position. Set stop - loss above resistance and target 91,500 - 90,000 ⬇️.
⚡⚡⚡ BTCUSD ⚡⚡⚡
🚀 Sell@95000 - 94000
🚀 TP 92000 - 91000
🚀 Buy@91000 - 92000
🚀 TP 94000 - 95000
Accurate signals are updated every day 📈 If you encounter any problems during trading, these signals can serve as your reliable guide 🧭 Feel free to refer to them! I sincerely hope they'll be of great help to you 🌟

BTC may drop back to 90,000 pointsBTC is likely to pull back to around 90,000 points before starting to rebound.
In terms of capital flow, the upward momentum of XAU/USD has been temporarily halted ⏸️, and a large amount of capital is rapidly flowing into the virtual currency market 💸! As the leader of virtual currencies, Bitcoin has undoubtedly become an important destination for capital inflows 🌟. The injection of a large amount of capital has directly driven a significant surge in the price of BTC 📈. Capital chases profits just like water flows 🌊. Against the backdrop of the phased adjustment in the gold market, Bitcoin, with its unique technological attributes and market vitality, has attracted the attention of many investors, laying a solid capital foundation for its subsequent price increase 🏗️.
At the macro policy level, Trump's remarks have had a strong impact on the financial market 😲! His change in attitude towards Fed Chairman Powell has triggered the reallocation of market funds 🔄. When he previously threatened to remove Powell, investors' concerns about the Fed's policy intensified, and they flocked to the gold market for hedging, pushing up the gold price 🚀. However, Trump's latest statement that he will not fire Powell and his call for interest rate cuts have alleviated some of the investors' anxiety, prompting funds to flow back into US dollar - denominated assets 📉. It should be noted that during this process, some of the funds withdrawn from the gold market have not fully returned to traditional US dollar assets but have flowed into the virtual currency field such as Bitcoin 💥. As an emerging digital asset, Bitcoin has both certain hedging and speculative attributes, and has become a new safe haven and value - added target for funds 💰.
In international trade, Trump has shown signs of easing in the trade negotiations with China and is trying to reach an agreement quickly to reduce tariffs (although not to zero) 🤝. The past uncertainty in trade relations was one of the important factors driving up the gold price ⚠️. With the expected easing of trade tensions, potential future trade easing measures may suppress the market demand for gold as a safe haven asset ⏳. In contrast, the Bitcoin market is less directly affected by trade policies. Instead, due to its characteristics such as decentralization and global circulation 🌐, it has gained more favor during the process of capital reallocation. When the attractiveness of traditional safe haven assets declines, the scarcity and innovation of Bitcoin make it a new choice for investors to diversify risks and pursue returns 🎯, further stimulating the market demand for BTC 📈.
⚡⚡⚡ BTCUSD ⚡⚡⚡
🚀 Sell@92000 - 92500
🚀 TP 91000 - 90000
The market has been extremely volatile lately 📈📉 If you can't figure out the market's direction, you'll only be a cash dispenser for others 💰

BTC | FAKE REVERSAL - Here's WhyI'm not convinced of the recent "bullish" price action. In fact, I say it's likely the calm before the next bearish move down.
In a downtrend, there are a few tale tell signs that the price has gone into full bear mode . In this video, I discuss two of them.
Make sure you catch up on ALTCOINS, and their ideal buying zones HERE 👀👇
__________________
BINANCE:BTCUSDT
