BTC/USD Short Setup – Triple Top Reversal with EMA Confirmation Entry Point (Sell): Around $85,699.52
Stop Loss: $86,741.44 (above resistance zone)
Target (Take Profit): $82,982.09
This provides a Risk-Reward Ratio of approximately 1:2, a commonly acceptable ratio in trading.
📈 Indicators:
EMA 30 (Red) is currently above the EMA 200 (Blue), indicating bullish momentum—but this setup anticipates a trend reversal.
If price breaks below the EMAs, that would confirm bearish strength.
🧠 Conclusion:
This setup is based on:
A strong resistance zone,
Bearish reversal pattern (triple top),
Risk management via stop loss and take profit levels.
If you're trading this:
Wait for confirmation with a bearish candlestick below the EMAs or a break of recent support.
Manage position size based on stop distance and your account risk tolerance.
Btcusdshort

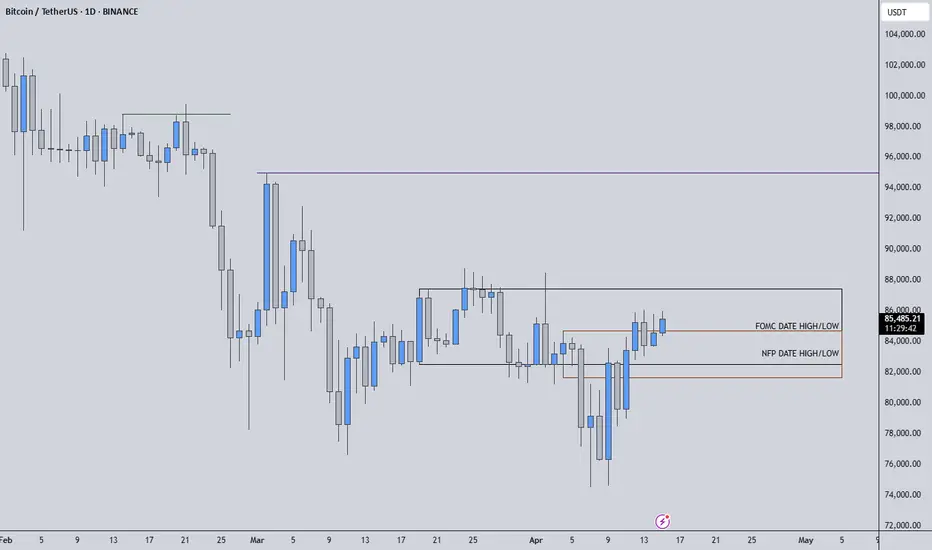
BTCUSDT | FOMC & NFP Highs and Lows as Critical Pivot LevelsThis current structure on Bitcoin is giving us a beautiful narrative rooted in macro timing: we've regained the NFP day levels, and now we’re trading right inside the highs and lows of the FOMC date—a zone that historically acts as a decision-making pivot for the market.
📍 Why These Levels Matter:
NFP and FOMC sessions are not just about volatility—they often define institutional positioning and sentiment shifts.
We’ve already regained NFP day's range, showing bullish resilience and strength.
Now all eyes are on the FOMC range: if we manage to break and retest the high of the FOMC candle, it can ignite momentum toward the monthly target.
🧠 How I’m Thinking About It:
I’m not jumping the gun. I’ll wait for lower time frame confirmations, ideally some clean breaks with supportive delta and CDV structure.
If we fail to hold these levels and fall back inside, I won’t insist on any long idea. I’ll flip short the moment downside momentum is confirmed.
💬 Final Thought: We don't randomly mark levels. These are deliberately chosen based on price behavior during major economic events—something most traders overlook. That’s what gives us the edge. If you're following me, you're not trading noise. You're learning to understand the story behind price action.
Watch these levels closely. They may be the starting point of something much bigger.
📌I keep my charts clean and simple because I believe clarity leads to better decisions.
📌My approach is built on years of experience and a solid track record. I don’t claim to know it all but I’m confident in my ability to spot high-probability setups.
📌If you would like to learn how to use the heatmap, cumulative volume delta and volume footprint techniques that I use below to determine very accurate demand regions, you can send me a private message. I help anyone who wants it completely free of charge.
🔑I have a long list of my proven technique below:
🎯 ZENUSDT.P: Patience & Profitability | %230 Reaction from the Sniper Entry
🐶 DOGEUSDT.P: Next Move
🎨 RENDERUSDT.P: Opportunity of the Month
💎 ETHUSDT.P: Where to Retrace
🟢 BNBUSDT.P: Potential Surge
📊 BTC Dominance: Reaction Zone
🌊 WAVESUSDT.P: Demand Zone Potential
🟣 UNIUSDT.P: Long-Term Trade
🔵 XRPUSDT.P: Entry Zones
🔗 LINKUSDT.P: Follow The River
📈 BTCUSDT.P: Two Key Demand Zones
🟩 POLUSDT: Bullish Momentum
🌟 PENDLEUSDT.P: Where Opportunity Meets Precision
🔥 BTCUSDT.P: Liquidation of Highly Leveraged Longs
🌊 SOLUSDT.P: SOL's Dip - Your Opportunity
🐸 1000PEPEUSDT.P: Prime Bounce Zone Unlocked
🚀 ETHUSDT.P: Set to Explode - Don't Miss This Game Changer
🤖 IQUSDT: Smart Plan
⚡️ PONDUSDT: A Trade Not Taken Is Better Than a Losing One
💼 STMXUSDT: 2 Buying Areas
🐢 TURBOUSDT: Buy Zones and Buyer Presence
🌍 ICPUSDT.P: Massive Upside Potential | Check the Trade Update For Seeing Results
🟠 IDEXUSDT: Spot Buy Area | %26 Profit if You Trade with MSB
📌 USUALUSDT: Buyers Are Active + %70 Profit in Total
🌟 FORTHUSDT: Sniper Entry +%26 Reaction
🐳 QKCUSDT: Sniper Entry +%57 Reaction
📊 BTC.D: Retest of Key Area Highly Likely
📊 XNOUSDT %80 Reaction with a Simple Blue Box!
📊 BELUSDT Amazing %120 Reaction!
I stopped adding to the list because it's kinda tiring to add 5-10 charts in every move but you can check my profile and see that it goes on..
Keep a close eye on the downward movement of BTC at all times.Today, BTC is in a sideways trend, with its price fluctuating in the range of 83,000 to 86,000. 📊
At present, there are no significant new developments in the area of tariffs. 👍
However, what we need to be vigilant about is that if the tariff situation deteriorates and triggers the market's safe - haven mechanism, a large amount of capital is highly likely to flow into the relatively stable gold and foreign exchange markets. 😟
This, in turn, could lead to a large - scale sell - off in the Bitcoin market. 💥
Therefore, it is recommended to consider short - selling at relatively high price points. 📉
The accuracy rate of our daily signals has remained above 98% throughout a month 📈! You are warmly welcome to follow us and join in on the success 🌟.
💰💰💰 BTCUSD 💰💰💰
🎯 Sell@84500 - 85500
🎯 TP 82500 - 81500
Traders, if you're fond of this perspective or have your own insights regarding it, feel free to share in the comments. I'm really looking forward to reading your thoughts! 🤗

btcusd on bearis reverse above 86170#BTCUSD on bearish above 86170, price needs to move above there before sell reverse will occur.
Above 86170 holds bearish reverse which will drop the coin below 84264, stop loss at 87300.
No possible bullish yet, unless the third pattern is broken.

At present, a selling phenomenon has emergedAt present, a selling phenomenon has emerged😰, and a large number of traders are waiting for the market to open⏰.
When other markets open on Monday, the situation of a large amount of capital flowing out to other trading fields also deserves attention. 😟
Especially the flows to the XAU/USD and USOIL markets, or other foreign exchange markets. 💱 The movement of funds to these areas might be influenced by economic news, geopolitical events, or simply portfolio re - balancing by investors. 📰
💰💰💰 BTCUSD 💰💰💰
💰💰💰 BTCUSD 💰💰💰
🎯 Sell@84000 - 84500
🎯 TP 82500 - 81500
Recently, the market has been extremely volatile 😱, which has led to the clearing of many traders' accounts or significant losses 😫. You can follow my signals and gradually recover your losses and achieve profitability 🌟💪.
Traders, if you're fond of this perspective or have your own insights regarding it, feel free to share in the comments. I'm really looking forward to reading your thoughts! 🤗

BTC Breakout or Bull Trap? Key Confirmation Levels Ahead
If you're leaning bullish, it's more prudent to wait for a confirmed breakout above 88,000, followed by a weekly close above the 86,000 level. Ideally, a successful retest should hold within the 85,000–86,000 range to validate the breakout structure. Any failure to hold this zone on the retest would likely signal a fake out which, given current price action and resistance pressure, remains a high-probability scenario in my view.
Bitcoin faced a sharp decline to the 75,000 level following the announcement of tariffs, which triggered panic and heightened uncertainty across the crypto market. Currently, BTC is attempting to reclaim the key 85,000 resistance zone. However, a descending trendline is capping upward momentum, adding to the difficulty of a clean breakout. A decisive weekly close above 86,000 could invalidate the bearish setup and open the door for bullish continuation till 100-108K. Conversely, failure to break and close above this level would likely lead to a swift drop toward the 71,000 support zone, with minimal structural support in between.
A weekly close below the 85,000 level would confirm bearish continuation, opening the door for a retest of the 72,000 support zone — a key structural level that previously acted as a demand area. Failure to hold above 72,000 could invalidate the current range and trigger a deeper correction toward the prior macro support around 55,000. Based on current momentum and price structure, a move toward the 55,000 region appears increasingly probable in the near term.

Tariff Shock Sends BTC to 75K — Can Bulls Reclaim 86K?Greetings...
Bitcoin faced a sharp decline to the 75,000 level following the announcement of tariffs, which triggered panic and heightened uncertainty across the crypto market. Currently, BTC is attempting to reclaim the key 85,000 resistance zone. However, a descending trendline is capping upward momentum, adding to the difficulty of a clean breakout. A decisive weekly close above 86,000 could invalidate the bearish setup and open the door for bullish continuation. Conversely, failure to break and close above this level would likely lead to a swift drop toward the 71,000 support zone, with minimal structural support in between.
A weekly close below the 85,000 level would confirm bearish continuation, opening the door for a retest of the 72,000 support zone — a key structural level that previously acted as a demand area. Failure to hold above 72,000 could invalidate the current range and trigger a deeper correction toward the prior macro support around 55,000. Based on current momentum and price structure, a move toward the 55,000 region appears increasingly probable in the near term.

Bitcoin (BTC/USD) Long Trade Setup – Breakout Strategy with TargCurrent Price: $80,724.28
Entry Point: $80,671.23 (just above current price)
Stop Loss: $78,052.44
Target Point: $88,573.60
Resistance Point: $82,260.90
📈 Trend & Moving Averages
EMA 30 (red): $80,220.87 — Short-term trend.
EMA 200 (blue): $80,788.61 — Long-term trend.
The price is currently between the EMAs, indicating potential indecision or a shift in trend. A break above both EMAs with momentum would confirm bullish strength.
🔑 Trade Setup Summary
Element Level
Entry 80,671.23
Stop Loss 78,052.44
Target (TP) 88,573.60
Resistance 82,260.90
Risk-Reward ~1:2.7 (approx)
📊 Analysis & Expectations
Bullish Bias: The chart suggests a long trade with a breakout strategy.
Volume and momentum confirmation will be key above resistance.
Resistance at 82,260.90 may cause a brief pullback before continuation to the target.
The stop loss is well-placed below a support zone and the most recent swing low.
✅ What to Watch For
Break and close above EMA 200 and resistance at 82.2K.
Bullish volume increase on breakout.
Price action around the entry zone (wait for confirmation candle if unsure).

BTC | BEARISH Cycle Begins | $71KThere are a few tell signs that BTC has entered the bearish market.
If the price fails to maintain closing daily candles ABOVE the 70k area, there is a likelihood for a nasty Head and Shoulders pattern to form.
A key point to watch are the Bollinger Bands, which gives you an indication of the next possible zone to watch.
_____________________
BINANCE:BTCUSDT

Bitcoin Sell to 73/72k ?There is a potential incoming sell on the 4 hour time frame.
Take profit around : 73/72 k
Stop loss: 85.6k
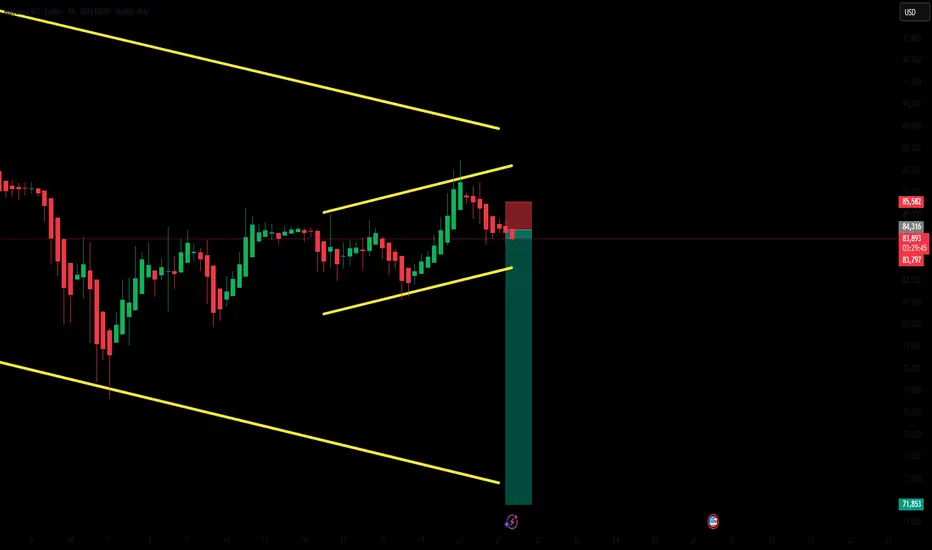
Short position openedI invest in Bitcoin, and don’t usually trade. However, I can see a pretty bearish setup unfolding.
Trade set up:
Entry price: 85341.66 (black line in 4H)
Stop loss: 87,962 (red line in 4H chart, just above the previous week high)
Target 1 - 80.971 (green line, previous week low and Fib 0.5 level in Daily chart)
Target 2 - 78, 253 (green line in 4H chart, previous month low, approx 50% encroachment zone of fair value gap in daily chart .
Reasons:
Weekly:
MACD is still in the bull territory but MACD lines are clearly moving to the downside.
The price has retraced to 50% of the massively bearish red candle of(March 3rd weekly candle) and now resuming to move to the downside.
Daily:
RSI and MACD are both in the bear territory and it looks like they are rolling back to the downside in the bear territory, which is pretty bearish.
The price has dropped and closed below the ascending trend line.
4H:
The price has been travelling inside the ascending parallel channel, but it is dropped and closed below the bottom line.
Both MACD and RSI are deep in the bear territory.

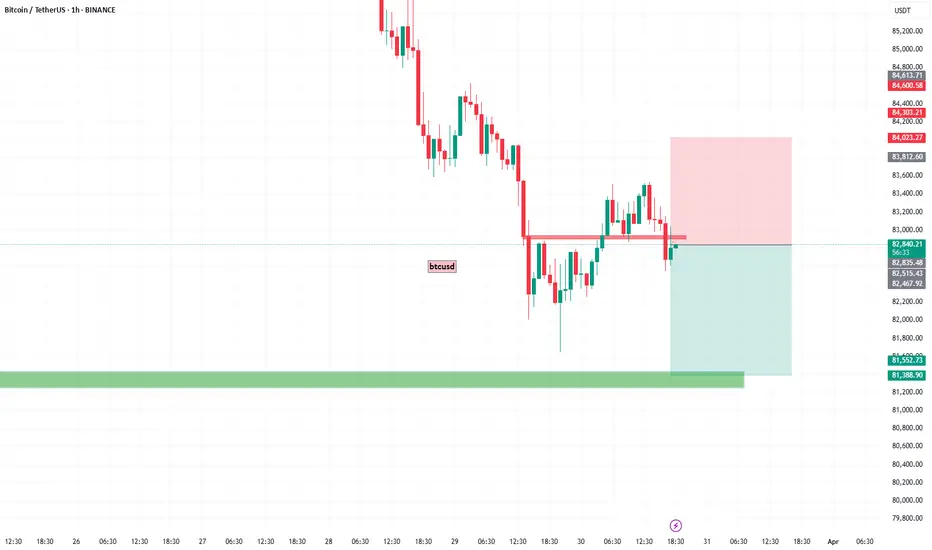
TC/USD Bearish Flag Breakdown Targeting 81,660 Support ZoneThis is a 1-hour BTC/USD (Bitcoin/US Dollar) chart showing a bearish setup. Here's the breakdown:
---
Key Observations:
1. Bearish Rejection Zone (Purple Box - ~83,174.62):
Price is showing rejection at a key resistance zone.
Both the 30 EMA and 200 EMA are above current price, adding downward pressure.
2. EMA Analysis:
30 EMA (Red Line): ~83,174.62 – acting as dynamic resistance.
200 EMA (Blue Line): ~83,715.92 – strong long-term resistance.
Price is below both EMAs, reinforcing bearish sentiment.
3. Pattern Analysis:
Bearish flag/wedge breakdown has already occurred.
Target projection based on measured move suggests a ~1.44% downside.
Anticipated drop towards 81,660.29, which aligns with prior support zone.
4. Price Action:
Recent breakdown from a small rising channel (bear flag).
Pullback to resistance (purple zone) seems complete, and continuation downward is expected.
---
Strategy Summary:
Bias: Bearish
Entry Zone: Near 83,174.62 (already rejected)
Target: 81,660.29
Stop Loss Idea: Above 83,715.92 (EMA 200)

Short The price is consolidating between 89,000 and 76,500 zone. But I can see another downward move to 76,500 is developing.
Where I drew blue rectangular blocks and red vertical lines in the chart (Feb and March 2025) are the very similar set up as the current situation as follows:
1) The market creates the set up where it looks like the price is slowly recovering and pushes above EMA200.
2) The reverses aggressively to the downside (liquidity sweep).
3) The price consolidates in the very tight range.
4) Momentum indicators move into the bear zone.
I already have one small short position, but once RSI and MACD enter the bear zone and the price stays below VWAP (purple line drawn from the August 24 low) and also closes below the buy order block (green box), I will open another short position.
Stop loss - above EMA 200 in 4H chart.
Target - 76,540

btcusd sell scalpingbtcusd sell scaliping
reason is 1hr support touch
so sell side passiblity high change

USDT Dominance Good for Bitcoin price actionHello everyone!
I want share my price analysis at USDT Dominance.
The reason i am making Bitcoin price action analysis at USDT Dominance is here chart is more clear and gives me better view of what is happening at market.
After Trump inauguration day most of retail traders excepted bullish bitcoin, but we saw strong sellers, that means bitcoin will find new strong buyer and it will reach new high then, but i think the new high will be maybe 2026 or 2027. if we will look at USDTD we will see the price action is still uptrend, but not too strong it tested well support after 1D double bottom and went higher.
my price prediction will be it will test 6.75 were it will get huge reaction, but the price will come back second time and we need to wait for that moment, if we will get same price reaction, it will be start of bullish bitcoin, at the moment i think bitcoin will be at 55000 or 60000, but if USDTD will brake 6.75 then we need to wait Bitcoin at 40000-45000.
We will see what will happen that's only my opinion it will happen.
Always make your own research

Bitcoin (BTC/USD) – Bearish Breakdown & Key Levels to WatchMarket Overview:
Bitcoin is trading at $84,185, showing a +1.63% increase. The price action suggests a potential breakout towards the upside.
🔹 Chart Structure:
BTC has been consolidating in a range-bound structure after a sharp upward move.
Previous rising wedge patterns led to corrections, but the price is holding key support levels.
A breakout setup is forming with a target towards $88,500 – $90,000.
🔹 Key Levels to Watch:
✅ Resistance: $85,249, $86,934, $88,500, $90,000
✅ Support: $82,000, $81,400
🔹 Potential Trade Setup:
📈 Bullish Scenario:
If BTC holds above $84,000, a push towards $86,500 – $88,500 is likely.
A breakout above $88,500 could lead to $90,000+.
📉 Bearish Scenario:
If BTC rejects $85,000, a pullback to $82,000 – $81,400 may occur before another move up.
🔹 Conclusion:
Bias: Bullish above $84,000
Target: $88,500 – $90,000
Invalidation: Below $81,400
Would you like a more detailed trade plan with stop-loss and entry points? 🚀

Bitcoin (BTC/USD) 4H Chart Analysis – Professional BreakdownBitcoin (BTC/USD) 4H Chart – Detailed Professional Analysis
This chart presents a Rectangle Pattern, a common consolidation structure in technical analysis. The price has been oscillating between a well-defined resistance level near $88,000 - $89,000 and a support level around $80,000 - $81,000. This pattern suggests an upcoming breakout, with bearish continuation being the most probable scenario.
Understanding the Rectangle Pattern
A rectangle pattern forms when price moves sideways, trapped between two horizontal levels. Traders watch for a breakout in either direction to determine the next trend. In this case, Bitcoin has tested the resistance multiple times but failed to break above, indicating strong selling pressure. Meanwhile, support has been retested several times, which weakens its strength over time.
A bearish breakdown is likely because:
Buyers appear unable to push past resistance, showing exhaustion.
Support has been tested multiple times, which increases the chance of a breakdown.
The dotted black trendline is now being tested, and a break below it would further confirm bearish momentum.
Trade Setup for a Breakdown
A short trade becomes valid only if Bitcoin breaks below the $81,000 - $82,000 support zone with strong momentum. The price must close below this level to confirm the move.
How to Enter the Trade?
Look for a strong bearish candle close below the $81,000 - $82,000 range.
If Bitcoin retests this broken support (now acting as resistance), this can be a secondary short entry point.
Once confirmation is seen, open a short position.
Stop Loss Placement
To protect against false breakouts, a stop loss should be set above the $88,457 resistance zone. If the price moves back into the rectangle and surpasses this level, it means the bearish setup is no longer valid.
Profit Target and Trade Expectation
The expected take profit target is $73,541. This is calculated using the measured move projection, meaning the height of the rectangle is subtracted from the breakdown point. If Bitcoin reaches this level, the trade will have successfully captured the bearish momentum.
Market Psychology Behind This Move
The repeated failure to break above resistance ($88,000 - $89,000) signals weak buying interest. Buyers have been stepping in at support, but each retest of the $80,000 - $81,000 zone makes it more vulnerable.
Once support finally breaks, several factors will accelerate the move:
Long positions will be forced to sell, increasing selling pressure.
Breakout traders will enter new short positions, pushing price further down.
Liquidity below support will be triggered, causing Bitcoin to fall sharply toward the $73,541 target.
Invalidation Scenario (Bullish Case)
If Bitcoin breaks above $88,000 - $89,000 and holds, the bearish setup becomes invalid. In that case:
The price would shift into a bullish continuation pattern.
Traders should avoid shorting and instead look for buying opportunities above resistance.
Final Thoughts
This is a high-probability bearish setup, but patience is key—wait for confirmation before entering.
Risk management is crucial : The stop loss at $88,457 ensures that losses are minimized if the market moves against the trade.
If Bitcoin remains inside the rectangle, traders can buy at support and sell at resistance until a breakout occurs.

BTCUSD hourly trend analysis for April 04, 2025It is in a bearish trend. Sell signal has confirmed the Stop Loss at 83382. This pair has a strong support at 82074 and 80900.

Bitcoin (BTC/USD) Rectangle Pattern Breakdown – Bearish Move1. Overview of the Chart & Market Context
The chart provided represents Bitcoin (BTC/USD) on the 1-hour timeframe, published on TradingView. This analysis highlights the rectangle pattern formation, key support and resistance levels, and a potential short trade setup with defined risk management.
The market structure suggests a bearish outlook, as Bitcoin attempted to break above a resistance level but failed, leading to a sharp decline. The price action now indicates further downside movement, aligning with a rectangle pattern breakdown.
2. Rectangle Pattern Formation
What is a Rectangle Pattern?
A rectangle pattern is a consolidation phase where price moves sideways within a defined range, forming multiple touches at resistance and support before a breakout occurs. It can serve as a continuation or reversal pattern, depending on the breakout direction.
In this case, the pattern has resulted in a bearish breakout, indicating that sellers have taken control of the market.
Key Characteristics of This Rectangle Pattern:
The upper boundary (resistance) is at 88,333 USD, where price repeatedly failed to break higher.
The lower boundary (support) is at 78,044 USD, which acted as a strong floor but is now under pressure.
The price moved within this range for an extended period, showing a balanced battle between buyers and sellers.
A failed breakout at resistance, followed by a sharp rejection, signals a bearish reversal.
3. Breakdown of Key Levels & Market Structure
A. Resistance Level – 88,333 USD
This level has been tested multiple times, but price failed to hold above it.
The recent failed breakout led to a strong bearish rejection, confirming resistance.
The price action formed a bearish engulfing candlestick, adding to the bearish bias.
B. Support Level – 78,044 USD
This zone has previously provided multiple bounces, showing strong buying interest.
However, with the recent break below this level, it may now act as resistance.
If the price retests this area and fails to break above, it confirms a bearish continuation.
C. Price Rejection and Market Structure Shift
The formation of lower highs and lower lows signals a transition from consolidation to a downtrend.
The price broke out of the rectangle pattern to the downside, confirming a bearish breakout.
If the support at 78,044 USD fails, the price may continue dropping toward 73,678 USD.
4. Trade Setup & Execution Plan
🔹 Entry Strategy
A short position is initiated after the bearish rejection at resistance (88,333 USD).
The breakdown of the rectangle pattern strengthens the short setup.
The price may briefly retest the broken support (78,044 USD) before continuing downward.
🔹 Stop-Loss Placement
The stop-loss (SL) is placed above 88,333 USD, ensuring that if price moves against the trade, risk is minimized.
This protects against any unexpected bullish reversal.
🔹 Profit Targets (Take Profit - TP)
TP1: 78,044 USD (previous support level) – A conservative target.
TP2: 73,678 USD (deeper support) – If bearish momentum continues, this is the extended target.
Trade Component Details
Entry Short after rejection at 88,333 USD
Stop-Loss (SL) Above 88,333 USD
Take Profit 1 (TP1) 78,044 USD
Take Profit 2 (TP2) 73,678 USD
Confirmation Breakout & retest of support
Risk-Reward Ratio Favorable (defined SL & TP)
5. Expected Price Action and Market Behavior
🔻 Bearish Scenario (Most Likely Outcome)
The price will continue to fall towards TP1 (78,044 USD) due to selling pressure.
If 78,044 USD fails to hold, Bitcoin is likely to test the next major support level (73,678 USD).
The structure of lower highs and lower lows supports the downtrend.
🔺 Bullish Scenario (Invalidation of the Short Setup)
If Bitcoin breaks above 88,333 USD, the bearish outlook is invalidated.
This could signal a potential trend reversal or bullish breakout.
6. Technical Indicators Supporting the Analysis
Several technical indicators can be used to confirm the bearish outlook:
📉 RSI (Relative Strength Index):
If RSI is below 50, it confirms bearish momentum.
If RSI is oversold (<30), a temporary bounce may occur.
📉 Moving Averages:
If the 50-period MA crosses below the 200-period MA, it confirms a bearish trend.
If price is below both MAs, it strengthens the bearish setup.
📉 Volume Analysis:
A high selling volume during the breakdown indicates strong bearish conviction.
If volume spikes near support levels, a potential bounce could happen.
7. Summary of Key Findings
Pattern Identified: Rectangle pattern with a bearish breakout.
Market Structure: Price formed lower highs and lower lows, signaling a downtrend.
Trade Setup:
Short trade after rejection at 88,333 USD.
Stop-loss above 88,333 USD to manage risk.
Profit targets at 78,044 USD (TP1) and 73,678 USD (TP2).
Risk Management:
Clear stop-loss and take-profit levels ensure a controlled risk-to-reward ratio.
If price moves against the trade, the stop-loss prevents excessive losses.
Technical Indicators:
RSI, Moving Averages, and Volume Analysis confirm the bearish outlook.
8. Final Thoughts & Trading Plan Implementation
This analysis presents a high-probability bearish trade setup using the rectangle pattern breakdown strategy. With proper risk management, traders can execute this short trade with a structured plan.
🔹 Actionable Trading Plan:
Wait for price confirmation – If BTC retests the broken support (78,044 USD) and rejects, this strengthens the trade idea.
Execute the short trade – Once confirmation occurs, enter a short position.
Manage risk appropriately – Stick to the stop-loss above 88,333 USD.
Monitor price action – Adjust take-profit levels based on momentum and support breaks.
If the price invalidates the setup by breaking above resistance, it is crucial to exit the trade and re-evaluate the market conditions.
Conclusion:
This Bitcoin (BTC/USD) rectangle pattern breakdown analysis provides a clear bearish trade setup, supported by market structure, technical indicators, and price action. The well-defined entry, stop-loss, and take-profit levels ensure a structured risk-reward ratio, making this a viable short trade opportunity.

BTCUSD Trading StrategyBTCUSD has experienced a significant decline. While the indicators have yet to show signs of stabilization or a trend reversal, the price action on the candlestick chart indicates that there is support in the range of 82,000-80,000. Therefore, I believe it is an opportune moment to position for a long trade within this range, exercising patience as we await a price rebound to achieve the TP1/TP2 targets.

BTCUSD hourly chart projection till April 03, 2025BTCUSD looks bearish with the given Support and Resistance levels. Once the Dynamic Signal confirms the sell entry with stop loss and targets, that makes the best point to enter into the trade.

BTCUSDT SELL/ SHORTBy utilizing Fibonacci retracement levels, historical patterns, , we can formulate a hypothesis that the market might follow a similar trajectory if bearish sentiment prevails.
Bitcoin (BTC/USD) Breakdown – Rising Wedge Signals Further Drop!1. Chart Overview
This 4-hour BTC/USD chart from BITSTAMP presents a well-defined Rising Wedge pattern, which is a bearish reversal structure typically signaling an upcoming price decline. After a strong upward movement, Bitcoin formed a wedge pattern with higher highs and higher lows converging. This indicates weakening bullish momentum, leading to a confirmed breakdown.
2. Key Technical Elements & Market Structure
A. Rising Wedge Formation (Bearish Pattern)
A rising wedge is a bearish reversal pattern that appears after an uptrend, showing gradually weakening buying pressure.
The chart shows that price action was following an upward sloping support and resistance trendline.
The higher highs and higher lows formed within the wedge indicate a loss of bullish momentum.
Eventually, the price broke below the lower trendline, confirming a bearish breakdown.
B. Breakdown Confirmation
A decisive bearish candle broke below the wedge's lower trendline, confirming the downward move.
After breaking down, the price attempted a small retest of the wedge’s support, which has now turned into resistance.
This successful rejection from the previous support adds to the bearish confirmation.
C. Support & Resistance Levels
Resistance Level ($88,547):
This zone acted as a strong supply area, where previous bullish moves were rejected.
If BTC/USD attempts to recover, this area may provide selling opportunities.
Support Level ($79,193):
This is the next downside target, aligned with previous price consolidation zones.
A break below this support could trigger further selling pressure.
3. Trading Setup & Strategy
A. Short Trade Setup
Entry Point: After BTC/USD confirmed the breakdown of the rising wedge.
Stop Loss: Placed slightly above the $88,547 resistance level to limit risk.
Target Price: A decline towards $79,193, which aligns with the previous major support zone.
B. Bearish Market Sentiment
BTC/USD is currently trading below the wedge, reinforcing bearish bias.
A successful retest of the broken wedge support would validate further downside continuation.
If price remains below the $85,000 level, sellers are likely to maintain control.
4. Market Outlook & Next Price Action
Bearish Scenario
If BTC fails to reclaim the wedge breakdown level, further downside is expected.
A breakdown below $80,000 psychological level could increase selling momentum toward $75,000-$77,000 levels.
Volume analysis suggests that selling pressure is increasing.
Bullish Scenario (Invalidation)
If BTC/USD reclaims the $88,547 resistance and closes above it, the bearish bias could weaken.
Bulls need to break above the rising wedge resistance trendline for a reversal.
5. Conclusion & Trading Plan
The Rising Wedge pattern breakdown confirms a bearish outlook for BTC/USD.
The risk-reward ratio for a short trade is favorable, targeting a move down to $79,193.
Traders should watch for volume confirmation and trend continuation signals before entering.
Key Takeaways
✅ Bearish Bias confirmed after the Rising Wedge breakdown.
✅ Short Position setup with entry, stop loss, and target defined.
✅ Resistance at $88,547 - Failure to break above it strengthens the bearish case.
✅ Target at $79,193 - A strong support area where buyers may step in.
6. Tags for TradingView Post
#BTC #Bitcoin #Crypto #TradingSetup #TechnicalAnalysis #CryptoTrading #BearishPattern #RisingWedge #Breakdown #ShortTrade #PriceAction #SupportResistance #MarketAnalysis
Would you like any further refinements or additional insights? 🚀
