BTCUSDPair : BTCUSD ( Bitcoin / U.S Dollar )
Description :
Falling Wedge as an Corrective Pattern in Long Time Frame
Completed " 12345 " Impulsive Waves and Corrective Waves " wxyxz "
Break of Structure
RSI - Divergence
Bullish Channel in Short Time Frame
Btcusdsignal

Btcusd signal Bitcoin (BTC) is recognised as the world's first truly digitalised digital currency (also known as a cryptocurrency). The Bitcoin price is prone to volatile swings; making it historically popular for traders to speculate on. Follow the live Bitcoin price using the real-time chart, and read the latest Bitcoin news and forecasts to plan your trades using fundamental and technical analysis.
Confirm btcusd signal

btcusd shortBitcoin (BTC) is recognised as the world's first truly digitalised digital currency (also known as a cryptocurrency). The Bitcoin price is prone to volatile swings; making it historically popular for traders to speculate on. Follow the live Bitcoin price using the real-time chart, and read the latest Bitcoin news and forecasts to plan your trades using fundamental and technical analysis.
confirm signal

btcusd long signalBitcoin (BTC) is recognised as the world's first truly digitalised digital currency (also known as a cryptocurrency). The Bitcoin price is prone to volatile swings; making it historically popular for traders to speculate on. Follow the live Bitcoin price using the real-time chart, and read the latest Bitcoin news and forecasts to plan your trades using fundamental and technical analysis.
Bitcoin Price (BTC) Real-Time Live Price
btcusd confirm long signal

Btcusd signal Bitcoin (BTC) is recognised as the world's first truly digitalised digital currency (also known as a cryptocurrency). The Bitcoin price is prone to volatile swings; making it historically popular for traders to speculate on. Follow the live Bitcoin price using the real-time chart, and read the latest Bitcoin news and forecasts to plan your trades using fundamental and technical analysis.
Btcusd confirm signal buy

Btcusd signal Bitcoin Price (BTC) Real-Time Live Price
Bitcoin (BTC) is recognised as the world's first truly digitalised digital currency (also known as a cryptocurrency). The Bitcoin price is prone to volatile swings; making it historically popular for traders to speculate on. Follow the live Bitcoin price using the real-time chart, and read the latest Bitcoin news and forecasts to plan your trades using fundamental and technical analysis.
Btcusd signal buy confirm Target

Btcusd signal Bitcoin (BTC) is recognised as the world's first truly digitalised digital currency (also known as a cryptocurrency). The Bitcoin price is prone to volatile swings; making it historically popular for traders to speculate on. Follow the live Bitcoin price using the real-time chart, and read the latest Bitcoin news and forecasts to plan your trades using fundamental and technical analysis.
Confirm Chart

Btcusd shortBitcoin (BTC) is recognised as the world's first truly digitalised digital currency (also known as a cryptocurrency). The Bitcoin price is prone to volatile swings; making it historically popular for traders to speculate on. Follow the live Bitcoin price using the real-time chart, and read the latest Bitcoin news and forecasts to plan your trades using fundamental and technical analysis.
Bitcoin Price (BTC) Real-Time Live Price
Bitcoin News: Read the Latest Analysis on BTC
btcusd confirm signal buy

BTCUSD 1DBTC ~ 1D Updated
#BTC, For now #Bitcoin Has Important Support at $60,000. This support needs to be maintained to keep the price from falling any further, apart from that CRYPTOCAP:BTC also has Classic Support Ema100 at a price of $58K+

BTCUSD Analysis (13th April 2024)Crypto Analysis (13th April 2024)
BTCUSD Analysis
On the Daily Timeframe, Price action has created a Huge dump due to the 800+ Million Liquidation across multiple different exchanges. Nothing fundamental changed about BTC just yet. Just the usual happenings in the crpyto space.
Price has reached a daily orderblock and has shown strong rejections from that key area and closed the daily with a strong bottom wick indicating rejections.
There are 2 scenarios i see playout.
1) Price has just flipped the new daily candle after creating another huge bottom wick, Buys from here at 67602 is possible to come up to fill the clean candle on the left caused by the sell off. I want to see at least 69252 be tapped.
2) Price fails to hold, breaking the bullish daily orderblock at $64572. Once we see a body candle closure below that level, Sells are alot more likely to occur and i will look for a break and retest set up for shorts to target $60,000.

Btcusd signal Bitcoin (BTC) is recognised as the world's first truly digitalised digital currency (also known as a cryptocurrency). The Bitcoin price is prone to volatile swings; making it historically popular for traders to speculate on. Follow the live Bitcoin price using the real-time chart, and read the latest Bitcoin news and forecasts to plan your trades using fundamental and technical analysis.
Bitcoin Price (BTC) Real-Time Live Price
Confirm Chart btcusd signal

Btcusd Bitcoin (BTC) hit $72,650 on Monday, the highest level in almost four weeks and liquidating $55.72 million in short positions, according to Coinglass data. The 4% daily increase comes about 10 days away from the Bitcoin halving.
Bitcoin (BTC) is recognised as the world's first truly digitalised digital currency (also known as a cryptocurrency). The Bitcoin price is prone to volatile swings; making it historically popular for traders to speculate on. Follow the live Bitcoin price using the real-time chart, and read the latest Bitcoin news and forecasts to plan your trades using fundamental and technical analysis.
Confirm Chart

btcusd confirm chartBitcoin (BTC) is recognised as the world's first truly digitalised digital currency (also known as a cryptocurrency). The Bitcoin price is prone to volatile swings; making it historically popular for traders to speculate on. Follow the live Bitcoin price using the real-time chart, and read the latest Bitcoin news and forecasts to plan your trades using fundamental and technical analysis.
Bitcoin price action for the past three weeks has been confusing for sidelined participants. On the one hand, investors are ignoring BTC and trading altcoins, and on the other hand, traders are expecting a potential dip.
btcusd confirm signal

Btcusd Bitcoin (BTC) is recognised as the world's first truly digitalised digital currency (also known as a cryptocurrency). The Bitcoin price is prone to volatile swings; making it historically popular for traders to speculate on. Follow the live Bitcoin price using the real-time chart, and read the latest Bitcoin news and forecasts to plan your trades using fundamental and technical analysis.
Bitcoin Price (BTC) Real-Time Live Price
Bitcoin News: Read the Latest Analysis on BTC
Confirm btcusd signal

btcusd Bitcoin (BTC) is recognised as the world's first truly digitalised digital currency (also known as a cryptocurrency). The Bitcoin price is prone to volatile swings; making it historically popular for traders to speculate on. Follow the live Bitcoin price using the real-time chart, and read the latest Bitcoin news and forecasts to plan your trades using fundamental and technical analysis.
Bitcoin (BTC) price directional bias is on the balance as it sits atop a critical support for the second day in a row. The pioneer cryptocurrency reacted to the speech of Federal Reserve chair Jerome Powell with an abysmal move that lasted only briefly before falling back to its initial lull.
btcusd sell confirm signal

Btcusd sell confirm signal Bitcoin (BTC) is recognised as the world's first truly digitalised digital currency (also known as a cryptocurrency). The Bitcoin price is prone to volatile swings; making it historically popular for traders to speculate on. Follow the live Bitcoin price using the real-time chart, and read the latest Bitcoin news and forecasts to plan your trades using fundamental and technical analysis.
Btcusd sell now 65487
Target 62460
Confirm Chart

Btcusd weekly chartBitcoin Weekly Forecast: BTC looks set for correction amid increasing sell signals
Bitcoin price hovers around the 2021 ATH of $69,138 after a 65% year-to-date returns. The Momentum Reversal Indicator (MRI)’s warning sell signal of a down yellow arrow hovers above the ongoing weekly candlestick. This technical formation suggests that the next up candlestick would flash a red ‘one’ sell signal. This signal, from a theoretical perspective, forecasts a one-to-four down candlesticks.
Bitcoin (BTC) price action remains unchanged as it trades below the 2021 ATH for the fourth consecutive week. With Grayscale’s ETF outflows slowing down, investors expect a positive outlook for the crypto markets, but the short-term directional bias, at least from a technical perspective, remains bearish for BTC.

btcusd chart long Bitcoin (BTC) is recognised as the world's first truly digitalised digital currency (also known as a cryptocurrency). The Bitcoin price is prone to volatile swings; making it historically popular for traders to speculate on. Follow the live Bitcoin price using the real-time chart, and read the latest Bitcoin news and forecasts to plan your trades using fundamental and technical analysis.
btcusd sell 69640
target 65233
confirm signal btcusd sell

Btcusd Bitcoin Price (BTC) Real-Time Live Price
Bitcoin (BTC) is recognised as the world's first truly digitalised digital currency (also known as a cryptocurrency). The Bitcoin price is prone to volatile swings; making it historically popular for traders to speculate on. Follow the live Bitcoin price using the real-time chart, and read the latest Bitcoin news and forecasts to plan your trades using fundamental and technical analysis.
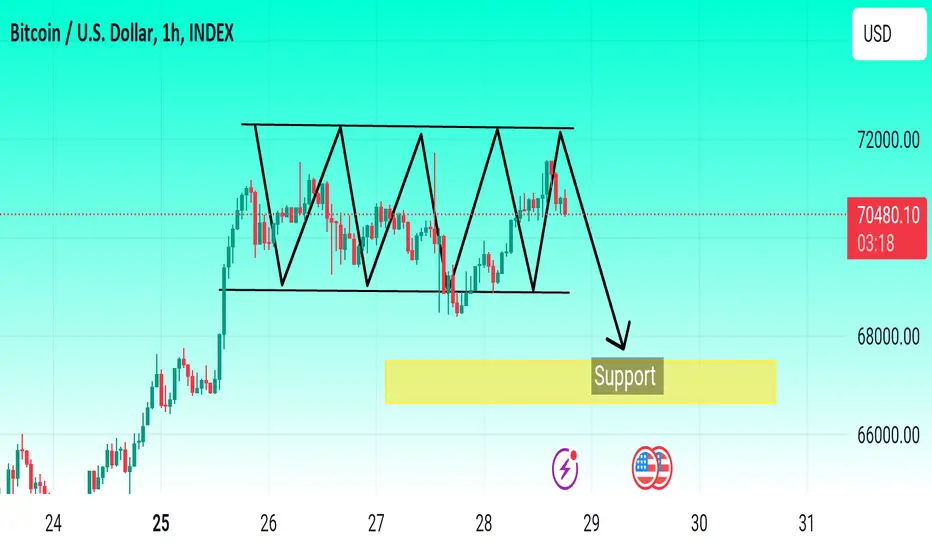
Btcusd sell 70400
Target 68000
Resistance 71400
Btcusd sell confirm signal Bitcoin (BTC) is recognised as the world's first truly digitalised digital currency (also known as a cryptocurrency). The Bitcoin price is prone to volatile swings; making it historically popular for traders to speculate on. Follow the live Bitcoin price using the real-time chart, and read the latest Bitcoin news and forecasts to plan your trades using fundamental and technical analysis.
Confirm signal

btcusd sell confirm signalBitcoin (BTC) is recognised as the world's first truly digitalised digital currency (also known as a cryptocurrency). The Bitcoin price is prone to volatile swings; making it historically popular for traders to speculate on. Follow the live Bitcoin price using the real-time chart, and read the latest Bitcoin news and forecasts to plan your trades using fundamental and technical analysis.

Btcusd Bitcoin (BTC) is recognised as the world's first truly digitalised digital currency (also known as a cryptocurrency). The Bitcoin price is prone to volatile swings; making it historically popular for traders to speculate on. Follow the live Bitcoin price using the real-time chart, and read the latest Bitcoin news and forecasts to plan your trades using fundamental and technical analysis.

Btcusd sell Bitcoin (BTC) is recognised as the world’s first truly digitalised digital currency (also known as a cryptocurrency). The Bitcoin price is prone to volatile swings; making it historically popular for traders to speculate on. Follow the live Bitcoin price using the real-time chart, and read the latest Bitcoin news and forecasts to plan your trades using fundamental and technical analysis.
Btcusd sell confirm signal
