Bitcoin - The cycles are playing out!⚔️Bitcoin ( CRYPTO:BTCUSD ) just repeats another cycle:
🔎Analysis summary:
Following all of the previous all time high breakouts, Bitcoin will now further extend the rally. After some simple calculation, we can see that Bitcoin will rally another +50% in order to reach the overall price target. However there will be volatility along the way so make sure to remain calm.
📝Levels to watch:
$200.000
SwingTraderPhil
SwingTrading.Simplified. | Investing.Simplified. | #LONGTERMVISION
Btcusdsignals

BITCOIN Is this just a giant Bull Flag?Bitcoin (BTCUSD) is basically on its first strong pull-back since the July 14 All Time High (ATH), as it is the 3rd straight red day going from roughly $120300 to below $115000 as of this moment.
Technically this Channel Down pull-back looks like a Bull Flag to the uptrend that started following the June 22 Low. The 1D RSI pattern is similar to the May 22 - 30 fractal, which was also a correction that started after a Channel Up and initially hit the 1D MA50 (blue trend-line), only to rebound a settle for a last dip lower closer to the 1D MA200 (orange trend-line).
If the 1D MA50 fails to contain the current correction, we may again be faced with a slightly more prolonged pull-back, which may be translated into an Accumulation Phase that could eventually lead to prices above $130000 by September.
Do you think that will be the case or we will see an instant rebound? Feel free to let us know in the comments section below!
-------------------------------------------------------------------------------
** Please LIKE 👍, FOLLOW ✅, SHARE 🙌 and COMMENT ✍ if you enjoy this idea! Also share your ideas and charts in the comments section below! This is best way to keep it relevant, support us, keep the content here free and allow the idea to reach as many people as possible. **
-------------------------------------------------------------------------------
💸💸💸💸💸💸
👇 👇 👇 👇 👇 👇

BTCUSD Daily Analysis – Golden Pocket Hold Before a Bullish?🧠 Chart Description & Market Structure:
The BTCUSD daily chart is showing a consolidation phase after forming a local high near $123,231. Currently, the price is retracing and approaching a key Fibonacci retracement zone between the 0.5 level ($115,557) and 0.618 level ($113,740) — also known as the Golden Pocket, which is often a strong reversal area.
---
📈 Bullish Scenario:
If the price holds within or just above the 0.5–0.618 Fibonacci zone (highlighted in yellow) and forms a bullish reversal candlestick (like a hammer, bullish engulfing, or pin bar), there’s a high probability for BTC to resume its uptrend.
Bullish upside targets include:
$119,842 as minor resistance.
$123,231 as the previous swing high and a key breakout confirmation.
A successful break above $123,231 could send BTC toward the next major targets around $128K–$132K.
---
📉 Bearish Scenario:
If the price fails to hold the 0.618 Fibonacci level ($113,740) and breaks down below the key psychological support at $111,500, a deeper correction may occur.
Downside targets:
$108K–$106K as the next major support zone.
A break below this could lead to the formation of a lower high structure and potentially trigger a bearish continuation.
---
📊 Pattern Observations:
Potential Bullish Flag or Rectangle Consolidation: The price action suggests horizontal consolidation after a strong rally — possibly a re-accumulation zone before a bullish continuation.
Golden Pocket Retest: Price is currently testing the Fibonacci 0.5–0.618 zone, often targeted by institutional buyers and technical traders as a potential entry point.
---
🧭 Key Levels to Watch:
Major Resistance: $123,231 (swing high)
Minor Resistance: $119,842
Fibonacci 0.5: $115,557
Fibonacci 0.618: $113,740
Key Support: $111,500
---
🔖 Conclusion:
BTC is currently in a decision zone. Price action within the $115,500–$113,700 range will be crucial. Will this be a healthy retracement before the next leg up — or the beginning of a deeper correction?
#BTCUSD #BitcoinAnalysis #CryptoTA #FibonacciRetracement #CryptoChart #BitcoinDaily #BullishSetup #BearishSetup #CryptoMarket

SHORT TERM BEARISH TARGETS ON THE H4 TIMEFRAME on THE BTCUSD, here are the downside target levels (short-term bearish targets) for BTC/USDT:
🎯 Target Levels:
1. Target Point 1:
112,000 USDT
This is a minor support zone where a temporary bounce or consolidation could occur.
It aligns with previous price action support and is near the lower Ichimoku edge.
2. Target Point 2:
106,000 USDT
This is a major support level near the lower boundary of the ascending channel.
If price breaks below Target 1 decisively, this becomes the high-probability target.

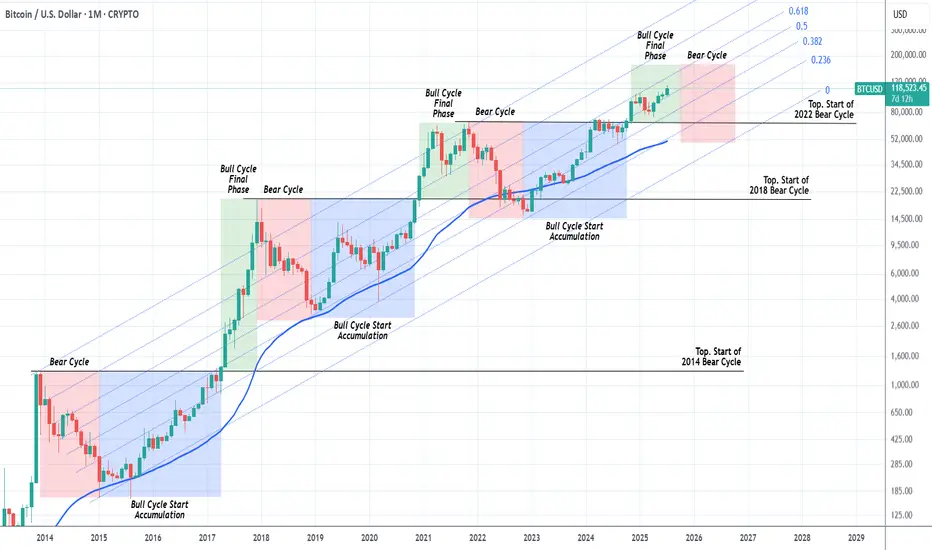
BITCOIN Should we start thinking about the next Bear Cycle yet?Bitcoin (BTCUSD) has had extremely symmetric (time-wise) Cycles in the past +10 years and this is a subject we've analyzed extensively many times. We've spent the last months projecting potential Targets for each stage of the bull run and only the last few are left.
This is exactly why we thought today's chart would be very fitting. The current Bull Cycle isn't over yet but also, based on the 4-year Cycle Theory, isn't far of either. By October 2025, that model suggests that all profit should have been taken.
As you can see, we are in the green zone, the Bull Cycle's Final Phase and since this Cycle has been trading entirely within the 0.236 - 0.618 Fibonacci Channel range, by October the price shouldn't be much higher than $160k.
In any event, this is a good guide, presented to you in a good time, to keep your mindset inside a long-term perspective and prepare you for not only the upcoming Top but also the next (1 year) Bear Cycle, which could again push the price below the 1M MA50 (blue trend-line), which would be a solid level for long-term buy positions again.
So do you think the Top is closer than it looks? Feel free to let us know in the comments section below!
-------------------------------------------------------------------------------
** Please LIKE 👍, FOLLOW ✅, SHARE 🙌 and COMMENT ✍ if you enjoy this idea! Also share your ideas and charts in the comments section below! This is best way to keep it relevant, support us, keep the content here free and allow the idea to reach as many people as possible. **
-------------------------------------------------------------------------------
💸💸💸💸💸💸
👇 👇 👇 👇 👇 👇
Bitcoin - Trust the higher timeframe!⚔️Bitcoin ( CRYPTO:BTCUSD ) is still 100% bullish:
🔎Analysis summary:
For the past couple of months we have been seeing an overall consolidation on Bitcoin. But looking at the higher timeframe, Bitcoin remains in an underlying strong bullrun. Consolidations are always expected and no reason to freak out since everything is still bullish.
📝Levels to watch:
$100.000
🙏🏻#LONGTERMVISION
Philip - Swing Trader

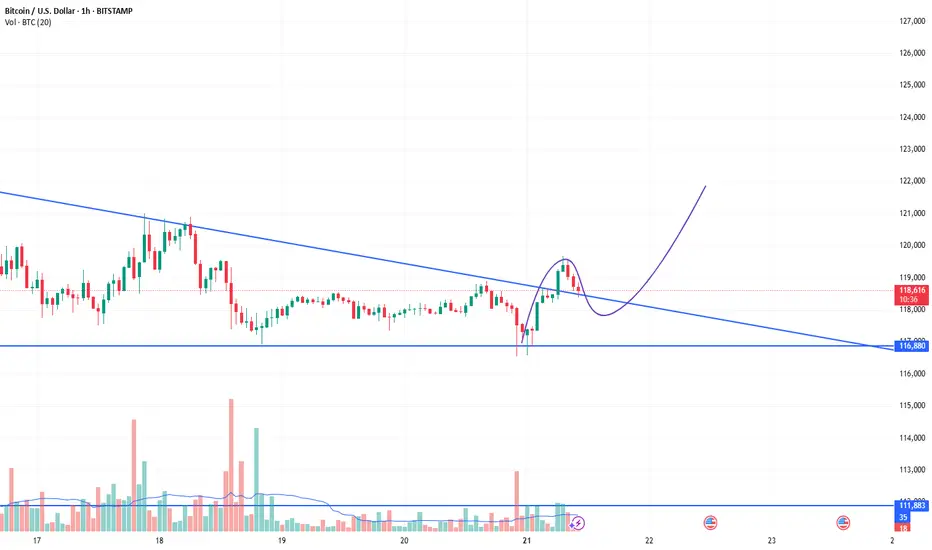
BTCUSD Analysis is Ready BTC/USD 30-min chart shows a potential bounce from the support zone around 116,187.5, aiming for a bullish move toward the target at 121,640.6. Price may retrace before pushing upward.

BITCOIN Former Resistance turned Support!Bitcoin (BTCUSD) is consolidating right above the December 17 2024 Pivot trend-line, a level that started off as a massive Resistance delivering two strong rejections but has now been turned into Support, holding this consolidation.
The 1D MA50 (blue trend-line) will soon cross this Pivot trend-line and will confirm it as a Support with the price technically looking for a new Bullish Leg towards the 1.5 Fibonacci extension at least ($138000), similar to the April - May uptrend, which also consisted of an Accumulation Phase much like the current.
Can the Pivot trend-line provide the necessary support for such a rebound? Feel free to let us know in the comments section below!
-------------------------------------------------------------------------------
** Please LIKE 👍, FOLLOW ✅, SHARE 🙌 and COMMENT ✍ if you enjoy this idea! Also share your ideas and charts in the comments section below! This is best way to keep it relevant, support us, keep the content here free and allow the idea to reach as many people as possible. **
-------------------------------------------------------------------------------
💸💸💸💸💸💸
👇 👇 👇 👇 👇 👇

Bitcoin - The cycle is just starting!⚔️Bitcoin ( CRYPTO:BTCUSD ) just created new highs:
🔎Analysis summary:
Bitcoin is currently - especially with the new all time high breakout - just perfectly following previous cycle behavior. Since there is no real resistance above current price, apart from psychological levels, I do expect a substantial rally back to the upper channel resistance trendline.
📝Levels to watch:
$300.000
🙏🏻#LONGTERMVISION
Philip - Swing Trader

BTCUSD RECAPBITCOIN has preformed as expected in short period of time can continue even more to the up side but will wait for good entries
Btcusd:Huge trading opportunities and ideasBTCUSD's rebound after touching the position near 116180 this time is fast. From the trend observation. BTCUSD is still in a high consolidation stage. It has not broken the oscillation range for the time being. It can maintain selling near 120k. Buying near 11600 for range trading. It is expected that there will not be many trading opportunities in the London market. It will take until the New York market opens to see better trading opportunities.

BITCOIN Isn't even overbought yet!Bitcoin (BTCUSD) has been rising strongly within a structured Channel Up pattern but even this consistent and steady uptrend since the April 07 2025 rebound on the 1W MA50 (blue trend-line) hasn't been enough to touch the Pi Cycle's overbought trend-line (red).
Throughout BTC's historic Cycles, all Tops have been priced after the overbought level was breached, which currently sits around $180000 (and rising). Given that the 4-year Cycle Theory won't change, even a repeat of the 'weaker' +136.49% last rally of the previous Cycle (Jun-Nov 2021), would take us to $180k exactly but still will be below the overbought trend-line. This just shows the immense upside potential of the market even at the current stages.
So do you think we will get that kind of rally? Feel free to let us know in the comments section below!
-------------------------------------------------------------------------------
** Please LIKE 👍, FOLLOW ✅, SHARE 🙌 and COMMENT ✍ if you enjoy this idea! Also share your ideas and charts in the comments section below! This is best way to keep it relevant, support us, keep the content here free and allow the idea to reach as many people as possible. **
-------------------------------------------------------------------------------
💸💸💸💸💸💸
👇 👇 👇 👇 👇 👇

BTCUSDT BEARISH LONG CHART ANALYSIS📉 BTCUSDT – Bearish Setup in Play (1H)
Bitcoin faces rejection near 119500 resistance and is currently trading around 117000. If price breaks below 115000, bearish momentum may extend toward the 112000 target zone.
🔸 Resistance: 119500
🔸 Support Zone: 115000
🔸 Bearish Target: 112000
Structure remains weak unless buyers reclaim 119500. Watch price action closely.
---
📌 This analysis is for educational purposes only. Trade safe and manage risk properly.

BTCUSD BULLYING Bitcoin is still respecting price and is buying can expect some nice moves (New Highs)
BTCUSDBTCUSD also fell from a high level, reaching a high of around 119700, only 300 points away from the target of 120k. The price after the decline is now around 118600. Buying at a low level is the main focus. The reference buying point is 118500-118000. The target is above 120k. Stop loss 117300
BITCOIN Accumulation Phase almost completed. Higher from here?Bitcoin (BTCUSD) is making a strong rebound on the bottom of its 1-month Channel Up and this analysis is in direct response to the one we published last week (July 15, see chart below), where we called this one-week consolidation:
We won't be going into too much detail then, as you can see the price made the Accumulation 2 Phase, after an identical +25.9% Bullish Leg, same as April's and by breaking below the 4H MA50 (blue trend-line), it hit the 0.236 Fibonacci retracement level.
As per the May 05 fractal hit, as long as the 4H MA100 (green trend-line) supports this Channel Up, the market should start Bullish Leg 3 towards Accumulation Phase 3 and eventually peak at around +43% from its start at $140000.
Do you think the pattern will continue to be repeated in the exact same order? Feel free to let us know in the comments section below!
-------------------------------------------------------------------------------
** Please LIKE 👍, FOLLOW ✅, SHARE 🙌 and COMMENT ✍ if you enjoy this idea! Also share your ideas and charts in the comments section below! This is best way to keep it relevant, support us, keep the content here free and allow the idea to reach as many people as possible. **
-------------------------------------------------------------------------------
💸💸💸💸💸💸
👇 👇 👇 👇 👇 👇

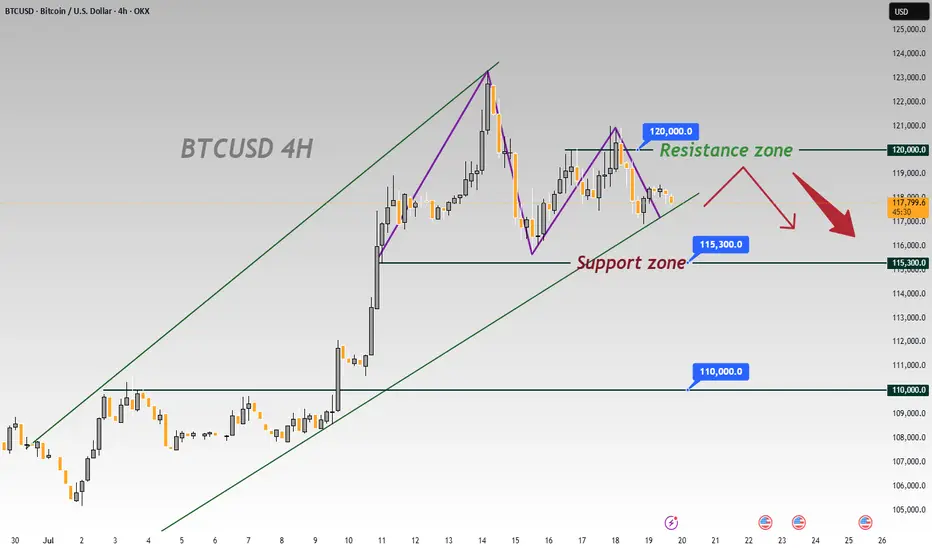
BTCUSD 4-Hour Chart Analysis: Range-Bound Trends & Key LevelsFrom the 4-hour chart of BTCUSD, the recent price movement shows obvious range-bound characteristics 📊. The upper zone around 120000 forms a key resistance level 🛑, where the bullish momentum has waned after encountering resistance 💨.
The lower level of 115300 is a significant support zone 🛡️. Previously, there was some buying support when the price retraced to this zone 👀. However, as the current price is pulling back from the resistance zone ↘️, if the bearish force takes the lead subsequently 🐻, the possibility of breaking below the 115300 support will increase ⬆️. Once it breaks below effectively 💥, the next key support level of 110000 will most likely become the target for the price to decline towards 🎯.
In terms of the short-term trend 📈, due to the obvious suppression from the resistance zone 🚧, the price will most likely continue the rhythm of testing the support downwards 🔽. In operation, one can pay attention to the breakdown situation of the support zone and layout trades accordingly 📝. Meanwhile, be alert to the possibility of a rebound after the price finds support in the support zone 🚀, and further confirmation of the direction needs to be combined with real-time K-line patterns 📊, trading volume 📈
🚀 Sell @119500 - 118500
🚀 TP 116500 - 115500
Accurate signals are updated every day 📈 If you encounter any problems during trading, these signals can serve as your reliable guide 🧭 Feel free to refer to them! I sincerely hope they'll be of great help to you 🌟 👇
BITCOIN Entering Cyclical Profit Zone. Risk should be limited.Bitcoin (BTCUSD) has just entered the first level of the Logarithmic Growth Curve (LGC) Resistance Zone, which is the light pink band. The Top of the previous Cycle was priced at the top of the band just above this.
In fact every BTC Cycle had this as the 'Profit taking Zone'. The market marginally touched that also within December 2024 - January 2025 but got rejected, almost in similar fashion as January 2021, which was a Double Top approach of the peak formation during the previous Cycle.
This Cycle Top is expected to be within October - November 2025, so we call this the 'Profit Taking Zone' for a reason. Risk exposure from now on should be getting more and more limited. Peak range (depending of the nature of aggression of potential Rate Cuts in September) could be anywhere within $140 - 200k.
Do you think this is the time to start limiting BTC exposure, perhaps moving some of the huge profits to alts? Feel free to let us know in the comments section below!
-------------------------------------------------------------------------------
** Please LIKE 👍, FOLLOW ✅, SHARE 🙌 and COMMENT ✍ if you enjoy this idea! Also share your ideas and charts in the comments section below! This is best way to keep it relevant, support us, keep the content here free and allow the idea to reach as many people as possible. **
-------------------------------------------------------------------------------
💸💸💸💸💸💸
👇 👇 👇 👇 👇 👇

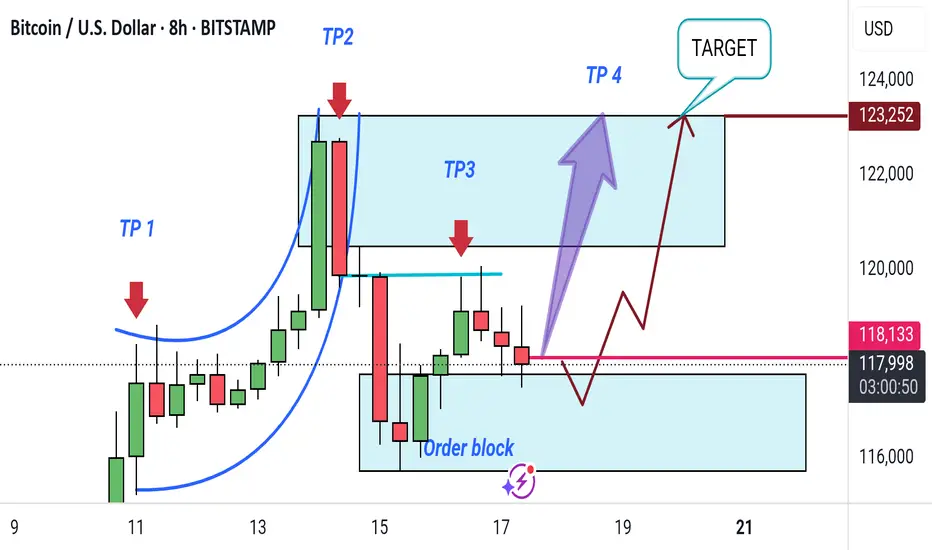
"Bitcoin Bullish Reversal Setup with Target Zones (8H Chart)"This 8-hour Bitcoin/USD chart shows a potential bullish setup. Key takeaways include:
Order Block: Identified support zone for possible reversal.
TP1 to TP4: Target points for profit-taking as price moves upward.
Target Zone: Final target area near $123,252.
Expected move: A short-term dip into the order block, followed by a rally toward the target zone.
BTC/USDT Heist Mode: Buy Low, Escape Rich🏴☠️"Bitcoin vs Tether" Crypto Market Robbery Blueprint 🔥 | Thief Trading Style (Swing/Day Plan)
🌍 Hey Money Makers, Chart Hackers, and Global Robbers! 💰🤑💸
Welcome to the new Heist Plan by your favorite thief in the game — this time targeting the "Bitcoin vs Tether" Crypto Market like a smooth criminal on the charts. 🎯📊
This is not your average technical analysis — it's a strategic robbery based on Thief Trading Style™, blending deep technical + fundamental analysis, market psychology, and raw trader instincts.
💼 THE SETUP — PREPARE FOR THE ROBBERY 🎯
We're looking at a bullish operation, setting up to break into the high-value vaults near a high-risk, high-reward resistance zone — beware, it's a high-voltage trap area where pro sellers and bearish robbers set their ambush. ⚡🔌
This plan includes a layered DCA-style entry, aiming for max profit with controlled risk. Chart alarms on, mindset ready. 🧠📈🔔
🟢 ENTRY: "The Robbery Begins"
📍 Zone-1 Buy: Near 116200.00 after MA pullback
📍 Zone-2 Buy: Near 112600.00 deeper pullback
🛠️ Entry Style: Limit Orders + DCA Layering
🎯 Wait for MA crossover confirmations and price reaction zones — don’t chase, trap the market.
🔻 STOP LOSS: "Plan the Escape Route"
⛔ SL for Pullback-1: 113000.00 (2H swing low)
⛔ SL for Pullback-2: 110000.00
📌 SL placement depends on your position sizing & risk management. Control the loss; live to rob another day. 🎭💼
🎯 TARGET ZONE: “Cash Out Point”
💸 First TP: 127000.00
🏁 Let the profit ride if momentum allows. Use a trailing SL once it moves in your favor to lock in gains.
👀 Scalpers Note:
Only play the long side. If your capital is heavy, take early moves. If you’re light, swing it with the gang. Stay on the bullish train and avoid shorting traps. Use tight trailing SL.
🔎 THE STORY BEHIND THE HEIST – WHY BULLISH?
"Bitcoin vs Tether" shows bullish momentum driven by:
💹 Technical bounce off major support
🌏 Macroeconomic & geopolitical sentiment
📰 Volume + sentiment shift (risk-on)
📈 Cross-market index confirmation
🧠 Smart traders are preparing, not reacting. Stay ahead of the herd.
👉 For deeper insight, refer to:
✅ Macro Reports
✅ COT Data
✅ Intermarket Correlations
✅ CHINA-specific index outlooks
⚠️ RISK WARNING – TRADING EVENTS & VOLATILITY
🗓️ News releases can flip sentiment fast — we advise:
❌ Avoid new positions during high-impact events
🔁 Use trailing SLs to protect profit
🔔 Always manage position sizing and alerts wisely
❤️ SUPPORT THE CREW | BOOST THE PLAN
Love this analysis? Smash that Boost Button to power the team.
Join the Thief Squad and trade like legends — Steal Smart, Trade Sharp. 💥💪💰
Every day in the market is a new heist opportunity — if you have a plan. Stay tuned for more wild robbery blueprints.
📌 This is not financial advice. Trade at your own risk. Adjust based on your personal strategy and capital. Market conditions evolve fast — stay updated, stay alert.

Bitcoin -> The bullrun is not over!📣Bitcoin ( CRYPTO:BTCUSD ) is still totally bullish:
🔎Analysis summary:
A couple of months ago Bitcoin broke above the previous all time high. This was basically just the expected creation of new highs, perfectly following the underlying cycles. With respect to the long term rising channel formation, this bullrun on Bitcoin is just starting.
📝Levels to watch:
$100.000
🙏🏻#LONGTERMVISION
Philip - Swing Trader

BITCOIN Should we still trust the Stock to Flow model??It sure worked perfectly during Bitcoin's (BTCUSD) first Cycles, but the Stock-to-Flow model has greatly diverged from the current price action since March 2024.
Right now the model sits at around $750000, which is vastly above the current market price of $119000. It's been trading sideways actually since June 2024 and all of the times that it was ranging, Bitcoin eventually caught up and closed the gap.
It has always been a 'story' of divergence and convergence but it sure seems unrealistic to catch up this time, especially during if this Cycle continues to follow the 4-year model.
So what do you think? Should we still trust what seems more and more like an 'obsolete' model as mass adoption kicks in? Feel free to let us know in the comments section below!
-------------------------------------------------------------------------------
** Please LIKE 👍, FOLLOW ✅, SHARE 🙌 and COMMENT ✍ if you enjoy this idea! Also share your ideas and charts in the comments section below! This is best way to keep it relevant, support us, keep the content here free and allow the idea to reach as many people as possible. **
-------------------------------------------------------------------------------
💸💸💸💸💸💸
👇 👇 👇 👇 👇 👇
