btcusdBitcoin (BTC) is recognised as the world's first truly digitalised digital currency (also known as a cryptocurrency). The Bitcoin price is prone to volatile swings; making it historically popular for traders to speculate on. Follow the live Bitcoin price using the real-time chart, and read the latest Bitcoin news and forecasts to plan your trades using fundamental and technical analysis.
Bitcoin continues to press higher, making fresh all-time highs in the process. The largest cryptocurrency by market capitalization is up just over 92% since the January 23 swing low ($38.55k), with the move higher driven by ongoing spot ETF buying. Blackrock, the world’s largest asset manager, now holds approximately 204k Bitcoin – current value $14.97 billion – despite their spot ETF being less than two months old. This holding is just behind MicroStrategy’s Michael Saylor who currently holds 205k BTC at an average cost price of around $33.7k.
Btcusdsignals
BITCOIN New bottom formed. Rally could aim well above $100k.Bitcoin (BTCUSD) is at the early stages of a new parabolic rally, similar to January - March, as a key bullish development took place. The 1D RSI hit the 50.00 neutral (middle) level for the first time since breaking above it on January 26 2024 and rebounded, while keeping the 1D MA50 (blue trend-line) intact.
This is a strong bullish signal for the Bull Cycle. BTC has been within a range for the majority of this month and last time all those parameters emerged together was in late November - early December 2020. At that time, Bitcoin also hit the 50.00 RSI level, held above the 1D MA50 and after being ranged for almost a month, it started a new parabolic bullish leg towards the 6.0 Fibonacci extension before the next 1D MA50 pull-back.
As you can see, both sequences capped a roughly +100% rise since the previous Lows where the price made contact with the 1D MA100 (green trend-line) and eventually bounced. The 1D MA100 wasn't touched again for almost 7 months, not before BTC approached the 8.0 Fib extension, completing a +563% rise from that Low.
The fractals are virtually identical so far and if the current price action continues to replicate 2020/ 2021, we expect the 1D RSI to hit 90.00 again before retracing. If $100k isn't hit at that time, we will book profits regardless and buy again on the next 1D MA50 contact. Until then, $100k is our next Target.
But what do you think? Is 100k a realistic target that soon and if yes can Bitcoin repeat 2021 to its full extent and even reach 250k? Feel free to let us know in the comments section below!
-------------------------------------------------------------------------------
** Please LIKE 👍, FOLLOW ✅, SHARE 🙌 and COMMENT ✍ if you enjoy this idea! Also share your ideas and charts in the comments section below! This is best way to keep it relevant, support us, keep the content here free and allow the idea to reach as many people as possible. **
-------------------------------------------------------------------------------
💸💸💸💸💸💸
👇 👇 👇 👇 👇 👇

Is the next Bitcoin target $65k or $60k? check the analysis📣 Hello Mates!
We have observed that Bitcoin has been continuously rising for the past several weeks.
Bitcoin has surpassed its previous target of $69,000 and has now reached $70,000.
We believe that a resistance is forming at $72,000, which may not be surpassed yet. According to our analysis, the market will reach $65,000 or $60,000.
Perhaps the market will reach $70,000, then decline to $64,000, before rising to $72,000.
Subsequently, our target will be reached at $65,000 or $60,000.
However, it's also possible that the market will continuously fall below $70,000, ultimately reaching our target of $65,000 or $60,000.
Stay tuned for further updates and trade smartly! 📊

BTCUSDBitcoin is sceduled to be halved April 20th, 2024 which will continue to soar. For now, these levels provide the next bullish wave.

BITCOIN Will 60k hold?Bitcoin (BTCUSD) is having so far its strongest correction (almost -15%) in 2 months (since the January 23 2024 Low) with the 1D RSI turning neutral (was overbought last week) after forming Lower Highs (i.e. a Bearish Divergence).
The dominant pattern is still a Channel Up, supported by the 1D MA50 (blue trend-line) and last time we saw such an RSI Bearish Divergence was during the previous Channel Up (October 13 2023 - January 11 2024) but turned out to be false and the trend continued upwards. This time though the pull-back appears to be stronger, similar to January 12 2024, which broke the previous Channel Up and made a bearish move towards the 0.382 Fibonacci retracement level.
As a result we are looking for a pull-back extension near Support 1 (59500) and the 0.382 Fib, which is marginally below it, where the 1D MA50 is headed. This is the strongest Support Cluster possible on the short-term and if it holds, the bullish trend of the Channel Up should be maintained and the potential rebound can target $90000 around the time of the Halving. If however the price closes a 1D candle below the 0.382 Fib, we will be looking towards a 1D MA200 (orange trend-line) test around 45000, before the bullish trend is resumed.
Notice also that technically the 44.90 - 36.00 1D RSI Support Zone has been a buy opportunity since for the past 6 months.
Feel free to let us know in the comments section below!
-------------------------------------------------------------------------------
** Please LIKE 👍, FOLLOW ✅, SHARE 🙌 and COMMENT ✍ if you enjoy this idea! Also share your ideas and charts in the comments section below! This is best way to keep it relevant, support us, keep the content here free and allow the idea to reach as many people as possible. **
-------------------------------------------------------------------------------
💸💸💸💸💸💸
👇 👇 👇 👇 👇 👇

BTCUSD Bitcoin Robbery PlanDear Crypto Looters,
My BTCUSD heist plan is started am looting Some coins.💰 My Target is placed at escape zone. If you were looting more and more money you will be bitten to death by ferocious animals. so get out of my escape target and i've put a tunnel in it so you can go and escape.
LOL

btcusd sell shortBitcoin (BTC) is recognised as the world’s first truly digitalised digital currency (also known as a cryptocurrency). The Bitcoin price is prone to volatile swings; making it historically popular for traders to speculate on. Follow the live Bitcoin price using the real-time chart, and read the latest Bitcoin news and forecasts to plan your trades using fundamental and technical analysis.
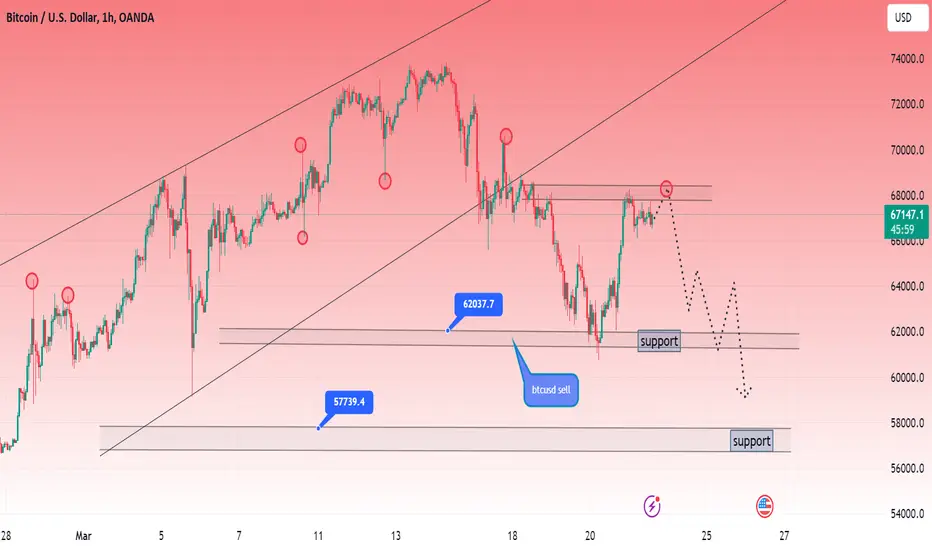
Bitcoin (BTC) price shows a slowdown in momentum as it set up a new all-time high of $73,949 on March 13. Considering the massive uptrend that BTC has been experiencing, a short-term correction is nothing to be concerned about.

DeGRAM | BITCOIN potential buy opportunityBitcoin is consolidating between support and resistance levels.
The market is likely to retest the resistance level and possibly break through the channel border.
We expect a retest of the resistance level following divergence or a sideways move.
-------------------
Share your opinion in the comments and support the idea with like. Thanks for your support!

Btcusd sell long Bitcoin (BTC) price shows a slowdown in momentum as it set up a new all-time high of $73,949 on March 13. Considering the massive uptrend that BTC has been experiencing, a short-term correction is nothing to be concerned about.
Bitcoin (BTC) is recognised as the world’s first truly digitalised digital currency (also known as a cryptocurrency). The Bitcoin price is prone to volatile swings; making it historically popular for traders to speculate on. Follow the live Bitcoin price using the real-time chart, and read the latest Bitcoin news and forecasts to plan your trades using fundamental and technical analysis.

BTCUSD LONG Bitcoin (BTC) is recognised as the world’s first truly digitalised digital currency (also known as a cryptocurrency). The Bitcoin price is prone to volatile swings; making it historically popular for traders to speculate on. Follow the live Bitcoin price using the real-time chart, and read the latest Bitcoin news and forecasts to plan your trades using fundamental and technical analysis.
confirm btcusd signal SELL

BITCOIN This dump will truly test the strength of the rally!Bitcoin (BTCUSD) declined from the fresh 73700 All Time High (ATH) back to 65600 in a matter of a few hours, breaking below the 4H MA50 (blue trend-line), entering the green Ichimoku Cloud for the first time this month, while touching the bottom of the short-term Channel Up pattern.
This is the 2nd Higher Low for the pattern and now is the time for the trend to test the strength of this rally. As long as the candles close inside the Channel Up, we expect the bullish trend to continue and make a break-out attempt even to the 3.0 Fibonacci extension (90000), similar to the Channel Up bullish break-out that delivered the December 09 2023 High.
The two patterns share many similarities not just on their price action and MA periods involved but also on their RSI sequences. If the Channel Up breaks to the downside though, we expect a quick test of Support 1 and will pursue a 60000 Target that should test the 4H MA200 (orange trend-line). Then, as long as the 1D MA50 (red trend-line) holds, we can look forward to a bullish reversal and higher accumulation towards yet another ATH near the end of the month or at worst first week of April.
Feel free to let us know in the comments section below!
-------------------------------------------------------------------------------
** Please LIKE 👍, FOLLOW ✅, SHARE 🙌 and COMMENT ✍ if you enjoy this idea! Also share your ideas and charts in the comments section below! This is best way to keep it relevant, support us, keep the content here free and allow the idea to reach as many people as possible. **
-------------------------------------------------------------------------------
💸💸💸💸💸💸
👇 👇 👇 👇 👇 👇

BTCUSD SHORTBitcoin Price (BTC) Real-Time Live Price
Bitcoin (BTC) is recognised as the world’s first truly digitalised digital currency (also known as a cryptocurrency). The Bitcoin price is prone to volatile swings; making it historically popular for traders to speculate on. Follow the live Bitcoin price using the real-time chart, and read the latest Bitcoin news and forecasts to plan your trades using fundamental and technical analysis.

Will BTCUSD drop significantly?
Rely on technical aspects. The market still maintains a strong upward trend. The first point is the universalization and value-added of digital currency, which is also the first choice to resist inflation. The second is continued weakness in the dollar, and the third is increased demand. Three simple points outline BTC’s strength. At the same time, mysterious buyers always cover their positions at low levels. The above adds strong support to the bottom of BTC.
BITSTAMP:BTCUSD CRYPTOCAP:BTC INDEX:BTCUSD COINBASE:BTCUSD BINANCE:BTCUSD
Whether it is value investing or short-term speculation, I think the time to buy is sooner or later. Just need to measure your own financial situation. Can you bear the risk of a correction?
Based on the above, the following suggestions for buying BTC are given. The prices are based on tradingview's prices.
BTCUSD No. 1 Buying Position 72614
BTCUSD 2nd buying position 71535
BTCUSD 3rd buying position 70500
The strong support below relies on 70k, which is an important integer level.

BTCUSD SELL CONFIRM SIGNAL Bitcoin (BTC) is recognised as the world’s first truly digitalised digital currency (also known as a cryptocurrency). The Bitcoin price is prone to volatile swings; making it historically popular for traders to speculate on. Follow the live Bitcoin price using the real-time chart, and read the latest Bitcoin news and forecasts to plan your trades using fundamental and technical analysis
confirm btcusd sell signal

BITCOIN The ETF multiyear rally has only just begun(Gold's case)With Bitcoin's (BTCUSD) continuous bullish run, day after day, running basically the 7th straight green month, we thought it may be a good time to put things into a greater perspective from a macro point of view, as many seem confused over this hyper aggressive bullish sentiment.
The reason is one and one alone and has a very short name: E T F
Yes, everyone that is following the market knows that on January 11 2024, the first Bitcoin ETF was launched on the U.S. market and after a quick dip, the price has been rising every since. Other macro factors are playing their role, such as the AI technological innovation, the upcoming Halving, the anticipation of Fed rate cuts by June etc. But BTC has never made a new All Time High (ATH) before the Halving before, and this is primarily attributed to the ETFs introduction.
What better case to compare Bitcoin's price action to Gold's following its own ETF launch. That was done on March 28 2003 and the result you can see on the right hand chart. Gold used its 1W MA50 (blue trend-line) as a Support to fuel an 8 year parabolic rally, which only broken during the shock of the 2008 Housing Crisis, but still managed to recover the extend the rally until August 2011.
That peak almost on the 4.0 Fibonacci extension level from the High (January 1996) that preceded Gold's ETF. If Bitcoin follows a similar trend to Gold's (note that Gold's market cap is around $14.530 Trillion, while BTC's is 'only' $1.445 Trillion), it can reach and even surpass emphatically the $1000000 mark (the 4.0 Fib for Bitcoin is at $6 million). Crazy as this may sound (well that's Bitcoin's life story, everything has been 'crazy' at $1, then $10, $100, it was deemed expensive by some even at $1000 and so on), there is no time restriction nor the necessity to reach seemingly extraordinary levels in 8 years or 10. As the market matures, fiat currencies are devalued by more inflation etc, and adoption is accelerated, this may be a process that takes up 15, 20, 30 years. The key, not just for fund managers but also average investors, is to hold Bitcoin in their portfolios just as it has been paying off since 2003 to hold Gold.
Buy what do you think about these two assets and their potential similarities of their post ETF trends? Feel free to let us know in the comments section below!
-------------------------------------------------------------------------------
** Please LIKE 👍, FOLLOW ✅, SHARE 🙌 and COMMENT ✍ if you enjoy this idea! Also share your ideas and charts in the comments section below! This is best way to keep it relevant, support us, keep the content here free and allow the idea to reach as many people as possible. **
-------------------------------------------------------------------------------
💸💸💸💸💸💸
👇 👇 👇 👇 👇 👇

BITCOIN hit 70k! Can a 60k pull-back deliver 100k in 3 months?Bitcoin (BTCUSD) broke the $70000 psychological barrier today, smashing yet again a benchmark level during this Bull Cycle and on a momentum basis, it does not give any signs of stopping. However based on the 2020 post-COVID crash fractal, which started after the 1D MA50 (blue trend-line) crossed above the 1W MA50 (red trend-line), and that BTC has been following on an almost identical trade for the past 1 year (since March 2020), the price may experience a short-term pull-back at this stage.
If the fractal continues to play out, then a $60000 correction towards the end of the month, may come as a technical necessity is Bitcoin is to see a new High as we get closer to April's Halving. As you can see, even the 1D RSI sequences between the two fractals are quite similar. Based on that fractal we may even see Bitcoin at $100000 as early as June!
Do you agree with that? Feel free to let us know in the comments section below!
-------------------------------------------------------------------------------
** Please LIKE 👍, FOLLOW ✅, SHARE 🙌 and COMMENT ✍ if you enjoy this idea! Also share your ideas and charts in the comments section below! This is best way to keep it relevant, support us, keep the content here free and allow the idea to reach as many people as possible. **
-------------------------------------------------------------------------------
💸💸💸💸💸💸
👇 👇 👇 👇 👇 👇

My View Point On Bitcoin today, {6/03/2024}Educational Analysis says BITCOIN BTCUSD may move in this range for some time according to my technical.
Broker - bitstamp
This is not an entry signal. I have no concerns with your profit and loss from this analysis.
Why this range?
Because I think It's going to be short selling for Bitcoin this year or up to the end of this year, There is a lot of liquidity as fvg & volume gaps to the downside.
Bitcoin Institutional traders have built a lot of liquidity when the price was very low, I think it's time to collect it and after that go for an all-time high.
Let's see what this pair brings to the table in the future for us.
Please check the Comment section on how it turned out for this trade.
I HAVE NO CONCERNS WITH YOUR PROFIT OR LOSS,
Happy Trading, Fx Dollars.

BITCOIN What is next narrative it will break?Since th 2021 Bear Cycle started, Bitcoin (BTCUSD) entered a phase that few could have predicted. You can very easily even call it the 'Cycle of Narrative Destruction' as since the June 13 2022 break below the previous All Time High (ATH), Bitcoin started breaking narratives that have been well established throughout its history and few thought could break.
** Five major narrative breaks so far **
Starting from the very first narrative destruction on the week of June 13 2022 (we are viewing this chart on the 1W time-frame), Bitcoin managed to break below the previous ATH (19350) for the first every in its history. Then a few months later in November 2022 in the aftermath of the FTX crash, it broke below the 1W MA300 (red trend-line) also for the first time ever. This resulted into the first ever 1W Death Cross around February 2023 and following the recovery during 2023, it naturally formed the first ever 1W Golden Cross around the last week of December first week of January 2024. The most recent narrative that BTC has destroyed was this week as it made a new ATH marginally above $69000, which was the first time it did so before the Cycle's Halving (which is due in mid April 2024).
** Which narrative is next to break? **
As you can see, those are 5 major narrative breaks in the span of 18 months. So what narrative will BTC break next? The first that comes to our mind as the market is rising that fast this high, is the Theory of Diminishing Returns (TODR). This theory implies (and has been correct so far) that each Cycle delivers lower returns than the previous. As you see on the charts, the first Cycle gave +531681% returns, the next one +62325%, then +11808% and the most recent +2051%.
** So 330k is realistic?? **
If this narrative is to break, it means that BTC would need to make a little over +2051% during the current Cycle. That suggests that we can be looking at a Cycle peak above $330000! Of course if that happens, it would mean that Bitcoin will also break above its historic Parabolic Growth Channel, which can be considered another narrative destruction.
But what do you think? Can the Theory of Diminishing Returns be the next narrative to break and if not, which one do you think it will be? Feel free to let us know in the comments section below!
-------------------------------------------------------------------------------
** Please LIKE 👍, FOLLOW ✅, SHARE 🙌 and COMMENT ✍ if you enjoy this idea! Also share your ideas and charts in the comments section below! This is best way to keep it relevant, support us, keep the content here free and allow the idea to reach as many people as possible. **
-------------------------------------------------------------------------------
💸💸💸💸💸💸
👇 👇 👇 👇 👇 👇

Btcusd sell Bitcoin (BTC) is recognised as the world’s first truly digitalised digital currency (also known as a cryptocurrency). The Bitcoin price is prone to volatile swings; making it historically popular for traders to speculate on. Follow the live Bitcoin price using the real-time chart, and read the latest Bitcoin news and forecasts to plan your trades using fundamental and technical analysis.
Confirm signal

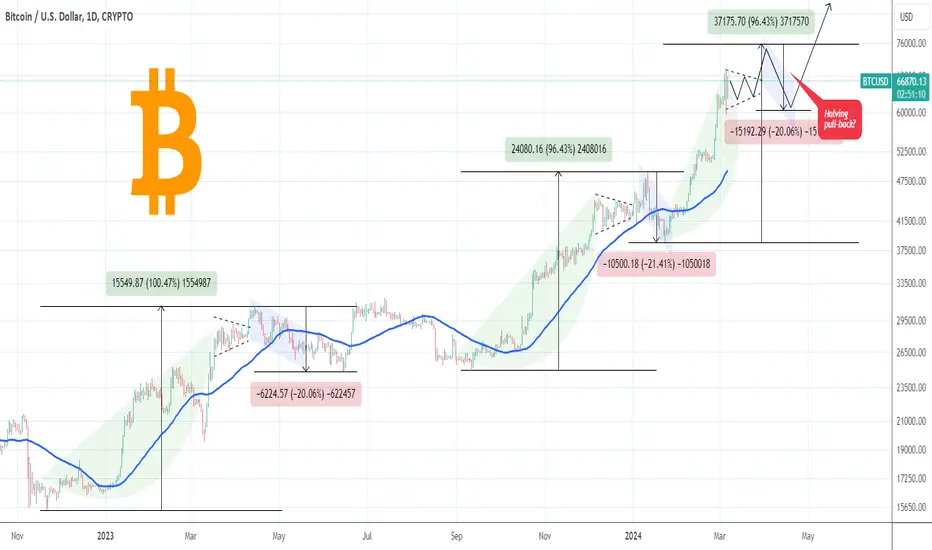
BITCOIN Volatility to kick in as we approach the Halving?So far since the November 2022 bottom, Bitcoin (BTCUSD) has formed the same pattern twice: roughly +100% rise, a Triangle that preceded the rally's top, followed by a roughly -20% decline in the form of a Channel Down.
The latest high volatility of the past 3 days resembles those Triangle patterns before the peak. A +96.43% rise, similar to the previous Wave, gets completed around $75500. If BTC continues to replicate those patterns, then a -20% correction should coincide with April's Halving.
Do you think that Bitcoin will continue following that blue-print? Feel free to let us know in the comments section below!
-------------------------------------------------------------------------------
** Please LIKE 👍, FOLLOW ✅, SHARE 🙌 and COMMENT ✍ if you enjoy this idea! Also share your ideas and charts in the comments section below! This is best way to keep it relevant, support us, keep the content here free and allow the idea to reach as many people as possible. **
-------------------------------------------------------------------------------
💸💸💸💸💸💸
👇 👇 👇 👇 👇 👇
BTCUSD Bitcoin Price (BTC) Real-Time Live PriceBitcoin (BTC) is recognised as the world’s first truly digitalised digital currency (also known as a cryptocurrency). The Bitcoin price is prone to volatile swings; making it historically popular for traders to speculate on. Follow the live Bitcoin price using the real-time chart, and read the latest Bitcoin news and forecasts to plan your trades using fundamental and technical analysis.confirm chart

Btcusd sell Bitcoin (BTC) is recognised as the world’s first truly digitalised digital currency (also known as a cryptocurrency). The Bitcoin price is prone to volatile swings; making it historically popular for traders to speculate on. Follow the live Bitcoin price using the real-time chart, and read the latest Bitcoin news and forecasts to plan your trades using fundamental and technical analysis.
Bitcoin Price (BTC) Real-Time Live Prices
Bitcoin (BTC) price action over the past eight days signals a lack of volatility and reduced liquidity. This coiling up could lead to a steep correction in the near future for BTC. Confirm signal btcusd sell

Btcusd sell confirm signal Bitcoin (BTC) is recognised as the world’s first truly digitalised digital currency (also known as a cryptocurrency). The Bitcoin price is prone to volatile swings; making it historically popular for traders to speculate on. Follow the live Bitcoin price using the real-time chart, and read the latest Bitcoin news and forecasts to plan your trades using fundamental and technical analysis.
Bitcoin Price (BTC) Real-Time Live Price confirm Chart sell
