BITCOIN Below the 4H MA50. Where does it go from here?Bitcoin (BTCUSD) has broken 3 days ago below the 4H MA50 (blue trend-line) for the first time in 2 weeks and so far remains under it, unable to regain the bullish momentum of the first half of February. But how bad can that be? Does it jeopardize the long-term bullish trend?
For now not. Even though the February 15 High was technically a rejection on the Higher Highs trend-line that started on December 05 2023, the medium-term pattern remains a 1-month Channel Up. That pattern is similar to the Channel Up from October 13 2023 to December 17 2023, which broke sideways after a 1D candle closing below the 4H MA100 (green trend-line). The 4H MA100 is currently at 49656, with additional support levels Support 1 (48400) and the 0.5 Fibonacci retracement level (47800), which provided the necessary support on the December 11 2023 Low.
As a result, we have a strong candidate zone as the new Support Base that can technically extend the bullish trend of the Channel Up. The short-term target is the Higher Highs trend-line at 55000 and if we get a 1D candle closing above it, Channel Up extension to its top at 60000.
Note that the 4H RSI offers a very strong buy signal on its 30.00 oversold barrier. Every time it was hit in the last several months, the price rebounded (even in the cases January 13, 14 and 18, when it was just short-term rebounds).
But what do you think? Will BTC provide a bullish extension on the current Channel Up? Feel free to let us know in the comments section below!
-------------------------------------------------------------------------------
** Please LIKE 👍, FOLLOW ✅, SHARE 🙌 and COMMENT ✍ if you enjoy this idea! Also share your ideas and charts in the comments section below! This is best way to keep it relevant, support us, keep the content here free and allow the idea to reach as many people as possible. **
-------------------------------------------------------------------------------
💸💸💸💸💸💸
👇 👇 👇 👇 👇 👇
Btcusdsignals

BITCOIN New rally about to start! Similarities with 2020/21.Bitcoin (BTCUSD) has rebounded strongly since the 39000 Low and has left the 1D MA50 (blue trend-line) significantly behind, with many wondering if a correction back to it is due. That would technically be reasonable and an optimal level to add more buys but it is not necessary to happen. A simple comparison with the 2020/ 2021 Bull Phase (right chart) offers critical insight on a potential rally structure.
** Fibonacci levels and CCI **
As you can see (both charts are on the 1D time-frame), during the 2020/21 rally BTC pulled back below the 1D MA50 only after it broke above the $60k level. Even during the short-term correction within the 6.0 - 5.0 Fibonacci extension levels (dotted Channel Down), the 1D MA50 held. The 1D CCI pattern since the start of 2023 has been identical so far to BTC's price action since the March 2020 COVID bottom.
** The structure of today vs 2020/21 **
The symmetry between the two is remarkable, they both started on a (dotted) Channel Down that broke below the 1D MA50, then a consolidation phase in the form of an Arc within our base 1.0 - 0.0 Fib levels and then a rally to the more recent (blue circle) consolidation within the 3.0 - 2.0 Fib extensions. That is the structure that the February rally left behind and if 2021 continues to be our guide, it should now start a new rally first to the 4.0 Fib (65000) and then to the 6.0 Fib (a little above 100000) for the new dotted Channel Down correction.
** Is such strong rally so fast realistic? **
Of course $100k by April would mean reaching those levels by the Halving event, which seems unrealistic (of course that is relative) even with the current ETF inflows which are surpassing every prior estimate. But of course it is a solid framework to have as a guide even if the current Cycle proves to be less aggressive than the previous and symmetry starts breaking.
But what do you think? Is it possible for Bitcoin to continue replicating 2021 and reach 100k so fast? Feel free to let us know in the comments section below!
-------------------------------------------------------------------------------
** Please LIKE 👍, FOLLOW ✅, SHARE 🙌 and COMMENT ✍ if you enjoy this idea! Also share your ideas and charts in the comments section below! This is best way to keep it relevant, support us, keep the content here free and allow the idea to reach as many people as possible. **
-------------------------------------------------------------------------------
💸💸💸💸💸💸
👇 👇 👇 👇 👇 👇

Btcusd next move Personal suggestion for you
Btcusd price trend to continue Fly during session
It is expected that price will continue in the Fly
and can approach the price range of 51626.90
Setup btcusd price
Btcusd buy from 51626.90
Target 53912.52
Note:
Always wish you to manage your capital safe
Take small lots which suits your capital
The winner is the one who sticks with the market
Give us like and support us

BITCOIN just made the most important 1W closing of this Cycle!Bitcoin (BTCUSD) made last week a closing that is going under the radar by the market. The closing of the last 1W candle was made above the 0.786 Fibonacci retracement level from the November 2021 All Time High (ATH). But why is that of such a significant value? Because every time in BTC's history it closed a 1W candle above the 0.786 Fib of the ATH, the price never closed below it again.
In fact we can claim that for every past Cycle, such a 1W closing is the final confirmation for the start of the Parabolic Rally. It has to be noted that after such closing, Bitcoin made new ATH in maximum 2 months! That suggests we could see a new Historic High at the time of the Halving! Are just starting the new rally?
Feel free to let us know in the comments section below!
-------------------------------------------------------------------------------
** Please LIKE 👍, FOLLOW ✅, SHARE 🙌 and COMMENT ✍ if you enjoy this idea! Also share your ideas and charts in the comments section below! This is best way to keep it relevant, support us, keep the content here free and allow the idea to reach as many people as possible. **
-------------------------------------------------------------------------------
💸💸💸💸💸💸
👇 👇 👇 👇 👇 👇

BITCOIN Are we witnessing a run straight to new All Time Highs?Bitcoin (BTCUSD) has broken aggressively above January's Highs and hasn't been that high since November 2021! The December - January consolidation is history and what technically follows consolidation periods are phases of strong trends. We can in fact gain remarkable insight by comparing BTC's bullish run since the November 2021 market bottom to the runs of 2020/21 and 2015/16.
As you can see on these 1W time-frame charts, all periods share common characteristics. They all started with a strong Channel Down that formed the market bottom and then consolidated for the first time within a Triangle after they broke above the 1W MA50 (blue trend-line). After a rally, the 2nd consolidation took place (red arc), which then paved the way for a more aggressive rally. Based on this pattern, it would appear that Bitcoin could be at the start of such a rally.
The only charactestic that is not common on all three is that in 2023/24 and 2015/16 we had a Bullish Cross between the 1D MA50 and the 1W MA100 (green trend-line) after the Triangle consolidation, while during 2020/21 that took place much earlier due to the Libra euphoria.
In any case, all phases have a Higher Lows trend-line which was respected and held during the two past Cycles. On the current one, that gives a downside range at around 35k, which is practically the 1W MA50. Also notice how the 1W RSI negated any potential for a Bearish Divergence by crossing above Lower Highs. That is the same RSI pattern that emerged after each red Arc consolidation that led into the rallies.
As long as those hold, could it mean that Bitcoin has started a very aggressive wave that will break to new All Time Highs (ATH) in a matter of weeks, possibly by the time of the Halving?
Feel free to let us know in the comments section below!
-------------------------------------------------------------------------------
** Please LIKE 👍, FOLLOW ✅, SHARE 🙌 and COMMENT ✍ if you enjoy this idea! Also share your ideas and charts in the comments section below! This is best way to keep it relevant, support us, keep the content here free and allow the idea to reach as many people as possible. **
-------------------------------------------------------------------------------
💸💸💸💸💸💸
👇 👇 👇 👇 👇 👇

BITCOIN to 40k or 69k?Bitcoin (BTCUSD) has been trading within a long-term Channel Up pattern since the November 21 2022 market bottom. The price broke today above the psychological level of $50000 and is about to touch that very top (Higher Highs trend-line) of the Channel Up.
As the 1D RSI broke above its 4-month Lower Highs trend-line and is largely overbought near 80.00, this technically resembles the same break-out of June 23 2023. As a result, as long as the 1D candles close within the Channel Up, BTC could pull-back to a 'fair' value near $40000 and the 1D MA200 (orange trend-line) above the 0.382 Fibonacci retracement level. Time-wise it would be ideal to reach that level before April's Halving and start attracting long-term buying interest then.
If however a 1D or even better, a 1W candle closes above the Channel Up, we will turn again largely bullish on the medium-term break-out as we can see an price action resembling the short-term Channel Up that started on October 24 2023 that paved the way for the December 08 2023 High. That High was on a +79.77% rise from the September 11 2023 Low, the last technical Higher Low of the Channel Up. A new +79.77% run from the recent January 23 2024 Low would peak marginally above $69000, which in that case will be our Target.
Which scenario do you think is more likely to prevail now? 40k or 69k? Feel free to let us know in the comments section below!
-------------------------------------------------------------------------------
** Please LIKE 👍, FOLLOW ✅, SHARE 🙌 and COMMENT ✍ if you enjoy this idea! Also share your ideas and charts in the comments section below! This is best way to keep it relevant, support us, keep the content here free and allow the idea to reach as many people as possible. **
-------------------------------------------------------------------------------
💸💸💸💸💸💸
👇 👇 👇 👇 👇 👇

BTCUSD will going to the $50K in the next 1 to 2 weeksBTCUSD will going to the $50K in the next 1 to 2 weeks
BTCUSD (W1) reached TP according to our assessment last week ( HERE ). And currently, it seems that the value of BTC will quickly move towards the $50K price range in the next 1 to 2 weeks.

BTCUSD (D) Which option do you prefer?BINANCE:BTCUSD BTCUSD (D) Which option do you prefer?
Presently, Bitcoin (BTC) exhibits two potential price trajectories:
A continued descent towards the support zone around 38.xxx.
The formation of an inverted head and shoulders pattern in the price.
Which option do you prefer?

BTC H & S PERFORMING ON 4HR BULLISH MOVE AHEAD !!HELLO TRADERS
As I can see BTC is creating harmonic pattern on 4H TF so i am expecting a bull move is coming again after this retracement from 49K tp 38K and now its trading above the support zone so lets join the train and see what's markets brings to NFP today will move markets which are trading in a range ..
This idea buying only makes sense after a positive reaction at support and NFP outcome bad.
share your thoughts with us on BTC trading idea we appreciate ur love and support it help many other traders
don't forget to visit on chart which we had analysis for a bearish move
Follow the Trend Bez Trend is UR Friend :)

BITCOIN forming the first 4H Golden Cross in 5 months!Bitcoin (BTCUSD) is about to form a Golden Cross on the 4H time-frame, which will be the first such formation in almost 5 months (since September 18 2023)! Regardless of the time that has passed since its last occurrence (which is a strong parameter), that pattern alone is a strong enough bullish signal for the short-term.
This can be the signal that can trigger a strong rally back to January's High but within the technical context of the dominant medium-term pattern that is none other than an Inverse Head and Shoulders (IH&S). That is a technical bullish reversal pattern that is formed on market bottoms.
It could be no coincidence that the last 4H Golden Cross (chart on the right) was formed while BTC was completing an Inverse Head and Shoulders. The standard target of such patterns is the 2.0 Fibonacci extension level. As you see on October 20 2023 that was exactly where the price consolidated and it happened to be a Resistance level from a former High.
The 2.0 Fib on the current IH&S happens to be only marginally above the 49000 Resistance and that is our Target for the short-term.
Do you agree that the emergence of a 4H Golden Cross and the Inverse Head and Shoulders can take the price back to January's High? Feel free to let us know in the comments section below!
-------------------------------------------------------------------------------
** Please LIKE 👍, FOLLOW ✅, SHARE 🙌 and COMMENT ✍ if you enjoy this idea! Also share your ideas and charts in the comments section below! This is best way to keep it relevant, support us, keep the content here free and allow the idea to reach as many people as possible. **
-------------------------------------------------------------------------------
💸💸💸💸💸💸
👇 👇 👇 👇 👇 👇

BITCOIN rare signal. Is it staging a mega bullish break-out?Bitcoin (BTCUSD) is about to flash one of the strongest cyclical bull signals it can give as the 1M (monthly) RSI is attempting to break and close above the 62.50 level. What's so important about it? Every time that level broke with the price deep into the Bull Cycle, BTC started its most aggressive phase, the Parabolic Rally that ended on the Cycle's new (All Time) High.
Last time that happened was in October 2020 and the Cycle before in June 2016. Common characteristic on both occasions is that the price was above the 0.618 Fibonacci retracement level of the previous High. On this Cycle, Bitcoin has already broken (and closed) above it since December 2023. As a result, once this pre-Halving consolidation is over, we can expect the new Parabolic Rally to start.
In addition to the 1M RSI, the Vortex Indicator (VI) has diverged to its fullest last month after a Bullish Cross. Going back again to the previous two Cycles, symmetrically we are still at a level where BTC has established a Low/ Support and can only rise from here (exception of course the March 2020 COVID flash crash which set the market back for a few months. Also if it wasn't for the early 2019 Libra euphoria, the VI would have made the Bullish Cross at a later stage). As a result, comparing it with 2016 is more accurate.
But what do you think? Is this potential RSI break-out, the strongest bullish signal we can get right now? Feel free to let us know in the comments section below!
-------------------------------------------------------------------------------
** Please LIKE 👍, FOLLOW ✅, SHARE 🙌 and COMMENT ✍ if you enjoy this idea! Also share your ideas and charts in the comments section below! This is best way to keep it relevant, support us, keep the content here free and allow the idea to reach as many people as possible. **
-------------------------------------------------------------------------------
💸💸💸💸💸💸
👇 👇 👇 👇 👇 👇

BTCUSDPair : BTCUSD ( Bitcoin / U.S Dollar )
Description :
Symmetrical Triangle as an Corrective Pattern in Short Time Frame
Impulse Correction
Completed Impulsive Waves " 12345 " and " AB " Corrective Wave
Head and Shoulder Pattern in Long Time Frame and completed its Second Shoulder

BTCUSD H1 / POSSIBLE RISE AFTER THE RETRACEMENT 💲Hello Traders!
This is my idea related to BTCUSD H1. I expect a retracement until the resistance level, after that, I will look for a long entry. At this stage, I see Bitcoin as more bullish than bearish.
Traders, if you liked my idea or if you have a different vision related to this trade, write in the comments. I will be glad to see your perspective.
____________________________________
Follow, like, and comment to see my content:
www.tradingview.com

Bitcoin- 36k zone remains my targetIn my previous Bitcoin analysis, I argued that, in my opinion, the correction for BITSTAMP:BTCUSD was not yet over, and we could potentially witness a drop to the 36k zone. Since then, the price dipped below the 40k zone and rebounded back to almost 44k. However, this rebound exhibits a corrective structure, resembling a bearish flag, suggesting that a new downward leg could follow.
In conclusion, as long as the 45k level remains intact, selling rallies could prove to be a sound strategy with favorable risk-reward potential.

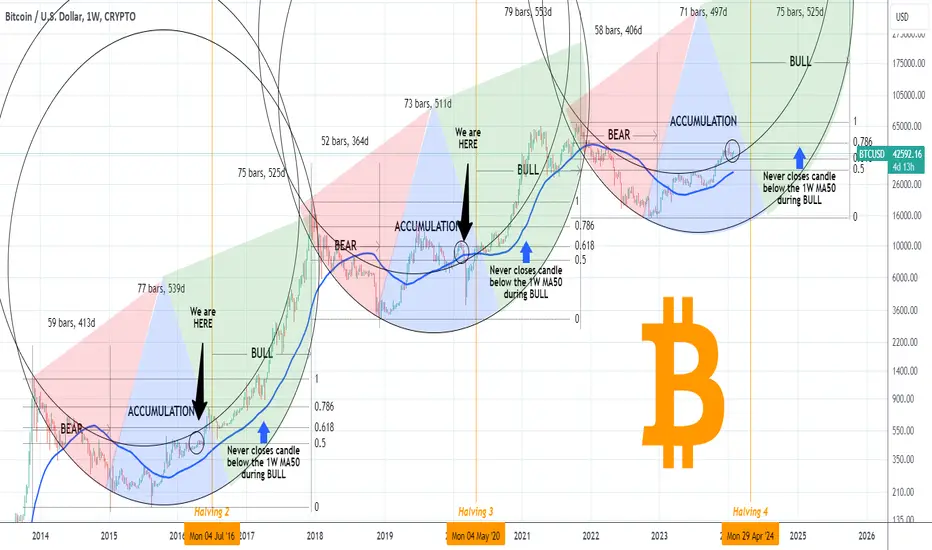
BITCOIN Cycle Phases like you've never seen them before!On today's post we are basically upgrading our previous analysis (see chart below) with the addition of actual circle shapes on Bitcoin's (BTCUSD) Cycles and pies on their phases:
As you can see this reveals a groundbreaking illustration of the historic Cycles. We don't want to get you in the technical details of the trend, you can find everything by clicking on our previous publication.
But as you can see, on top of the tradition measuring of the Cycle phases (Bear, Accumulation, Bull), we have place Wedges/ Pies that fit into the actual Circles. Those Circles (as well as the pies naturally) are all the same size/ symmetry, which just goes to show you how similar BTC's Cycles are despite the different news and fundamentals that take place during each Cycle.
We use a Double Circle pattern to demonstrate more vividly the Cycles. Most of BTC's price action tends to be within that Zone that is made, even the 2018 - 2021 Cycle, despite the notable divergencies during the Accumulation (Libra euphoria) and Bull (Musk, Tesla adoption) phases, it eventually fell back within the Channel.
The presentation also reveals Bitcoin's current position relative to the previous Cycles (black "We are HERE" arrow). That's near the end of the Accumulation Phase, only a few weeks before the Halving, above the 1W MA50 (blue trend-line) and within the 0.618 - 0.5 Fibonacci Zone. The upside is enormous and since the price is above the Circles Channel as during February 2020, who is to say we won't see another outperformance, especially if positive fundamentals hit the market (ETF approvals already, potential Rate Cuts, more news of adoption every day etc).
But what do you think? Is this Cycle presentation accurate and if so are you expecting a massive rally as we approach the Halving? Feel free to let us know in the comments section below!
-------------------------------------------------------------------------------
** Please LIKE 👍, FOLLOW ✅, SHARE 🙌 and COMMENT ✍ if you enjoy this idea! Also share your ideas and charts in the comments section below! This is best way to keep it relevant, support us, keep the content here free and allow the idea to reach as many people as possible. **
-------------------------------------------------------------------------------
💸💸💸💸💸💸
👇 👇 👇 👇 👇 👇
Bitcoin 25/01 Pair : BTCUSD ( Bitcoin / U.S Dollar )
Description :
Consolidation Phase as an Corrective Pattern in Short Time Frame. Completed Break of Structure with Retracement. Bullish Channel as an Corrective Pattern in Short Time Frame and Rejection from Lower Trend Line to completed its " C " Corrective Wave

BITCOIN Every monthly pull-back is a BUY opportunity from now onOn this 1W analysis we see Bitcoin's (BTCUSD) amazing symmetry through its historic Cycles. A symmetry which upto this date, is holding and we will explain why right away.
Before we begin, note that the current study can be used in combination with our legendary Golden 51%-49% Ratio publications shown below:
** Three Cycle Phases **
Now as to the cyclical symmetry. The chart classifies each grand Cycle into three phases:
a) The Bear Phase (red), which starts at the top of the previous Cycle and ends on its bottom. The price breaks below the 1W MA50 during that phase.
b) The Accumulation Phase (blue), which continues where Bear left off and is when investors buy for the long-term following the market bottom. The price breaks above the 1W MA50 during that phase.
c) The Bull Phase (green), which starts after the Halving event (orange vertical line) and ends on the new Cycle top. The price never closes a 1W candle below the 1W MA50 during that phase.
** The Symmetry **
As you can realize just on first glance, the Phases along the Cycles are on an amazing symmetry. The Bear Phases has so far been 59 weeks (413 days), 52 weeks (364 days) and the most recent 58 weeks (406 days) respectively. The Accumulation Phases have been 77 weeks (539 days) and 73 weeks (511 days) respectively. The Bull Phases have been 75 weeks (525 days) and 79 weeks (553 days) respectively.
The current Accumulation Phase will be 71 weeks (497 days) by the time of the Halving, which is remarkably along the lines of the previous 2. As for the new Bull Phase after the Halving, we could assume a minimum duration of 75 weeks (525 days) as in 2016 - 2017.
** Fibonacci role on the Halving date **
The key at the moment as we approach the upcoming Halving in April, are the Fibonacci retracement levels. During the previous two Halvings, BTC had already reached the 0.786 Fib once and at the time of the Halving was around the 0.618 Fib, which is basically the current price levels within 39000-40000. The 1W MA50 is about to touch the 0.5 Fib level which is around 33000 and technically, based on this model, is as low as the correction can extend to.
Technically we should be expecting price levels around 40k as we enter April, which of course doesn't dismiss the possibility of another run to 50k earlier. In conclusion, assuming the 1W MA50 is the new long-term Support from now on, every monthly correction, should technically be a buy opportunity as we head into the Bull Phase.
But what do you think about this Cycle mapping? Do you expect history to continue to repeat itself? Feel free to let us know in the comments section below!
-------------------------------------------------------------------------------
** Please LIKE 👍, FOLLOW ✅, SHARE 🙌 and COMMENT ✍ if you enjoy this idea! Also share your ideas and charts in the comments section below! This is best way to keep it relevant, support us, keep the content here free and allow the idea to reach as many people as possible. **
-------------------------------------------------------------------------------
💸💸💸💸💸💸
👇 👇 👇 👇 👇 👇

It looks like BTCUSD (D) is moving towards the price support zonBINANCE:BTCUSD
It seems BTCUSD (D1) is moving towards the price support zone at 37k-38K$ with signs of a downtrend forming

BTCUSD⚠️Big SELL Movement✔️BTCUSD is expected to fall
🔴Recommended to consider Selling from Seller Limit Zone.
🔴Now try to move down with new Sellers.
⚠️SELL the TOPS!!!

BITCOIN 1W MACD Bearish Cross formed. Is it alarming?Bitcoin (BTCUSD) is on the 3rd straight bearish week (1W) following the 49000 High, which technically was a Higher High on the 1-year Channel Up. This is the 2nd Higher High structure within this pattern (first was on April 10 2023) and technically we are currently on the new Bearish Leg that seeks the formation of a new Higher Low at the bottom of the Channel Up.
** 1W MACD Bearish Cross **
This week's big development though is the completion of a Bearish Cross on the 1W MACD, the first one since July 24 2023 and before that May 29 2023. Both of those came after the peak formations but delivered at least another 3 weeks of downtrend.
** The 3-year Cyclical Demand/ Supply Zone **
Interestingly enough those peaks were priced on the 3-year Cyclical Demand/ Supply Zone, which we have analyzed extensively in previous publications (has been Support during the Bull Cycle and Resistance during the Bear Cycle). This time BTC is above that Zone and the current Bearish Leg has high probabilities of testing it as a Support (Demand) for the first time since May 2022.
** Where to buy? **
The medium-term supporting trend-line is the 1D MA200 (red trend-line), which is already near the middle of that Zone and long-term the 1W MA50 (blue trend-line), which is about to enter it. What long-term investors and Dollar-Cost-Average traders should be looking for is buy positions on those key levels. If the Cyclical Zone holds (i.e. keeps closing 1W candles above it), then it will be confirmed as a Supply level for the remainder of the Bull Cycle and most likely will propel the price to the new Parabolic Rally Phase after April's Halving.
** Next Target? **
Every Bullish Leg within the 1-year Channel Up has been around +100%, so as long as the pattern holds, we should be technically expecting a rebound of similar magnitude. Assuming the bottom (Higher Low) is priced as low as possible (on the 1W MA50), a new +100% rise will provide a Higher High around 65000, just below Resistance 2 (69150), which is essentially the All Time High (ATH). Historic patterns have shown that a buy just before the 1W MACD forms a Bullish Cross, is perhaps the most optimal entry in preparation for this rally.
But what do you think? Is Bitcoin about to test the Supply Zone and perhaps the 1D MA200 and 1W MA50? Are you waiting for a long-term buy there? Feel free to let us know in the comments section below!
-------------------------------------------------------------------------------
** Please LIKE 👍, FOLLOW ✅, SHARE 🙌 and COMMENT ✍ if you enjoy this idea! Also share your ideas and charts in the comments section below! This is best way to keep it relevant, support us, keep the content here free and allow the idea to reach as many people as possible. **
-------------------------------------------------------------------------------
💸💸💸💸💸💸
👇 👇 👇 👇 👇 👇

BITCOIN MACD bottom pattern shows when to Buy and when to Sell !Over the years we have discovered many historic patterns applicable to Bitcoin's (BTCUSD) Cycles. With a relative degree of volatility every time, since each Cycle has it's own distinct characteristics and fundamental events that shape it, those patterns can help traders/ investors construct strategies for buying and selling on a long-term scale.
This time we have come across a very unique pattern on the 1M time-frame, which can identify where to Buy and where to Sell, near the Tops and Bottoms respectively, on a Cyclical scale.
Starting from the November 2011 bottom onwards, each Cycle is measured at either 3.58 or 3.83 years to the point where the 1M MACD bottoms. The last MACD bottom and start of reversal was on February 2023, while BTC was trading around 23k on average. Still not as appealing as the November 2022 16000 but low enough to provide an excellent (and confirmed) long-term dip buy entry compared to the previous $69000 All Time High.
At the moment the price is on the 0.236 Fibonacci level of the current Cycle and as you can see on the chart, this is the level where BTC makes a 1-2 month pull-back. The Tops are priced either on the 0.5 or 0.618 Fibonacci levels. This means that long-term investors could take their profits either on January 2025 or July 2025, if the current Cycle lasts again 3.58 years. And as for the next bottom based on the model, it is expected on December 2026, where we can take a (relatively) confirmed buy position again for the long-term.
But what do you think about that MACD bottom model? Are you also expecting a new Cycle Top within January - July 2025? Feel free to let us know in the comments section below!
-------------------------------------------------------------------------------
** Please LIKE 👍, FOLLOW ✅, SHARE 🙌 and COMMENT ✍ if you enjoy this idea! Also share your ideas and charts in the comments section below! This is best way to keep it relevant, support us, keep the content here free and allow the idea to reach as many people as possible. **
-------------------------------------------------------------------------------
💸💸💸💸💸💸
👇 👇 👇 👇 👇 👇

BTCUSD 17/01Pair : BTCUSD ( Bitcoin / U.S Dollar )
Description :
Impulse Correction " ab " Completed. Consolidation Phase as an Corrective Pattern in Short Time Frame and Long Time Frame and Rejection from Upper Trend Line. Bullish Channel as an Corrective Pattern in Long Time Frame with the Breakout of the Lower Trend Line

Bitcoin Price in Need of a Boost: Key Levels to WatchThe current state of Bitcoin's value requires a push from investors, as the cryptocurrency finds itself hovering around the $43,000 mark at the time of writing. Following a 7.7% dip over the past weekend, BTC has fallen below the upward trendline, which previously acted as a crucial support level.
The Relative Strength Index (RSI) has also, for the first time in three months, dropped below the neutral 50.0 level, indicating a mild downward trend at present. Despite Bitcoin's attempts to break free from the 50-day Exponential Moving Average (EMA) at around $42,069, there is potential for recovery as long as the $44,000 barrier is breached.
The market sentiment surrounding Bitcoin hinges on the successful overcoming of the $44,000 resistance, offering a chance for the cryptocurrency to regain its footing. Investors will be closely monitoring this critical level, as a decisive breakthrough could pave the way for a renewed upward trajectory. As Bitcoin navigates these key levels, the coming days will likely unfold with significant implications for its short-term price action.
