🚨 BTCUSD UPDATE 🚨🚨 BITCOIN UPDATE 🚨
* Here we can see clearly BTCUSD has according to our previous post on Feb 25/2023.
* Let's see if Bitcoin ( Crypto King ) is going to our next level of $40k.
* Keep your eye close on your trading positions.
* Happy pip hunting traders.
* FXKillA *
Btcusdsignals

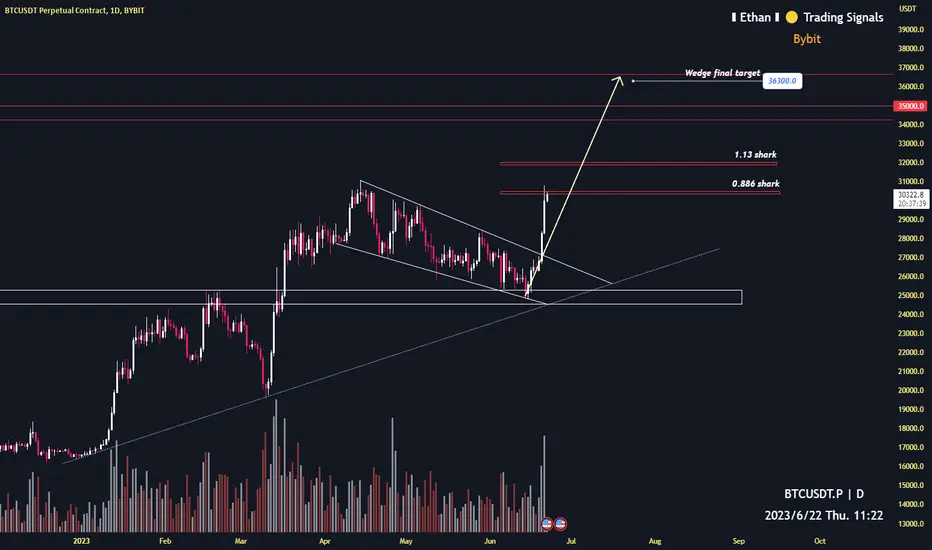
Bitcoin 3 key resistance for short!1D time frame
-
Key resistances: 30500, 32000, 36300
Be careful of any reversal signals at these prices
Stay prepared to open short until this bear really end
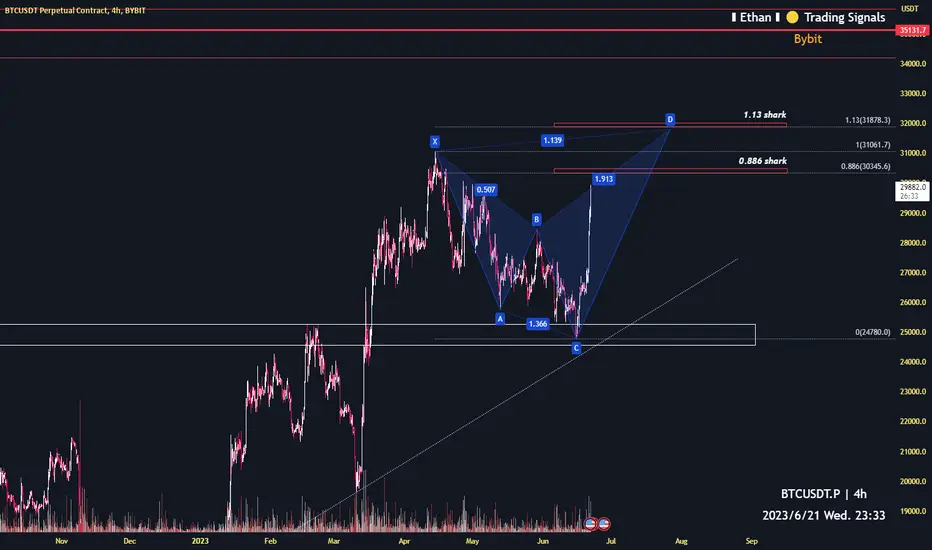
Bitcoin potential reversal price $318784h time frame
-
Bitocoin creating a potential harmonic structure(shark).
Reversal price is 30345 and 31878, depend on small or big shark.
We can have great RRR if open short at these prices.
Stay prepared for it!
Bitcoin approaches next resistance level as price drive upAs you may already know, Bitcoin has been on a steady upward trend in recent weeks, and it looks like the next major resistance is near the $27,500 level. This is a significant milestone for Bitcoin, and a close above this resistance might spark bullish moves in the near term.
Furthermore, Bitcoin has already broken through the Fibonacci .23 level, which is a positive sign for investors. This means that the next major resistance at $27,500 is within reach, and it could be a great opportunity for you to add to your positions.
I encourage you to take advantage of this opportunity and consider adding to your Bitcoin positions. With the market looking bullish and the next major resistance within reach, now is the time to act.
Thank you for your time, and I wish you all the best in your Bitcoin investments.

DeGRAM | BITCOIN short opportunityAfter a huge sell off, BTC is consolidating in a descending channel.
Price action pulled back to the resistance even though the trend shifted to bearish.
BTC is likely to continue consolidating until we see an indication of breaking the channel.
-------------------
Share your opinion in the comments and support the idea with like. Thanks for your support!

BTCUSD Analysis H4Here is my analysis for BTCUSD on H4 by Order Block. The price could go bearish, you can put a pending order on the Order block or find an entry on LTF within OB Zone. Trade Safe!

BTC will pump to $32500 then dump to $20000 by the end of 20231D time frame
-
Based on the falling wedge
We might see 32500 soon
And there is a very great entry to short Bitcoin
Be careful the potential severe dump to 20k in November.

BTCUSDCaught a re-entry trade on BTCUSD. I am expecting a drop to the downside and forming a Lowe low. Although the price movement seems to be slowish, but still holding and waiting patiently for the drop.

Bitcoin Next Possible MovePair : BTCUSD ( Bitcoin / U.S Dollar )
Description :
Bearish Channel in STF as an Corrective Pattern
Divergence - RSI
Completed " ABC " Corrective Wave
Consolidation Phase
Break of Structure
Fibonacci Levels
S / R Level

BITCOIN Strong long-term buy signal by the BBWP!Bitcoin (BTCUSD) just flashed one of the rarest buy signals on the 1W time-frame. The Bollinger Band Width Percentile (BBWP) bottomed at 0%, giving a narrow width signal. Historically, when the price was above the 1W MA20 (red trend-line) during that signal (4 times/ green circle), it skyrocketed shortly after, while when it was below (1 time/ red circle) it dropped massively.
At the moment the price is on the 1W MA20 and it will be interesting to see if BTC closes above or below it, as it can influence the trend of the coming weeks. What do you think, will it close above it and skyrocket or below and decline? Feel free to let us know in the comments section below!
-------------------------------------------------------------------------------
** Please LIKE 👍, FOLLOW ✅, SHARE 🙌 and COMMENT ✍ if you enjoy this idea! Also share your ideas and charts in the comments section below! **
-------------------------------------------------------------------------------
💸💸💸💸💸💸
👇 👇 👇 👇 👇 👇

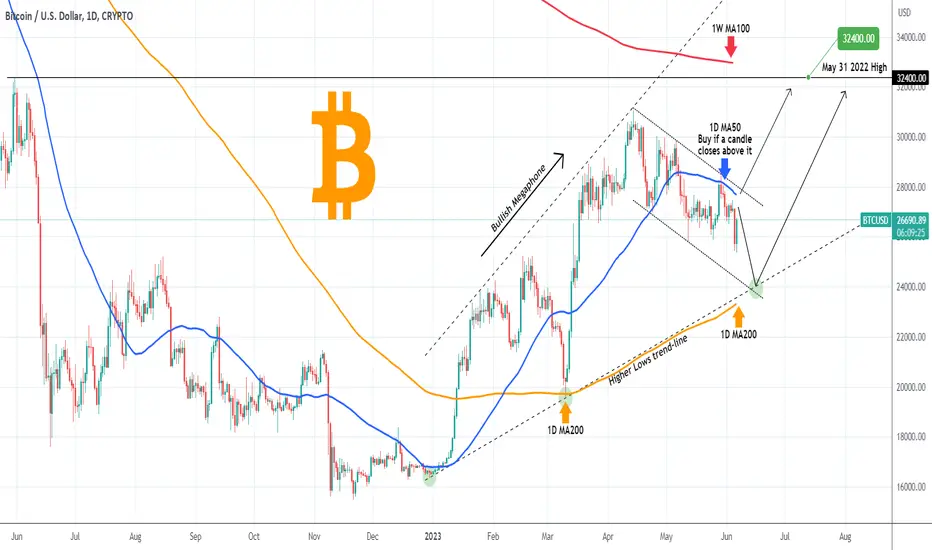
BITCOIN The Megaphone bottoms lower, unless this breaks first.Bitcoin (BTCUSD) made a new Lower Low since the short-term Channel Down started on April 14 and is rebounding in the past five hours. The long-term pattern remains a Bullish Megaphone and this Channel Down is the corrective wave towards the Higher Lows trend-line. For as long as it holds, it is likely to see it bottom on the 1D MA200 (orange trend-line) just like it happened on the March 10 Higher Low.
Be prepared though to buy earlier if the price closes a 1D candle above the 1D MA50 (blue trend-line), which hasn't happened since May 06 (exactly 1 month ago). In either case, our target is the next Resistance at 32400 (May 31 2022 High), which is where the 1W MA100 (red trend-line) is headed to, the last remaining MA Resistance.
-------------------------------------------------------------------------------
** Please LIKE 👍, FOLLOW ✅, SHARE 🙌 and COMMENT ✍ if you enjoy this idea! Also share your ideas and charts in the comments section below! **
-------------------------------------------------------------------------------
💸💸💸💸💸💸
👇 👇 👇 👇 👇 👇
BTCUSD-20K STILL REMAIN BUYING ZONEBTCUSD $BITSTAMP: BTCUSD as per our previous idea, rejected at the internal lq zone and currently heading towards our buying zone. Let's see how it works out

♦️BITCOIN HEADING TOWARDS 20K♦️BITCOIN(BTCUSD), shown strong bearish momentum, which can be a strong indication of bears taking controll over. While DXY will be extremely bullish in this scenario it would be hard btcusd to create another bullish impulse.
If you like my work, do like and comment your views that helps us bring more ideas like this.

BTCUSD Live Chart H1Here is my view for BTCUSD on H1. The price could go bearish, you can put a pending order on the Order block or find an entry on LTF within OB Zone. Trade Safe!

BITCOIN The importance of the monthly closing.Bitcoin (BTCUSD) posted last month the first 1M (monthly) red candle closing since December 2022. That was a strong four month bullish streak with the 1M MA50 (blue trend-line) supporting since March 2023. On today's analysis we put emphasis on the importance of the candle closings on the 1M time-frame.
As you see, both May and April closed below the Resistance Zone (red) that was previously a Support in 2022 having closed all 1M candles up to April 2022 above it, despite some large wicks that broke much lower but where bought back aggressively in the end. That Support Zone is now the new Resistance Zone, in a similar way as the Resistance Zone of July - August 2022 (green) is now the new Support.
Within July - August, the 1W MA50 (red trend-line) will most likely enter that Support Zone, in a similar way as the 1W MA100 (green trend-line), which is the long-term Resistance, is now trading within the Resistance Zone. All this while the 1M MACD is about to complete a Bullish Cross, the first since July 2020.
As a result, we have a huge Neutral Zone ahead of us until the end of the year and will continue to hold as long as 1M candles close within it. A candle closing above the Resistance Zone, will be a bullish break-out signal towards the 45900 - 48500, which is the next Resistance Zone ahead and our long-term target.
So what do you think? Do monthly candle closings have any significance in Bitcoin's trend? And if so, do you agree with the proposed outlook above? Feel free to let us know in the comments section below!
-------------------------------------------------------------------------------
** Please LIKE 👍, FOLLOW ✅, SHARE 🙌 and COMMENT ✍ if you enjoy this idea! Also share your ideas and charts in the comments section below! **
-------------------------------------------------------------------------------
💸💸💸💸💸💸
👇 👇 👇 👇 👇 👇

BITCOIN Close to its first 1W MA20/200 Bullish Cross in HISTORY!Bitcoin (BTCUSD) is very close to forming a Bullish Cross on the 1W time-frame between the 1W MA20 (red trend-line) and the 1W MA200 (orange trend-line). When completed it will be its first such pattern in its history and that is a major bullish signal on its own. In order to get a full grasp of this formation's magnitude, we compare it with the Nasdaq (NDX) on the 1W time-frame as well (chart on the right).
As you see, Nasdaq has formed its 1W MA20/200 Bullish Cross 2 months already (March 06) and exactly on that formation it started a relentless rally, with both MA periods holding as Supports. The price is above the 0.618 Fibonacci retracement level and aiming at the Next Resistance (15300), which is almost on the 0.786 Fibonacci.
BTC has been obviously lagging behind, not even having broken above the 0.5 Fibonacci but with its Next Resistance (48350) also being almost on the 0.786 Fibonacci level. This potentially indicates that Bitcoin has much more upside to it.
So what do you think? Can BTC's first ever 1W MA20/200 Bullish Cross start a rally that will fill at least the 0.618 Fib gap in the same fashion as Nasdaq? Feel free to let us know in the comments section below!
-------------------------------------------------------------------------------
** Please LIKE 👍, FOLLOW ✅, SHARE 🙌 and COMMENT ✍ if you enjoy this idea! Also share your ideas and charts in the comments section below! **
-------------------------------------------------------------------------------
💸💸💸💸💸💸
👇 👇 👇 👇 👇 👇

BITCOIN Is it repeating Amazon's incredible bull run?Bitcoin (BTCUSD) is currently testing (and so far holding) its MA200 (orange trend-line) on the 1W time-frame for the fourth straight week. This is being cemented as the new Support of the new Bull Cycle. A Bull Cycle which was confirmed after the price broke above the Lower Highs trend-line of the Bear Cycle, as well as the MA50 (blue trend-line), forming a Death Cross in the process.
We can see almost exactly the same pattern formed on Amazon (AMZN) back in 2010. After a break above its Lower Highs, Amazon formed a Death Cross on the 1D time-frame, broke above its MA50 and hit the MA200. With the MA50 is Support, after a short consolidation/ accumulation phase it started a relentless rally that broke above the previous High.
BTC seems to be currently on a similar consolidation phase. Does it mean that it might make one last short-term bearish wave near the MA50? If the RSI indicators between the two fractals are symmetrical, then BTC's current RSI pull-back suggests that we are at or near the new Low.
So what do you think? Is Bitcoin about to start a strong rally similar to 2010 Amazon's? Feel free to let us know in the comments section below!
-------------------------------------------------------------------------------
** Please LIKE 👍, FOLLOW ✅, SHARE 🙌 and COMMENT ✍ if you enjoy this idea! Also share your ideas and charts in the comments section below! **
-------------------------------------------------------------------------------
💸💸💸💸💸💸
👇 👇 👇 👇 👇 👇

BTCUSD Live Chart H1Here is myv iew for BTCUSD on H1. The price could go bearish, you can put a pending order on the Order block or find an entry on LTF within OB Zone. Trade Safe!

BITCOIN Rejection on the 1D MA50 maintains the Channel Down.Bitcoin (BTCUSD) is on the third straight red 1D candle following Monday's rejection (and closing below) on the 1D MA50 (blue trend-line), the short-term Resistance MA. This maintains the medium-term Channel Down but at the same time the long-term Channel Up since the start of the year remains unbroken.
The 1D MA100 (green trend-line) is the first line of Support and if it holds, we will go long only when the price closes above both the 1D MA50 and Resistance 1 (28500). The target is, as stated on previous analyses, the 1W MA100 (red trend-line) at 32500. Note that the fact that the 1D MACD made a Bullish Cross on Saturday, empowers this probability.
On the other hand, a 1D candle close below the long-term Channel Up, makes the short-term Channel Down prevails and should extend selling towards the 1D MA200 (orange trend-line), which has been untouched since March 10. In that case, our target will be Support 2 (24000). The risk is low with this break-out strategy on the current levels, so plan your trades accordingly.
Which break-out do you think will prevail? Feel free to let us know in the comments section below!
-------------------------------------------------------------------------------
** Please LIKE 👍, FOLLOW ✅, SHARE 🙌 and COMMENT ✍ if you enjoy this idea! Also share your ideas and charts in the comments section below! **
-------------------------------------------------------------------------------
💸💸💸💸💸💸
👇 👇 👇 👇 👇 👇

BITCOIN 55k Bullish fractal on 1M ahead of a MACD Bullish Cross!Bitcoin (BTCUSD) is about to close the monthly candle of May and most likely it will be the first red since December. We haven't seen a four month bullish streak since January 2021. Despite the end of this succession, this is far from a discouraging long-term signal as the past two Cycles show that every time the 1M time-frame prints this pattern where a red 1M candle pauses a bullish streak, tests the Symmetrical Support (previous Resistance turned into Support) and holds, it then initiates a very strong rally.
Two times out of three this rise was the parabolic rally at the end of each Cycle (+560% in 2021 and +2100% in 2017). The first time it was the initial rally after the Bear Cycle bottom and it rose by +125%. On all occasions, the Symmetrical Support held, i.e. no candle ever closed below it. A +125% rise from this month's low gives an approximate target slightly above $55000. With the 1M LMACD about to make a Bullish Cross, the first since July 2020, this fractal seems to be gathering all the firepower it needs to start the next phase of the Bull Cycle.
Note that after the red monthly candle, during the previous fractals, the rally peaked in 5, 7 and 9 months. The earliest (5 months) times the $55k top in October.
So what do think? Is this the final red monthly candle before a relentless rally? Feel free to let us know in the comments section below!
-------------------------------------------------------------------------------
** Please LIKE 👍, FOLLOW ✅, SHARE 🙌 and COMMENT ✍ if you enjoy this idea! Also share your ideas and charts in the comments section below! **
-------------------------------------------------------------------------------
💸💸💸💸💸💸
👇 👇 👇 👇 👇 👇

BTCUSD Live Chart H1Here is my view for BTCUSD on H1. The price could go bullish, you can put a pending order on the Order block or find an entry on LTF within OB Zone. Trade Safe!

BTC short TradeRSI divergence confirm the trade
Wait for retest
Manage your risk reward ratio
this would be swing trade, 10x - 20x leverage would be good.

BITCOIN RSI break-out and the Bollinger huge upside!Our last week's buy signal was purely based on the 1D RSI break-out (see chart below) and Bitcoin (BTCUSD) didn't fail to deliver:
As you see, the RSI on the 1D time-frame eventually broke above its Lower Highs trend-line, and as it has done all year on three previous occasions, it is starting to rise aggressively. Today the price broke above the 1D MA50 (blue trend-line) but has so far been rejected. BTC needs a candle close above it in order to accumulate more buyers and extend this rally. On a different occasion, the 1D MA100 (green trend-line) may be re-tested for validation.
The price did however break above the Bollinger Bands top and the BBWidth remains low, indicating that there is considerable upside potential. This is the first time this year that BTC had a 1D RSI break-out that low with the BBW at its lowest possible level. With the long-term pattern being a Channel Up and the price practically still trading on its bottom, the low BBW simply validates further the argument of the significant upside potential. Once a 1D candle closes above the 1D MA50, the short-term target will be the 1W MA100 (red trend-line) at 32500.
But what do yo think? Was the RSI Lower Highs break-out the early buy signal to 32500 we've been waiting for? Feel free to let us know in the comments section below!
-------------------------------------------------------------------------------
** Please LIKE 👍, FOLLOW ✅, SHARE 🙌 and COMMENT ✍ if you enjoy this idea! Also share your ideas and charts in the comments section below! **
-------------------------------------------------------------------------------
💸💸💸💸💸💸
👇 👇 👇 👇 👇 👇
