BITCOIN The astonishing symmetry with 2014/15 shows $49k in NovOn today's analysis we look into Bitcoin (BTCUSD) on the 1W time-frame and compare the current Cycle with that of 2014 - 2017. As you see there is so far an astonishing symmetry between the two, with the price currently consolidating after almost hitting the 0.5 Fibonacci retracement level three weeks ago. For the Fibonacci calculations we have used the price top and bottom as suggested by the 1W RSI, which is the backbone of the analysis. This indicates that the Cycle Top (on RSI terms) was on the week of April 12 2021 (and not Nov 08 2021) while the Cycle Bottom was on the week of June 13 2022 (and not in November 2022, which was in the aftermath of the FTX crash).
So far the three Phases have lasted almost the same time. If Phase 3 (yellow) ends this week on a 46 week duration such as November 30 2015, then on the next 1W candle we will start Phase 4 (green), which in 2016 lasted for 28 weeks and on its end hit the 0.786 Fibonacci level. As a result, this is a highly probable target, with the 0.786 Fib being at $49000 and the 28 week span ends on November 13 2023.
With the 1W RSI pulling back after hitting the 70.00 overbought level in April, do you think BTC will start a strong Phase 4 next week towards FWB:49K ? Feel free to let us know in the comments section below!
-------------------------------------------------------------------------------
** Please LIKE 👍, FOLLOW ✅, SHARE 🙌 and COMMENT ✍ if you enjoy this idea! Also share your ideas and charts in the comments section below! **
-------------------------------------------------------------------------------
💸💸💸💸💸💸
👇 👇 👇 👇 👇 👇
Btcusdsignals

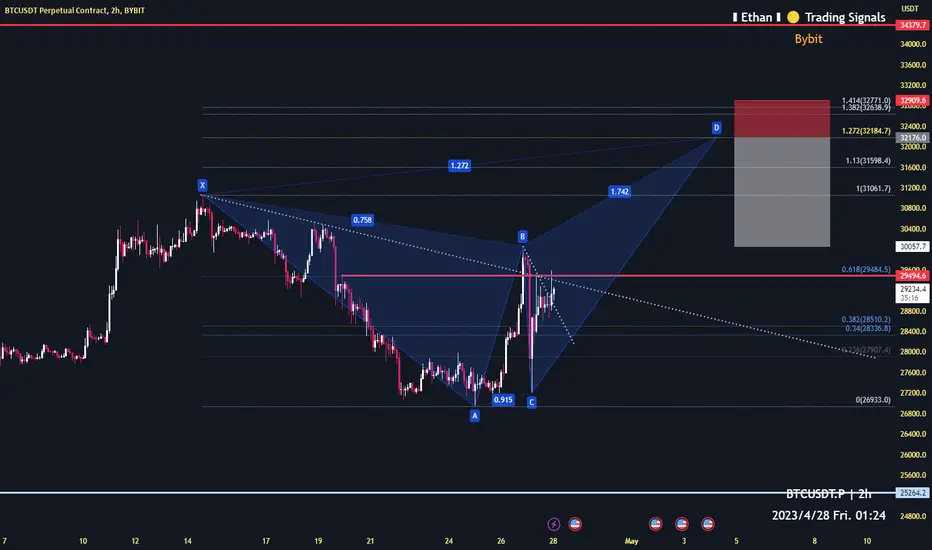
Bitcoin is approaching the end of this small bull run2h time frame
-
Bitcoin is creating a potential harmonic structure(butterfly)
The reversed point is around 32185 to 32700.
We might reach it in next two weeks.
Stay prepared for it!
BITCOIN How the VIX will push it (along with stocks) much higherYou may be wondering what Bitcoin (BTCUSD) has to do with the S&P500 index (SPX) and the Volatility Index (VIX). Well this chart gives you the answer and sets the tone for the remainder of the year and beyond.
As you see Bitcoin (chart on the left) rebounded on the Higher Lows trend-line that started on the December 2018 Low (and only broke during the COVID crash). The S&P500 (chart in the middle) is following a similar pattern as its Higher Lows trend-line (that only broke during the U.S. - China trade war and the COVID crash) held and gave the index a push last October.
At the same time VIX (chart on the right) has been holding its Higher Lows trend-line up until this month (April). This bearish break-out implies that the index that measures the market volatility will most likely drop further indicating a decline in uncertainty and setting a risk-on tone for stocks and crypto alike. The lower the volatility, the higher risky assets such as stocks and crypto trade.
Do you think that will be the case for the rest of the year and probably beyond after this bearish break-out on VIX? Feel free to let us know in the comments section below!
-------------------------------------------------------------------------------
** Please LIKE 👍, FOLLOW ✅, SHARE 🙌 and COMMENT ✍ if you enjoy this idea! Also share your ideas and charts in the comments section below! **
-------------------------------------------------------------------------------
💸💸💸💸💸💸
👇 👇 👇 👇 👇 👇

BITCOIN Held key Cycle Support, preparing a mega break-out!Bitcoin (BTCUSD) is rebounding off the 0.5 Fibonnaci Lower Lows trend-line that provided Support numerous times during the previous Cycle but when it finally closed a 1W candle below it (June 06 2022) it started the final bearish sequence.
Currently this is very positive for the upside's chances and if BTC manages to close a 1W candle above the 0 Fib, we can see the final two bullish waes to 36000 and 43000. At the same time, the Higher Lows trend-line since the market bottom is holding, while the 1W MA50 (blue trend-line) hasn't been re-tested in a month and a half.
Do you think that hold on the 0.5 Fib was the key and we are off to the races again? Feel free to let us know in the comments section below!
-------------------------------------------------------------------------------
** Please LIKE 👍, FOLLOW ✅, SHARE 🙌 and COMMENT ✍ if you enjoy this idea! Also share your ideas and charts in the comments section below! **
-------------------------------------------------------------------------------
💸💸💸💸💸💸
👇 👇 👇 👇 👇 👇

BITCOIN hit the 1D MA50 after 40 days!Bitcoin (BTCUSD) hit yesterday (and closed above it) the 1D MA50 (blue trend-line0 for the first time since March 13. At the same time it almost touched the 0.618 Fibonacci level of the Channel Up, which has been the last level of Support before the bottom of the Channel Up.
The key here are the 1D RSI and LMACD indicators. We've placed both on the same pane and as you see they both imply that we may be in a similar spot as March 07 - 10. Whether we get a macro catalyst (it was the Credit Suisse crisis then) that will pull the price back to the bottom of the Channel Up or not, that remains to be seen.
If BTC closes a 1D candle below the 1D MA50, it is possible to see that last pull-back to the bottom of the Channel Up. If not, expect a rebound from current levels. In either case, our target is 33000.
Feel free to let us know in the comments section below!
-------------------------------------------------------------------------------
** Please LIKE 👍, FOLLOW ✅, SHARE 🙌 and COMMENT ✍ if you enjoy this idea! Also share your ideas and charts in the comments section below! **
-------------------------------------------------------------------------------
💸💸💸💸💸💸
👇 👇 👇 👇 👇 👇

Bitcoin short-term target 28800!1h time frame
-
Bitcoin will probably create a potential inverse head and shoulders here, which neckline is 27880.
If this structure perfectly form, the target will be 28700~28800.

BITCOIN Cycle Phases in a very demonstrative way!post, we are looking into Cyclical phase and demonstrate them in a way like you've never seen before!
Each Cycle consists of the Bear (red), Transition (blue) and Bull (green) Phases. The Bear Phase ends at the bottom of the Cycle, where the Transition starts and typically after the price breaks above the 0.786 Fibonacci retracement level, the Bull Phase starts.
At the moment BTC is above the 1W MA50 (blue trend-line), has already started its Transition Phase and is expected to stay within it, until the 0.786 Fib breaks. Technically this may not happen before the next Halving (4), which due on May 2024. If it breaks earlier, expect the next Bull Phase (which is usually the most aggressive/ parabolic part of the Cycle) to start earlier.
Do you like this Cycle representation? Feel free to let us know in the comments section below!
P.S. The Cycles and trend-lines may get distorted and displaced based on your screen display. Adjust the axis accordingly to view the image as it is shown outside the idea.
-------------------------------------------------------------------------------
** Please LIKE 👍, FOLLOW ✅, SHARE 🙌 and COMMENT ✍ if you enjoy this idea! Also share your ideas and charts in the comments section below! **
-------------------------------------------------------------------------------
💸💸💸💸💸💸
👇 👇 👇 👇 👇 👇

BTC Going downClearly seems supply is in control, very likely we will have another leg down (A measured move) which looks to be an important demand zone.
NFA

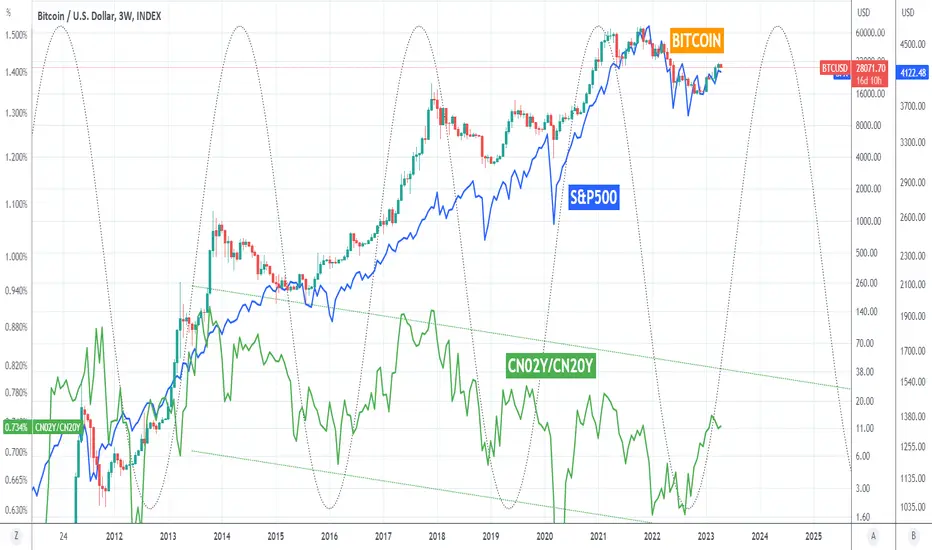
BITCOIN being pumped after China bonds macro cycle bottomIt is not the first time we look into how the Chinese bonds (with our unique CN02Y/CN20Y ratio displayed by the green trend-line) affect Bitcoin's (BTCUSD) Cycles:
It is however the first time we add stocks (S&P500 with the blue trend-line) in the mix. We can see the Cyclical behavior of the bond yields ratio as illustrated by the Sine Waves. Every time it bottoms, BTC and stocks bottom as well and start a cyclical rally. Additionally, you can see how the ratio has been on a Channel Down for the past 10 years, supporting the bullish expansion on both Bitcoin and the stock market.
Since the bond yields ratio is already rallying hard with BTC/ stocks following, do you think that this is just the beginning? Feel free to let us know in the comments section below!
-------------------------------------------------------------------------------
** Please LIKE 👍, FOLLOW ✅, SHARE 🙌 and COMMENT ✍ if you enjoy this idea! Also share your ideas and charts in the comments section below! **
-------------------------------------------------------------------------------
💸💸💸💸💸💸
👇 👇 👇 👇 👇 👇
#Bitcoin #BTC #BTCUSD Are We There Yet? A Year LaterThe question on everyone's lips, are we there yet? Is the #BearMarket bottom in?
Almost 1 year ago to the day I shared my Bitcoin bottoms up idea:
Which used Ben Cowen's risk indicator to indicate the bottom or top of the Bitcoin market waves.
The theory for using this indicator is as follows:
1. Bottoms must be below 0.20
2. Tops must be over 0.85
3. Anything below 0.60 but over 0.20 is accumulation
As you can see the indicator called the following tops and bottoms:
2011 Bear Market Bottom
2013 Bull Market Top
2015 Bear Market Bottom
2017 Bull Market Top
2018 Bear Market Bottom
2020 Covid-19 Crash Bottom (Black Swan Event)
2021 Bull Market Top
That means that this theory of use for the indicator has correctly identified every significant bottom or top since 2011 apart from the November 2021 blow off.
While the November 2021 blow off top is not completely insignificant many do not count this as the top from a technical point of view and there are a host of valid reasons for that.
If we take a look to the present day we can see that between the end of June and October 2022 the indicator dropped below 0.20, which begs the question, was that the bottom?
I have marked 14th November 2022 as the possible bottom and there are strong indications that this is the case. However, what we must remember is the wider picture and the likely recession that is incoming (Bitcoin has never experienced a recession so will be unprecedented times).
I therefore believe we will see an accumulation phase, without breaking above the 0.60 level before returning back down for one final plummet to put in a further low (in much the same way we put in a higher high after the top was called in late 2021).
For me the sensible play is to allow the time to pass more before entering the market, as mentioned these are unprecedented times, with the Ukraine/Russia war and looming recession. The risk of further lows is far higher than the possible risk of not catching the exact bottom price in my opinion. Having said that if you did enter around 15.5, and I know some who did, you cannot say it was a bad move at all.
Let me know what you think

* BTCUSD TP HIT ** Here we can see clearly how My previous post on BTCUSD SELL Setup Soon, has worked perfectly accordingly to my analysis,
* Well done to whoever took the trade with us,
* Keep your eyes close on your trading journey,
* Happy pip hunting traders.
* FX KILLA *

Bitcoin Price H1Here is my view for BTCUSD on H1. The price could go bearish, you can put a pending order on the Order block or find an entry on LTF within OB Zone. Trade Safe!

BITCOIN The next leg up can reach $40000Bitcoin (BTCUSD) continues to follow the pattern of February - June 2019. The consolidation on the Higher Lows 1 has now been succeeded by a consolidation on Higher Lows 2. On June 10 2019 that started the final rally, roughly symmetrical to the one that took the price from Higher Lows 1 to Higher Lows 2 (+75%), to the HKEX:13900 peak.
If BTC continues to replicate this, then the current Higher Lows 2 should give way to a +48% rise that can take the price to $40000.
Is this how high the next leg up can go? Feel free to let us know in the comments section below!
-------------------------------------------------------------------------------
** Please LIKE 👍, FOLLOW ✅, SHARE 🙌 and COMMENT ✍ if you enjoy this idea! Also share your ideas and charts in the comments section below! **
-------------------------------------------------------------------------------
💸💸💸💸💸💸
👇 👇 👇 👇 👇 👇

BTC Looking bullish after a small pullback to grab liquidityAfter a deep pullback to 0.5 fib level I expect a liquidity grab and rise from there.
Everything on the chart!
NFA

BITCOIN Don't sleep on this MegaphoneThe Megaphone pattern you see on this 1W chart certainly doesn't get enough attention as other, most cyclical and systemic patterns prevail. Bitcoin (BTCUSD) however has formed a similar structure during the previous Bull Cycle, right after the first rally top.
The moment that pattern broke to the upside (Fibonacci 1.0), the price spent as much time from the bottom (Fib 0.5) as the bottom did from the start (Fib 0.0). On the current pattern the bottom is on the November 07 2022 1W candle and that gives a projected break-out above the Megaphone on the week of June 03 2024. That isn't at all unrealistic as it times very well with the next Halving 4 event (scheduled on March 2024), which is the supply shock event that historically boosts BTC's price into the most aggressive Parabolic Rallies.
Do you think this pattern is of any importance? Feel free to let us know in the comments section below!
-------------------------------------------------------------------------------
** Please LIKE 👍, FOLLOW ✅, SHARE 🙌 and COMMENT ✍ if you enjoy this idea! Also share your ideas and charts in the comments section below! **
-------------------------------------------------------------------------------
💸💸💸💸💸💸
👇 👇 👇 👇 👇 👇

BTCUSD High Probability SELL Setup SOON !!!* Here we can see Clearly the next move for Bitcoin this coming Hours & Days,
* We can see Clearly it's forming Head & Shoulder Reversal Pattern ( M ),
* We've got our EP level ( Blue Line ) & our TP level ( Golden Line ),
* Keep a close eye on your trading journey,
* Happy pip hunting traders.
* FX KILLA *

BTC USD SELLERS COMING SOON FOR THEIR CHANCE {06/APRIL/2023}Educational Analysis says BTC USD may go Short according to my technical.
This is not an entry signal. I have no concerns with your profit and loss from this analysis.
Why short?
I have mentioned the reason why it will move down from here.
selling pressure build-up.
I HAVE NO CONCERNS WITH YOUR PROFIT OR LOSS.
ENTRY - 28,523.85
STOP-LOSS - 28,754.65
TAKE PROFIT - 15,767.21
THE RISK-TO-REWARD RATIO IS 1:55.27

BITCOIN Keep it simple. 1W RSI above 70 = rally!Bitcoin (BTCUSD) on the 1W time-frame is about to see its RSI break above the 70.00 overbought barrier. A simplistic yet reliable historical way of viewing the current situation is that every time the RSI broke above this level, BTC was either starting a mega Parabolic Rally or was in the middle of a smaller rally. On five occasions the rallies were very aggressive, on four there were less, the kind of rallies we see at the start of a Bull Cycle.
What is it going to be this time? Feel free to let us know in the comments section below!
-------------------------------------------------------------------------------
** Please LIKE 👍, FOLLOW ✅, SHARE 🙌 and COMMENT ✍ if you enjoy this idea! Also share your ideas and charts in the comments section below! **
-------------------------------------------------------------------------------
💸💸💸💸💸💸
👇 👇 👇 👇 👇 👇

BITCOIN has started riding 'The Bollinger Wave'. Fullspeed rallyBitcoin (BTCUSD) is witnessing a strong green week, following three straight weeks of flat price action that got many questioning the strength and durability of the rally since the start of the year. A simple indicator comes to give the answer on the 1W time-frame. It is the Bollinger Bands that display a very distinct characteristic during BTC rallies (similarly during downtrends as well).
We call that "The Bollinger Wave" and it is the upper Bollinger Band (blue trend-line) on the 1W time-frame that Bitcoin rides as a "wave" during a Bull Rally. The chart on the left shows the last two such rallies, with the current being the 3rd one as the price has been "riding" the upper Bollinger since the week of January 16.
The chart on the right shows all such rallies since 2010. It is easily noticeable that when such rallies start there is now easy or quick stop to them and they are supported by the Bollinger's Basis (orange trend-line). This is the exact same trend-line that offered the strong rebound of March 6th.
How high the current rally can go before getting exhausted is anybody's guess but two things are a fact: a) It has only just started and b) the Bollinger Basis has risen to 22435 and is now the long-term Support.
So what do you think? Will Bitcoin continue to "ride the Bollinger wave"? Feel free to let us know in the comments section below!
-------------------------------------------------------------------------------
** Please LIKE 👍, FOLLOW ✅, SHARE 🙌 and COMMENT ✍ if you enjoy this idea! Also share your ideas and charts in the comments section below! **
-------------------------------------------------------------------------------
💸💸💸💸💸💸
👇 👇 👇 👇 👇 👇

BTCUSDI think bitcoin running bullish. But now market is ranging. So now i waiting support line. If market goes down and hit that support line, i will enter long.

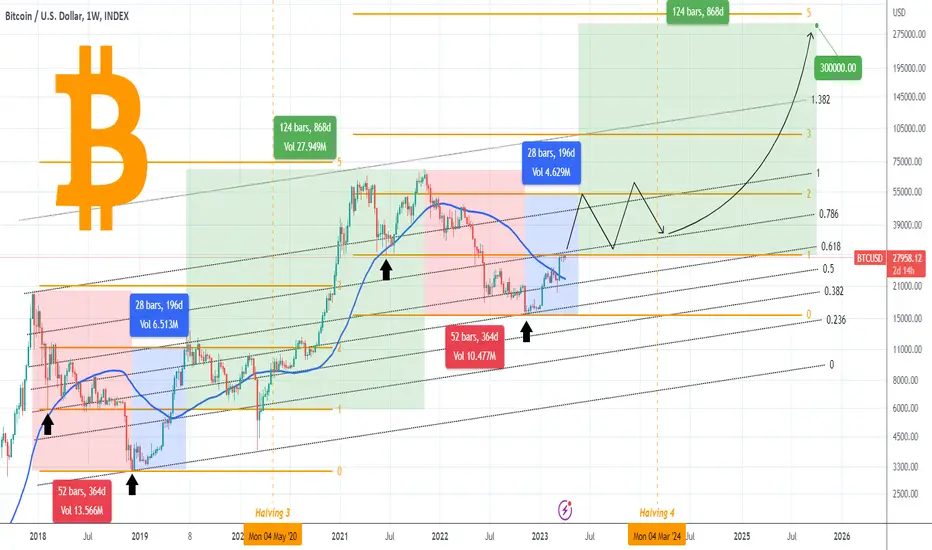
BITCOIN Is 300k the true potential of this Cycle?Bitcoin (BTCUSD) isn't backing down, withstanding to perfection so far any noise in the stock market, a development that establishes that its new Bull Cycle is well underway. Having broken above the 1W MA50 (blue trend-line) and what will most likely be the 4th straight weekly closing above it, we can see that it is testing (and so far struggling to break) the key former Support of the Bear Cycle (Fibonacci 1.0).
The previous Cycle made an aggressive rally to the 2.0 Fib extension after it broke above the Bear Cycle's Support (Fib 1.0) and peaked 28 weeks after the bottom. In an amazing act of symmetry, we see that these last two Bear Cycles lasted for 52 weeks each. Since so far the moves are proportional, we cannot easily dismiss the probability of this '1st Rally Phase' being also 28 weeks and reaching as high as the 2.0 Fib, which is a little over $53k.
Beyond this, a year of basically ranged trading wouldn't be unrealistic, until the Halving 4 event (which is programmed for March 2024) that will inflict a huge supply shock and as it did in May 2020, initiate the final, mega parabolic rally of the Bull Cycle. That part of the previous Cycle, from the time BTC reached the 0.2 Fib until its November 2021 peak, lasted 124 weeks. The peak was achieved a little under the 5.0 Fibonacci extension.
A repeat of makes $300000 by October 2025 a plausible target. Does this reveal Bitcoin's true potential for this Cycle? Feel free to let us know in the comments section below!
-------------------------------------------------------------------------------
** Please LIKE 👍, FOLLOW ✅, SHARE 🙌 and COMMENT ✍ if you enjoy this idea! Also share your ideas and charts in the comments section below! **
-------------------------------------------------------------------------------
💸💸💸💸💸💸
👇 👇 👇 👇 👇 👇
Intraday BUY Bitcoin (06 APR 2023)BTCUSD intraday trading alert
3 simple steps to find a quality setup !
Risk Reward Ratio 1: 2
Anyone same idea with me?
BUY BTCUSD
Good luck traders..

BITCOIN About to wave goodbye to 30k for good if broken?Bitcoin (BTCUSD) is ahead of a critical breakthrough on the 1W time-frame. The former Support of the first half of the Bear Cycle is around 30k and is currently being tested. History has shown that when this level gets tested as a Resistance and breaks during the start of a new Bull Cycle, it never gets retested (cannot count the irregularity of a once in 100 years event like the COVID pandemic in March 2020.
At the same time time, when it breaks the 9°Lower Highs trend-line, the Parabolic Rally starts and doesn't look back. All this while the 1W LMACD is on perfect symmetry with the previous Support tests.
Are we about to wave 'bye bye' to 30k for good? Feel free to let us know in the comments section below!
-------------------------------------------------------------------------------
** Please LIKE 👍, FOLLOW ✅, SHARE 🙌 and COMMENT ✍ if you enjoy this idea! Also share your ideas and charts in the comments section below! **
-------------------------------------------------------------------------------
💸💸💸💸💸💸
👇 👇 👇 👇 👇 👇
