BTCUSD intraday trading & back to the home ⬇︎ 02 DEC 2022BTCUSD intraday trading alert
3 steps must fulfill before entry
1. 1st breakout done
2. Retracement done
3. 2nd breakout and see you in the home ⬇︎
More info in my profile..
Good luck traders..
Btcusdsignals

👀 BTCUSD insider buying 🤑👀 BTCUSD insider buying 🤑
the end of the year will be with a new maximum of $26,000 per coin.

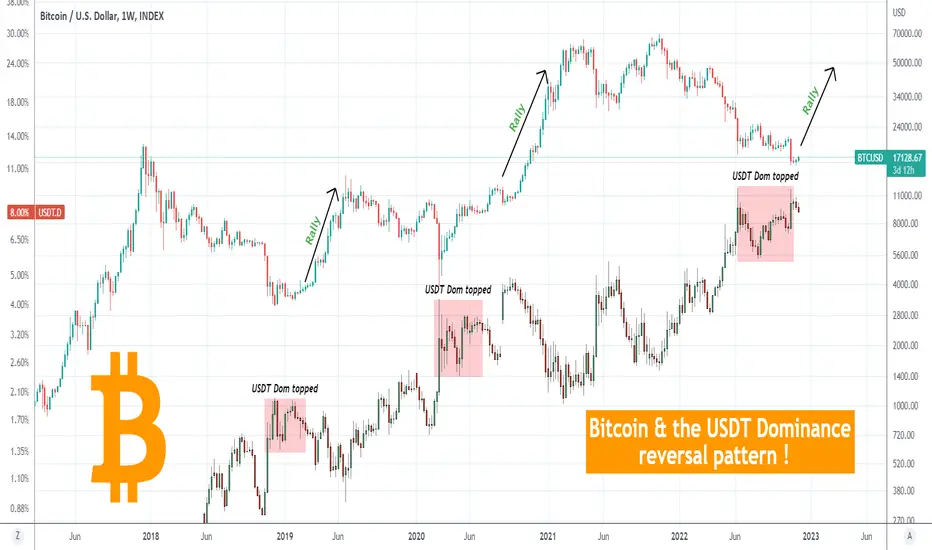
BITCOIN & the USDT Dominance point to a fast reversal!This is Bitcoin (BTCUSD) on the 1W time-frame drawn against the USDT dominance. For better comparison purposes both are displayed in candle bars, BTC being on top, USDT Dom at the bottom.
The essence of this comparison is to find a behavioral pattern that can help us estimate which phase of the Cycle BTC could be at. As you see, the USDT Dom is printing a pattern, technical top formation that has been previously associated with market bottoms on Bitcoin. In the past two weeks, the USDT Dom has started to pull-back and that very same sequence in July 2020 and February 2019 extended the drops, which was translated into an instant rally on Bitcoin. Even in the case of the August 31 2020 week and the injection that sent the USDT Dom (much) higher following the initial pull-back, the price quickly get back to its harmonized levels and fell back massively.
BTC has already started to react favorably to this 2-week USDT Dom pull-back. Do you think it can keep up this momentum and if this is indeed a USDT D. top are we ahead of a strong rally? Feel free to let me know in the comments section below!
-------------------------------------------------------------------------------
** Please LIKE 👍, SUBSCRIBE ✅, SHARE 🙌 and COMMENT ✍ if you enjoy this idea! Also share your ideas and charts in the comments section below! This is best way to keep it relevant, support me, keep the content here free and allow the idea to reach as many people as possible. **
-------------------------------------------------------------------------------
You may also TELL ME 🙋♀️🙋♂️ in the comments section which symbol you want me to analyze next and on which time-frame. The one with the most posts will be published tomorrow! 👏🎁
-------------------------------------------------------------------------------
💸💸💸💸💸💸
👇 👇 👇 👇 👇 👇
BITCOIN Weekly RSI has bottomed and leads the way to 19k first.This is Bitcoin (BTCUSD) on the 1W (weekly) time-frame. The focus is on the Bearish Megaphone that has been running since the April 12 2021 High, drawn on the weekly candle bodies, ignoring the wicks. This is the pattern that has been dominating the whole Bear Cycle since its beginning, with the October - November fake-out rally excluded as its was the peak of a stock market euphoria at the end of the post COVID quantitative easing.
As you see, since the FTX crash (November 07 2022 candle), BTC is trading sideways on the 3rd straight flat week ranging within 15550 - 17150. At the same time, the 1W RSI hit the top (Lower Highs trend-line) of the Bear Cycle's Falling Wedge, and has been rebounding. This could be an early indication that the long-term trend is shifting. On the short-term a potential rebound is limited to the Inner Lower Highs trend-line (dashed). The medium-term turns bullish only above the 1D MA200 (red trend-line), which has been intact for the whole year (since January 02 2022). If broken the medium-term targets are the 1W MA200 (orange trend-line) and 1W MA50 (blue trend-line).
On year-to-year basis, the target can be much higher. Look at how the current FTX Low was made on the -1.0 Fibonacci extension, counting from the first High and Low of the Bearish Megaphone. If the exact same symmetry plays out on the upside, then the 2.0 Fibonacci extension is located a little over $120000 (see chart below or narrow down the horizontal axis on the main chart).
Is this the start of a long-term bullish move for Bitcoin? Feel free to let me know in the comments section below!
-------------------------------------------------------------------------------
** Please LIKE 👍, SUBSCRIBE ✅, SHARE 🙌 and COMMENT ✍ if you enjoy this idea! Also share your ideas and charts in the comments section below! This is best way to keep it relevant, support me, keep the content here free and allow the idea to reach as many people as possible. **
-------------------------------------------------------------------------------
You may also TELL ME 🙋♀️🙋♂️ in the comments section which symbol you want me to analyze next and on which time-frame. The one with the most posts will be published tomorrow! 👏🎁
-------------------------------------------------------------------------------
💸💸💸💸💸💸
👇 👇 👇 👇 👇 👇

BITCOIN Targeting $18500 short-termSimple 1D time-frame analysis on Bitcoin (BTCUSD) showing that since the March 28 High, every drop was followed by a rebound to the 0.5 Fibonacci retracement level. Out of a total 3 occasions, in two of them the 0.5 Fib top matched by a 4H MA200 (orange trend-line) rejection.
Right the 4H MA200 is exactly on the 0.5 Fib at around $18500. Is that your short-term target? Feel free to let me know in the comments section below!
-------------------------------------------------------------------------------
** Please LIKE 👍, SUBSCRIBE ✅, SHARE 🙌 and COMMENT ✍ if you enjoy this idea! Also share your ideas and charts in the comments section below! This is best way to keep it relevant, support me, keep the content here free and allow the idea to reach as many people as possible. **
-------------------------------------------------------------------------------
You may also TELL ME 🙋♀️🙋♂️ in the comments section which symbol you want me to analyze next and on which time-frame. The one with the most posts will be published tomorrow! 👏🎁
-------------------------------------------------------------------------------
👇 👇 👇 👇 👇 👇
💸💸💸💸💸💸
👇 👇 👇 👇 👇 👇

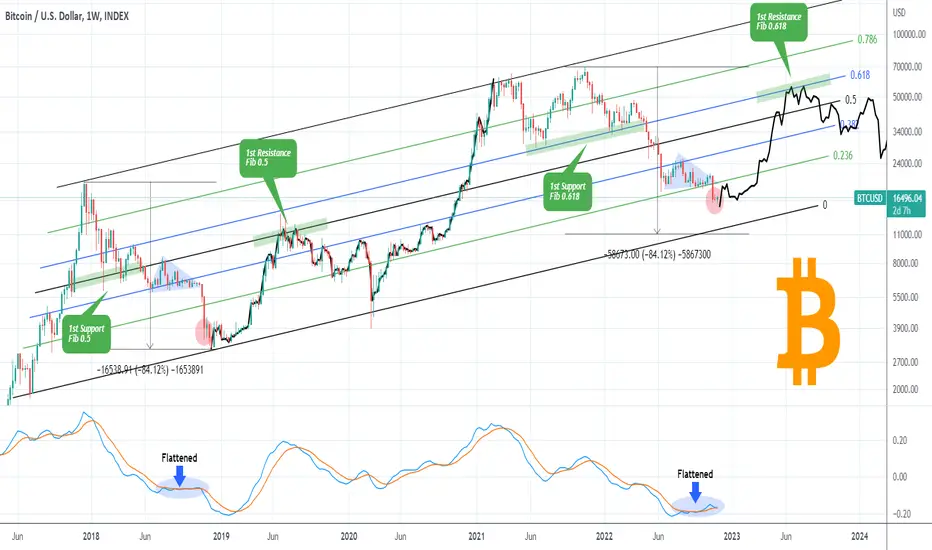
BITCOIN If this level holds, expect 50k on the next rally.This is an interesting finding on the 1W time-frame, showing Bitcoin (BTCUSD) within a Channel Up since December 2017 High (of the previous Cycle). Below we analyze frame by frame the similarities and differences, key pressure levels and how those can make a projection for the following months.
** Triangle.. then flush **
A key component of this is the pattern that preceded the FTX crash. As you see that was a Triangle (blue), with the FTX crash displayed by the strong 1W red candle that followed. Before that crash, the price was effectively supported on the 0.236 Fibonacci level. The very same Triangle was seen on the 2018 Bear Cycle, up until the week of November 12 2018. Two strong 1W red candles followed, which after a rather flat green, gave way to another two red weeks that priced the bottom. Notice that during both Triangles, the 1W LMACD flattened.
So far following the FTX candle, we've had another (flat) red and this week (so far) a green one. Relative to the 2018 fractal, the price should be proportionately positioned where the red circle is. This implicates that after the green 1W candle, another two red ones should follow and the bottom will be in.
How far those final red candles can go is anyone's guess but if they follow the (not so strong compared to 2018) FTX candle or even more so the flat 2nd red week that followed, then they could be rather limited in extent. This however goes in contrast to the total correction of the 2018 Bear Cycle, which was approximately -84%. A repeat of that magnitude would put BTC below the bottom (Higher Lows trend-line) of this long-term Channel Up, but the same took place on the week of March 09 2020, with the COVID flash crash, which broke the Channel's bottom rapidly on a wick and then rebounded almost instantly.
** The 1st Support - 1st Resistance pattern **
Another important aspect of this Channel is where the price had its 1st Support after the Top was made and the Bear Cycle started and where it found its 1st Resistance after the bottom and the start of the new Bull Cycle.
In early 2018, BTC had the 0.5 Fibonacci level as the 1st Support level that contained the downfall before the eventual sell-off to the Triangle. In 2021/22, that 1st Support level was on the 0.618 Fib. In 2019 the 1st Resistance level that put a stop to the first rally on the new Bull Cycle was again Fib 0.5, displaying a perfect symmetry. If the same pattern is continued, then the initial rally that will follow in the new Bull Cycle, should stop on the 0.618 Fib, i.e. slightly above $50000.
For a more effective comparison, we have plotted the 2019/20 sequence (black trend-line) on today's price action onwards. Not surprisingly, it is rejected on the 0.618 Fibonacci level, a little over $50k. That is of course, assuming that the next two weekly (1W) candles will be not as aggressive as in late 2018. If they are and the bottom of the Channel is hit, we can expect a bottom within $13000 - 12000.
Do you think we are very close to pricing the bottom and if so, is this model correct to predict 50k on the next rally? Feel free to let me know in the comments section below!
-------------------------------------------------------------------------------
** Please LIKE 👍, SUBSCRIBE ✅, SHARE 🙌 and COMMENT ✍ if you enjoy this idea! Also share your ideas and charts in the comments section below! This is best way to keep it relevant, support me, keep the content here free and allow the idea to reach as many people as possible. **
-------------------------------------------------------------------------------
You may also TELL ME 🙋♀️🙋♂️ in the comments section which symbol you want me to analyze next and on which time-frame. The one with the most posts will be published tomorrow! 👏🎁
-------------------------------------------------------------------------------
👇 👇 👇 👇 👇 👇
💸💸💸💸💸💸
👇 👇 👇 👇 👇 👇
BITCOIN $19000 and the importance of the Channel's medianSince the May 31 High and the subsequent sell-off, Bitcoin (BTCUSD) has been trading within a Channel Down pattern. We've plotted the Fibonacci retracement levels and the +/- 0.5 upper and lower extensions, in order to see potential pressure points/ levels.
As you see, the Channel's median (Fibonacci 0.5) has been dominating the price action with six so far (including the one three days ago) touches, all of which initiated rebounds. The 1D RSI and MACD (Bullish Cross) sequences indicate that the current consolidation on Fib 0.5 resembles that of August 28 - September 07. That pattern fueled a rebound that stopped just above the 1D MA50 (blue trend-line) and the 0.786 Fib. As long as the 0.5 Fib holds, the short-term target is the 0.786 Fib.
It is worth mentioning that the 1D MA200 (orange trend-line), unbroken since December 31 2021, is now closer than even to the Channel Down. A closing above it can potentially test the 1.5 Fibonacci extension of the Channel. On the other hand, two closing in a row below the 0.5, can target instantly the 0.236 Fib, even the bottom of the Channel.
Which way do you think Bitcoin will break to first? Top or Bottom of the Channel? Feel free to let me know in the comments section below!
-------------------------------------------------------------------------------
** Please LIKE 👍, SUBSCRIBE ✅, SHARE 🙌 and COMMENT ✍ if you enjoy this idea! Also share your ideas and charts in the comments section below! This is best way to keep it relevant, support me, keep the content here free and allow the idea to reach as many people as possible. **
-------------------------------------------------------------------------------
You may also TELL ME 🙋♀️🙋♂️ in the comments section which symbol you want me to analyze next and on which time-frame. The one with the most posts will be published tomorrow! 👏🎁
-------------------------------------------------------------------------------
👇 👇 👇 👇 👇 👇
💸💸💸💸💸💸
👇 👇 👇 👇 👇 👇

BITCOIN Huge volume signaling the end of the Bear Market?Two weeks ago, we saw the strongest weekly volume in more than a year, fueled by the collapse of FTX. This is a good opportunity to historically examine the effect of such huge volume spikes on Bitcoin (BTCUSD).
On this 1W chart, we see that such volume spikes tend to be associated with trend reversals on BTC. In recent price action in particular, we've had a similar volume spike on June 13 2022. Practically same volume spikes between a 5 month period. As this chart shows, volume spikes of such a period or shorter have historically been either Bottom or Top formations.
The previous such volume pattern was between January 11 2021 - May 17 2021 and was the formation of the Bull Cycle Top. The one before was between November 19 2018 - May 13 2019 and was the bottom formation of the Bear Cycle. Before that we've had the Bull Cycle Top formation of the December 18 2017 - February 05 2018 volume spikes. Finally the Bottom formation of the 2014/15 Bear Cycle was made on the January 12 2015 - November 02 2015 spikes.
The latter is the pattern that has the most similarities with the current one (June 13 - November 07 2022) as there is a Lower Highs (Bottom) trend-line involved. Can the November 07 volume spike be the moment that gives the trend reversal to bullish and get Bitcoin out of this two year Bear Cycle or is it simply a short-term rebound at best like the June 13 2022 and February 05 2018 volume spikes?
Feel free to let me know in the comments section below!
-------------------------------------------------------------------------------
** Please LIKE 👍, SUBSCRIBE ✅, SHARE 🙌 and COMMENT ✍ if you enjoy this idea! Also share your ideas and charts in the comments section below! This is best way to keep it relevant, support me, keep the content here free and allow the idea to reach as many people as possible. **
-------------------------------------------------------------------------------
You may also TELL ME 🙋♀️🙋♂️ in the comments section which symbol you want me to analyze next and on which time-frame. The one with the most posts will be published tomorrow! 👏🎁
-------------------------------------------------------------------------------
👇 👇 👇 👇 👇 👇
💸💸💸💸💸💸
👇 👇 👇 👇 👇 👇

BITCOIN The Fib-Dollar Cheat sheet says the bottom is formedThis analysis is centered around Bitcoin's (BTCUSD) Halvings and their important to the market due to the supply shock they fundamentally deal and have done so historically and the U.S. Dollar Index (DXY being the green trend-line). On this 1W time-frame, we've applied time and horizontal Fibonacci levels on each Halving Cycle, from start to end, to classify the different phases that BTC has traded and determine where we are at now (always based on the model).
** The Time Fibonacci levels **
As you see, the price tends to rally aggressively after each Halving (Fib 0.0) until Fib 0.236. We classify this as the Parabolic Phase.
From Fib 0.236 to 0.382, BTC tends to make the final rally and forms its Cycle Top. We classify this as the Top formation.
From Fib 0.382 to 0.5, BTC has officially entered Bear Market territory. We classify this as the Bear Phase.
From Fib 0.5 to 0.618, BTC is in the final staged of the Bear Cycle, preparing for its last (and most aggressive) fall. We classify this as the Despair Phase.
From Fib 0.618 to 0.786, BTC traditionally forms the Bottom of the Cycle, signaling the end of the Bear Market. We call this the Bottom formation phase.
From Fib 0.786 to 1.0 (next Halving), BTC officially starts the new Bull Market. Categorization: Bull.
** The horizontal Fibonacci levels **
Those are measured from the bottom of the Halving candle to the top of each Cycle. Those are mostly useful in calculating a potential bottom level. The first Cycle bottomed after the 0.382 Fib broke. The second Cycle bottomed after the 0.5 Fib broke (a Fib level lower than the previous Cycle), while the current Cycle has already broken Fib 0.618 (a Fib level lower than the previous Cycle).
Not surprisingly, this recent (FTX led) low is timed right within the 'Bottom formation' Phase (blue zone). In the 2018/19 Cycle, the price rebounded relatively early after the 'Bottom formation' Low, while in 2014/15 in did so towards its end. The phase's end is in May 2023.
** The Dollar's importance **
Among all the Fibs and classifications, the USD Index (DXY) plays its own highly important role during BTC's Cycles. Right now the DXY has been on a +1 month (aggressive) decline. Typically, as it is valued in USD, Bitcoin tends to rise when the DXY falls. The stop of USD's previous run was in March 2020, right on the COVID crash. What Bitcoin did then was bottom out and start the 2020/21 Parabolic rally. The previous USD top was on December 2016, when again Bitcoin was in its 'Parabolic Phase'. The USD's previous top was in March 2015, right at the start of the 2015 'Bottom formation' phase.
From all the about, we could reach a (always with a certain degree of error/risk) conclusion that the combination of a new (fundamentally led/ FTX) Low within the "Bottom formation" phase of this Halving Cycle, while the DXY is dropping aggressively, could be Bitcoin's new bottom. Whether the price rebounds now as in 2019 or twards the end of the phase as in 2015, it remains to be seen, and certainly depends on a lot of variable factors, most of which fundamental. Stability in the stock market is definitely among the top ones.
But what do you think? Has Bitcoin priced its new Cycle Bottom as this Halving model suggest, especially if the DXY is starting a new long-term decline? Or the global fundamentals are so strong that it will be invalidated? Feel free to let me know in the comments section below!
-------------------------------------------------------------------------------
** Please LIKE 👍, SUBSCRIBE ✅, SHARE 🙌 and COMMENT ✍ if you enjoy this idea! Also share your ideas and charts in the comments section below! This is best way to keep it relevant, support me, keep the content here free and allow the idea to reach as many people as possible. **
-------------------------------------------------------------------------------
You may also TELL ME 🙋♀️🙋♂️ in the comments section which symbol you want me to analyze next and on which time-frame. The one with the most posts will be published tomorrow! 👏🎁
-------------------------------------------------------------------------------
👇 👇 👇 👇 👇 👇
💸💸💸💸💸💸
👇 👇 👇 👇 👇 👇

BITCOIN Strongest sell signal since 2021! This time's different?Those who follow our channel for long, know that we like to look into Bitcoin (BTCUSD) on many different time-frames for a more all-around perspective. The 3D time-frame is one of the most accurate for long-term price projections and this time is no different as since last week its MACD formed a Bearish Cross.
As you see, since March 2021 we've had this formation another four times, all of which delivered a new Low. The September 16 2021 Cross was limited to 'only' a -18% drop but the other three delivered enormous -50%, -52% and -57% drops. A 'standard' (according to this model) -50% drop from today's Bearish Cross' candle would push the price down to a little below the $10000 barrier, a huge psychological level undoubtedly. Add to the mix that BTC got rejected on its 3D MA50 (blue trend-line) same it did in late March/ early April 2022 before the last MACD Bearish Cross and the -57% drop.
Now, what's different this time? The only parameter that differs is that in the past four events, the build-up to the Bearish Crosses was a Channel Up. This time it was a Channel Down. How important can that be and whether it can cause the opposite outcome (a rise), it remains to be seen. A good indication that this time it might be different would be if the price breaks above the Channel Down, thus the 3D MA50 (currently at 20386) as well.
What do you think? Are we about to see Bitcoin at $10k in the next 2 months or does the Channel Down signal the end of this bearish model? Feel free to let me know in the comments section below!
-------------------------------------------------------------------------------
** Please LIKE 👍, SUBSCRIBE ✅, SHARE 🙌 and COMMENT ✍ if you enjoy this idea! Also share your ideas and charts in the comments section below! This is best way to keep it relevant, support me, keep the content here free and allow the idea to reach as many people as possible. **
-------------------------------------------------------------------------------
You may also TELL ME 🙋♀️🙋♂️ in the comments section which symbol you want me to analyze next and on which time-frame. The one with the most posts will be published tomorrow! 👏🎁
-------------------------------------------------------------------------------
👇 👇 👇 👇 👇 👇
💸💸💸💸💸💸
👇 👇 👇 👇 👇 👇

BITCOIN Bollinger W rebounding, does it mean the bottom is near?Bitcoin (BTCUSD) on the 1W time-frame is flashing some bottom signals we can't ignore. The core of this post is the Bollinger Bands Width (BBW) indicator which rebounded on a level (blue line) that has historically preceded major rallies and market bottoms (circles).
The period that bears more resemblance with today is the BBW rebound that started on the week (1W candle) of November 12 2018. This was a strong red week, which was immediately followed by another, even stronger one. The bottom was made three weeks after on the Higher Lows trend-line (dashed) that was almost half the angle (16°) of the previous one (30°). If this is any pattern to follow, then the bottom of the current Cycle could be made on a 8° angle Higher Lows trend-line. All those lines start on the last major low before each Cycle Top. Keep in mind that depending on your screen's dimensions, the angles can change but they do so proportionally, so the analogy remains. In any case, on the current weekly candle, the Higher Lows trend-line has a downside limit (Support) around $14000. The more the price doesn't drop, the higher this level gets.
Is the bottom close?
Feel free to let me know in the comments section below!
-------------------------------------------------------------------------------
** Please LIKE 👍, SUBSCRIBE ✅, SHARE 🙌 and COMMENT ✍ if you enjoy this idea! Also share your ideas and charts in the comments section below! This is best way to keep it relevant, support me, keep the content here free and allow the idea to reach as many people as possible. **
-------------------------------------------------------------------------------
You may also TELL ME 🙋♀️🙋♂️ in the comments section which symbol you want me to analyze next and on which time-frame. The one with the most posts will be published tomorrow! 👏🎁
-------------------------------------------------------------------------------
👇 👇 👇 👇 👇 👇
💸💸💸💸💸💸
👇 👇 👇 👇 👇 👇

BTCUSD ( BITCOIN ) BTCUSD
- By now the OVERALL CRYPTO SENTIMENT has become NEGATIVE with the collapse of FTX to BTCUSD. Therefore, BTCUSD is being SELL.
- FUNDAMENTALLY THERE IS NO GOOD ENVIRONMENT FOR CRYPTO YET. But with the FED being NEUTRAL, CRYPTO can expect a good POSITIVE UP TREND in the future.
- US CPI DATA has been released by now, it is a very NEGATIVE DATA. Due to this BTC went UP with USD being WEAK. You can further BTC UP to 20654 LEVEL in this CHANNEL.
- If there is an UPSIDE BIAS in BTCUSD, 17950 LEVEL can be BUY in short term. Also, if the TREND LINE is BREAKED, 15632 LEVEL can be SELL in the near future.
- The BTCUSD CHAT is currently showing a growth of 0.42%. BTCUSD PRICE MOVEMENT will definitely be determined on SNP500. Therefore, every NEWS that is POSITIVE for STOCKS is very good POSITIVE NEWS for BTCUSD.

BITCOIN Is the FTX crash similar to 2015 Bitfinex??This is Bitcoin (BTCUSD) on the 1W time-frame, on the left displaying the 2021 - 2022 price action while on the right the 2014 - 2015. For the record we need to make clear that FTX crashed and filed for bankruptcy while Bitfinex on August 17 2015 experienced a flash crash. At the time, Bitfinex claimed to had the most liquid exchange but the flash crash was triggered when several leveraged positions were forcibly closed in close proximity to each other.
When both are put next to each other within their respective Bear Cycle parameters (1W MA20 = red trend-line, 1W MA50 = blue trend-line, 1W MA100 = green trend-line), we can identify some similarities so far, especially in terms of RSI and LMACD. The Bitfinex flash crash took the market 8 weeks to recover from and break above the 1W MA50 (blue trend-line). The FTX crash last week, didn't recover its 1W candle as fast as Bitfinex, so there is already a divergence and 'bad sign' if we can call it for a new low. Nonetheless, the current week, is so far on the green.
What do you think? Can the market recover the same way it did after the Bitfinex crash in August 2015? Feel free to let me know in the comments section below!
-------------------------------------------------------------------------------
** Please LIKE 👍, SUBSCRIBE ✅, SHARE 🙌 and COMMENT ✍ if you enjoy this idea! Also share your ideas and charts in the comments section below! This is best way to keep it relevant, support me, keep the content here free and allow the idea to reach as many people as possible. **
-------------------------------------------------------------------------------
You may also TELL ME 🙋♀️🙋♂️ in the comments section which symbol you want me to analyze next and on which time-frame. The one with the most posts will be published tomorrow! 👏🎁
-------------------------------------------------------------------------------
👇 👇 👇 👇 👇 👇
💸💸💸💸💸💸
👇 👇 👇 👇 👇 👇


BITCOIN Inflation down -0.5% a 9-month low! Is it truly Bullish?Bitcoin (BTCUSD) is having an initial bullish reaction before the U.S. session opens following a more than expected -0.5% drop on the U.S. CPI to 7.7% from 8.2% in the previous month. This reading beat the forecast by 0.3%. Is a drop to inflation truly bullish for BTC?
To answer this, we should look at the previous 3 times that the CPI had a monthly fall. Since August we basically have falling CPI each month:
* On August 10 the CPI fell to 8.5% from 9.1% the previous month.
* On September 13 the CPI fell to 8.3% from 8.5% the previous month.
* On October 13 the CPI fell to 8.2% from 8.3% the previous month.
* And today (on November 10 ) the CPI fell to 7.7% from 8.2% the previous month.
As we see on the chart, the August 10 CPI fall instead of a rise caused a massive drop on Bitcoin. The September 13 CPI fall also caused a drop on BTC instead of a rise, though less aggressive. The October 13 CPI fall though did start a rally but not as aggressive as one would expect, but reasonable considering the drop was only 0.1%.
That price action has kept Bitcoin within a Channel Down since the June 18 Low and yesterday the bottom was hit making a new Lower Low. This time though, the 1D RSI is rebounding after breaking yesterday below the 30.000 oversold level. The last two oversold 1D RSI readings caused short-term rallies (May and June-August) which are highlighted (black and yellow lines). Their projections are illustrated within the Channel Down, both showing a touch of the 1D MA200 (orange trend-line) in 4-5 weeks. If it happens, that would be the first 1D MA200 contact since January 02!
Do you think this huge monthly CPI drop will make Bitcoin fall and break below its Channel Down or rebound and test the 1D MA200? Feel free to let me know in the comments section below!
-------------------------------------------------------------------------------
** Please LIKE 👍, SUBSCRIBE ✅, SHARE 🙌 and COMMENT ✍ if you enjoy this idea! Also share your ideas and charts in the comments section below! This is best way to keep it relevant, support me, keep the content here free and allow the idea to reach as many people as possible. **
-------------------------------------------------------------------------------
You may also TELL ME 🙋♀️🙋♂️ in the comments section which symbol you want me to analyze next and on which time-frame. The one with the most posts will be published tomorrow! 👏🎁
-------------------------------------------------------------------------------
👇 👇 👇 👇 👇 👇
💸💸💸💸💸💸
👇 👇 👇 👇 👇 👇

Bitcoin Prediction H1Here is my view for BTCUSD on H1. The price could go down, you can put a pending order on the Order block or find an entry on LTF within OB Zone. Trade Safe!

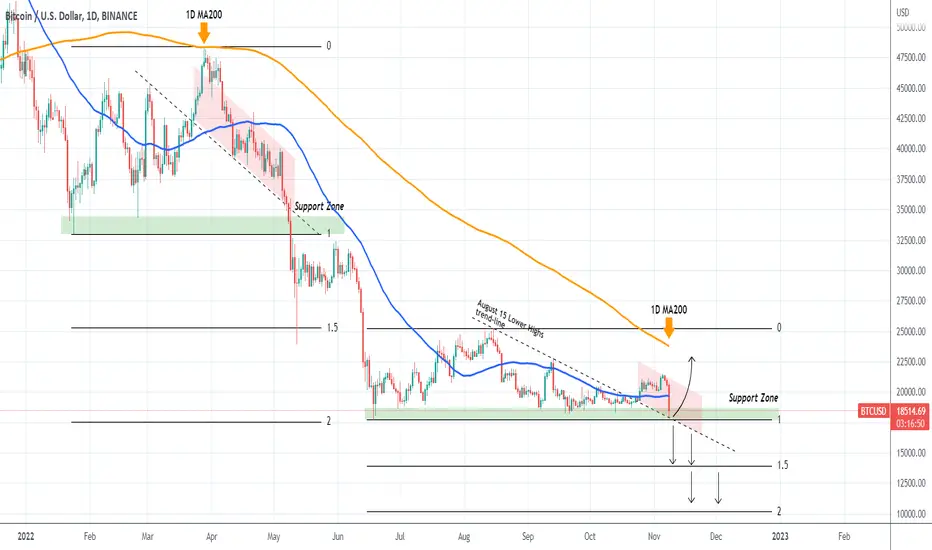
BITCOIN Nightmare fractal if this level breaksBitcoin (BTCUSD) is following the overall panic sentiment of the market after the Binance news and tested the Support Zone of the June 18 Low. A break below can set in motion a sell-off similar to that of May 09, which first hit the 1.5 Fibonacci extension and after some consolidation, moved to make the June 18 Low on the 2.0 Fibonacci extension.
What stood out then as the trigger of the sell-off was a Lower Highs trend-line that started on March 02 and then turned into Lower Lows that held the price action until the Support Zone. When it broke, the aggressive sell-off took place. On today's sequence, we have that (former) Lower Highs trend-line starting on the August 15 High, getting hit today on the Binance exchange.
A break below it can trigger that same massive sell-off with the 1.5 Fib extension being around 14000 and 2.0 around 10200. Another common characteristic of the two fractals is the fact that the 1D MA200 (orange trend-line) was never broken and acted as a Resistance. That means that technically only a break above it can invalidate this bearish pattern.
So what do you think? Can the former Lower Highs trend-line save the day? Feel free to let me know in the comments section below!
-------------------------------------------------------------------------------
** Please LIKE 👍, SUBSCRIBE ✅, SHARE 🙌 and COMMENT ✍ if you enjoy this idea! Also share your ideas and charts in the comments section below! This is best way to keep it relevant, support me, keep the content here free and allow the idea to reach as many people as possible. **
-------------------------------------------------------------------------------
You may also TELL ME 🙋♀️🙋♂️ in the comments section which symbol you want me to analyze next and on which time-frame. The one with the most posts will be published tomorrow! 👏🎁
-------------------------------------------------------------------------------
👇 👇 👇 👇 👇 👇
💸💸💸💸💸💸
👇 👇 👇 👇 👇 👇
BITCOIN Can the Adam & Eve pattern push the price to 29-34k?Despite today's drop, Bitcoin (BTCUSD) is still on its path of completing an Adam and Eve (A&E) pattern since the June crash, which is a formation consistent with market bottoms. In fact as we see on this analysis, which is made on the 1D time-frame, every market Bottom on BTC's previous Cycles was formed on a A&E pattern. Despite the different eras, even the RSI and MACD indicators seem quite consistent across those patterns.
Technically, the short-term target is the 1D MA200 (orange trend-line). The next is the 0.382 Fibonacci retracement level, which was the previous Support Zone during this Bear Cycle and is around $29700. But based on the A&E characteristics, the price can skyrocket by Q1 2023 as high as Eve's 2.0 Fib, which is around $34400.
Is this a realistic Target Zone for Bitcoin for the next 4 months? Feel free to let me know in the comments section below!
-------------------------------------------------------------------------------
** Please LIKE 👍, SUBSCRIBE ✅, SHARE 🙌 and COMMENT ✍ if you enjoy this idea! Also share your ideas and charts in the comments section below! This is best way to keep it relevant, support me, keep the content here free and allow the idea to reach as many people as possible. **
-------------------------------------------------------------------------------
You may also TELL ME 🙋♀️🙋♂️ in the comments section which symbol you want me to analyze next and on which time-frame. The one with the most posts will be published tomorrow! 👏🎁
-------------------------------------------------------------------------------
👇 👇 👇 👇 👇 👇
💸💸💸💸💸💸
👇 👇 👇 👇 👇 👇

BITCOIN Supertrend about to turn green after a year! Bottoms in?Bitcoin (BTCUSD) has been trading on a red (bearish) Supertrend on the 3D time-frame since November 2021, i.e. a year. If the price breaks above 23k, this very reliable indicator will turn green (bullish) again. On this time-frame in particular, it has the highest historic accuracy.
With inflation being the cause of this 2022 Bear Market so far (asset wide), a big part of it is Oil (black trend-line). In fact it is often the leading indicator of inflation. An extremely interesting correlation of Oil with BTC is that every time the Supertrend turned green after a Bear Cycle bottom, WTI Oil was already on a strong, counter trend (as the primary trend was bearish) rally after a Lower Lows bottom.
In ten years, this combination of parameters has always been the start of Bitcoin's new Bull Cycle. Oil has been on a bearish trend since March 2022 but posting a counter trend rally since the September low. Can this be the build-up to a Supertrend green reversal and a new BTC Bull Cycle? Feel free to let me know in the comments section below!
-------------------------------------------------------------------------------
** Please LIKE 👍, SUBSCRIBE ✅, SHARE 🙌 and COMMENT ✍ if you enjoy this idea! Also share your ideas and charts in the comments section below! This is best way to keep it relevant, support me, keep the content here free and allow the idea to reach as many people as possible. **
-------------------------------------------------------------------------------
You may also TELL ME 🙋♀️🙋♂️ in the comments section which symbol you want me to analyze next and on which time-frame. The one with the most posts will be published tomorrow! 👏🎁
-------------------------------------------------------------------------------
👇 👇 👇 👇 👇 👇
💸💸💸💸💸💸
👇 👇 👇 👇 👇 👇

BTCUSD top-down analysisHello traders, this is a complete multiple timeframe analysis of this pair. We see could find significant trading opportunities as per analysis upon price action confirmation we may take this trade. Smash the like button if you find value in this analysis and drop a comment if you have any questions or let me know which pair to cover in my next analysis.

BITCOIN Is LTC a leading indicator to BTC's Bull Cycle??This is a chart on the 1W time-frame of Bitcoin (BTCUSD) and Litecoin (LTCUSD). This is not the first time we do this analysis, those who follow for long will know that during the previous BTC Cycle, right when it was consolidating after the December 2018 bottom, we used LTC's price action to identify similarities with historic price runs.
And yes, in the past two Cycles, Litecoin has been an excellent leading indicator to Bitcoin, showing the way with a first rally into the market's new Bull Cycle. As you see on the chart, LTC right after the market bottom, tends to make an initial rally and diverge from BTC while it is still sideways (green zone). Shortly after, LTC explodes to the upside with a strong rally, while BTC only posts a small rise (blue zone). Right after this, the Bull Cycle begins officially.
Litecoin has been rising since mid October, diverging significantly from Bitcoin. We can claim that we are already in a new Green Zone as at the same time Bitcoin is trading sideways. Do you think this correlation will play out once more? And if so, should we expect a small rise for Bitcoin in the final two months of 2022 and a new Bull Cycle starting as early as next year? Feel free to let me know in the comments section below!
-------------------------------------------------------------------------------
** Please LIKE 👍, SUBSCRIBE ✅, SHARE 🙌 and COMMENT ✍ if you enjoy this idea! Also share your ideas and charts in the comments section below! This is best way to keep it relevant, support me, keep the content here free and allow the idea to reach as many people as possible. **
-------------------------------------------------------------------------------
You may also TELL ME 🙋♀️🙋♂️ in the comments section which symbol you want me to analyze next and on which time-frame. The one with the most posts will be published tomorrow! 👏🎁
-------------------------------------------------------------------------------
👇 👇 👇 👇 👇 👇
💸💸💸💸💸💸
👇 👇 👇 👇 👇 👇

BITCOIN Complete 1H analysis. Buy above this level only!Bitcoin (BTCUSD) is falling back after the Fed's +0.75% Rate Hike and Powell's press conference. From a technical perspective on the 1H time-frame, the price remains within a Channel Down pattern (blue) since the October 29 High but on the longer term within a Channel Up (dashed lines) since the October 13 Low.
We can see an interesting finding on this chart as this Channel Down is a recurring pattern since October 07. The price drops with the 1H MA50 (blue trend-line) as its Resistance and the catalyst that gives a confirmed signal to buy is a break above the 1H MA200 (orange trend-line). In remarkable fashion, both previous MA200 break-outs, gave an instant rise of +2.50%. Based on the 1H MA200's current level, a +2.50% rise would approach the $21000 mark.
Until the 1H MA200 breaks, the Channel Down would aim lower. A break below the Channel Up bottom (Higher Lows trend-line) can target Support (A) and further break-out Support (B) at 19240 and 18650 respectively. On the bull side, if the Channel Up extends fully to its Top to form a new Higher High, it can hit $22000.
Which break-out do you think will come first? Feel free to let me know in the comments section below!
-------------------------------------------------------------------------------
** Please LIKE 👍, SUBSCRIBE ✅, SHARE 🙌 and COMMENT ✍ if you enjoy this idea! Also share your ideas and charts in the comments section below! This is best way to keep it relevant, support me, keep the content here free and allow the idea to reach as many people as possible. **
-------------------------------------------------------------------------------
You may also TELL ME 🙋♀️🙋♂️ in the comments section which symbol you want me to analyze next and on which time-frame. The one with the most posts will be published tomorrow! 👏🎁
-------------------------------------------------------------------------------
👇 👇 👇 👇 👇 👇
💸💸💸💸💸💸
👇 👇 👇 👇 👇 👇

BTCUSD intraday trading & back to the home ⬇︎ 02 NOV 2022BTCUSD intraday trading alert
3 steps must fulfill before entry
1. 1st breakout done
2. Retracement done
3. 2nd breakout and see you in the home ⬇︎
More info in my profile..
Good luck traders..
