BITCOIN Can the Adam & Eve pattern push the price to 29-34k?Despite today's drop, Bitcoin (BTCUSD) is still on its path of completing an Adam and Eve (A&E) pattern since the June crash, which is a formation consistent with market bottoms. In fact as we see on this analysis, which is made on the 1D time-frame, every market Bottom on BTC's previous Cycles was formed on a A&E pattern. Despite the different eras, even the RSI and MACD indicators seem quite consistent across those patterns.
Technically, the short-term target is the 1D MA200 (orange trend-line). The next is the 0.382 Fibonacci retracement level, which was the previous Support Zone during this Bear Cycle and is around $29700. But based on the A&E characteristics, the price can skyrocket by Q1 2023 as high as Eve's 2.0 Fib, which is around $34400.
Is this a realistic Target Zone for Bitcoin for the next 4 months? Feel free to let me know in the comments section below!
-------------------------------------------------------------------------------
** Please LIKE 👍, SUBSCRIBE ✅, SHARE 🙌 and COMMENT ✍ if you enjoy this idea! Also share your ideas and charts in the comments section below! This is best way to keep it relevant, support me, keep the content here free and allow the idea to reach as many people as possible. **
-------------------------------------------------------------------------------
You may also TELL ME 🙋♀️🙋♂️ in the comments section which symbol you want me to analyze next and on which time-frame. The one with the most posts will be published tomorrow! 👏🎁
-------------------------------------------------------------------------------
👇 👇 👇 👇 👇 👇
💸💸💸💸💸💸
👇 👇 👇 👇 👇 👇
Btcusdsignals

BITCOIN Supertrend about to turn green after a year! Bottoms in?Bitcoin (BTCUSD) has been trading on a red (bearish) Supertrend on the 3D time-frame since November 2021, i.e. a year. If the price breaks above 23k, this very reliable indicator will turn green (bullish) again. On this time-frame in particular, it has the highest historic accuracy.
With inflation being the cause of this 2022 Bear Market so far (asset wide), a big part of it is Oil (black trend-line). In fact it is often the leading indicator of inflation. An extremely interesting correlation of Oil with BTC is that every time the Supertrend turned green after a Bear Cycle bottom, WTI Oil was already on a strong, counter trend (as the primary trend was bearish) rally after a Lower Lows bottom.
In ten years, this combination of parameters has always been the start of Bitcoin's new Bull Cycle. Oil has been on a bearish trend since March 2022 but posting a counter trend rally since the September low. Can this be the build-up to a Supertrend green reversal and a new BTC Bull Cycle? Feel free to let me know in the comments section below!
-------------------------------------------------------------------------------
** Please LIKE 👍, SUBSCRIBE ✅, SHARE 🙌 and COMMENT ✍ if you enjoy this idea! Also share your ideas and charts in the comments section below! This is best way to keep it relevant, support me, keep the content here free and allow the idea to reach as many people as possible. **
-------------------------------------------------------------------------------
You may also TELL ME 🙋♀️🙋♂️ in the comments section which symbol you want me to analyze next and on which time-frame. The one with the most posts will be published tomorrow! 👏🎁
-------------------------------------------------------------------------------
👇 👇 👇 👇 👇 👇
💸💸💸💸💸💸
👇 👇 👇 👇 👇 👇

BTCUSD top-down analysisHello traders, this is a complete multiple timeframe analysis of this pair. We see could find significant trading opportunities as per analysis upon price action confirmation we may take this trade. Smash the like button if you find value in this analysis and drop a comment if you have any questions or let me know which pair to cover in my next analysis.

BITCOIN Is LTC a leading indicator to BTC's Bull Cycle??This is a chart on the 1W time-frame of Bitcoin (BTCUSD) and Litecoin (LTCUSD). This is not the first time we do this analysis, those who follow for long will know that during the previous BTC Cycle, right when it was consolidating after the December 2018 bottom, we used LTC's price action to identify similarities with historic price runs.
And yes, in the past two Cycles, Litecoin has been an excellent leading indicator to Bitcoin, showing the way with a first rally into the market's new Bull Cycle. As you see on the chart, LTC right after the market bottom, tends to make an initial rally and diverge from BTC while it is still sideways (green zone). Shortly after, LTC explodes to the upside with a strong rally, while BTC only posts a small rise (blue zone). Right after this, the Bull Cycle begins officially.
Litecoin has been rising since mid October, diverging significantly from Bitcoin. We can claim that we are already in a new Green Zone as at the same time Bitcoin is trading sideways. Do you think this correlation will play out once more? And if so, should we expect a small rise for Bitcoin in the final two months of 2022 and a new Bull Cycle starting as early as next year? Feel free to let me know in the comments section below!
-------------------------------------------------------------------------------
** Please LIKE 👍, SUBSCRIBE ✅, SHARE 🙌 and COMMENT ✍ if you enjoy this idea! Also share your ideas and charts in the comments section below! This is best way to keep it relevant, support me, keep the content here free and allow the idea to reach as many people as possible. **
-------------------------------------------------------------------------------
You may also TELL ME 🙋♀️🙋♂️ in the comments section which symbol you want me to analyze next and on which time-frame. The one with the most posts will be published tomorrow! 👏🎁
-------------------------------------------------------------------------------
👇 👇 👇 👇 👇 👇
💸💸💸💸💸💸
👇 👇 👇 👇 👇 👇

BITCOIN Complete 1H analysis. Buy above this level only!Bitcoin (BTCUSD) is falling back after the Fed's +0.75% Rate Hike and Powell's press conference. From a technical perspective on the 1H time-frame, the price remains within a Channel Down pattern (blue) since the October 29 High but on the longer term within a Channel Up (dashed lines) since the October 13 Low.
We can see an interesting finding on this chart as this Channel Down is a recurring pattern since October 07. The price drops with the 1H MA50 (blue trend-line) as its Resistance and the catalyst that gives a confirmed signal to buy is a break above the 1H MA200 (orange trend-line). In remarkable fashion, both previous MA200 break-outs, gave an instant rise of +2.50%. Based on the 1H MA200's current level, a +2.50% rise would approach the $21000 mark.
Until the 1H MA200 breaks, the Channel Down would aim lower. A break below the Channel Up bottom (Higher Lows trend-line) can target Support (A) and further break-out Support (B) at 19240 and 18650 respectively. On the bull side, if the Channel Up extends fully to its Top to form a new Higher High, it can hit $22000.
Which break-out do you think will come first? Feel free to let me know in the comments section below!
-------------------------------------------------------------------------------
** Please LIKE 👍, SUBSCRIBE ✅, SHARE 🙌 and COMMENT ✍ if you enjoy this idea! Also share your ideas and charts in the comments section below! This is best way to keep it relevant, support me, keep the content here free and allow the idea to reach as many people as possible. **
-------------------------------------------------------------------------------
You may also TELL ME 🙋♀️🙋♂️ in the comments section which symbol you want me to analyze next and on which time-frame. The one with the most posts will be published tomorrow! 👏🎁
-------------------------------------------------------------------------------
👇 👇 👇 👇 👇 👇
💸💸💸💸💸💸
👇 👇 👇 👇 👇 👇

BTCUSD intraday trading & back to the home ⬇︎ 02 NOV 2022BTCUSD intraday trading alert
3 steps must fulfill before entry
1. 1st breakout done
2. Retracement done
3. 2nd breakout and see you in the home ⬇︎
More info in my profile..
Good luck traders..

BITCOIN Can it reach the 250-500k range based on the DXY Cycles?This is Bitcoin (BTCUSD) against the U.S. Dollar Index (DXY) on the monthly chart. It is obvious how the two are (naturally) negatively correlated. When the DXY rises (green channel), BTC enters a Bear Cycle (red channel), when the DXY trades sideways (blue), BTC accumulates and starts the new Bull Cycle (blue), when DXY falls (red), BTC registers the 1 year parabolic rally of the Bull Cycle (green).
Last month, the DXY closed its first red candle after 4 straight green months. If this is the top of DXY, based on this model we should see it turning sideways, prompting BTC into an Accumulation Phase (blue). What is really interesting is that since April 2015, we see a clear Pivot Zone for DXY, which the price always revisits. At the same time, BTC has its own Pivot Zone which also revolves around its previous two Accumulation Phases.
If the same pattern is repeated and DXY's pull-back of roughly -14% hits its Pivot Zone, then Bitcoin may register the top of its next Bull Cycle within a (wide indeed) range of 250k - 500k USD by late 2024/ early 2025.
How realistic can this scenario be? Feel free to let me know in the comments section below!
-------------------------------------------------------------------------------
** Please LIKE 👍, SUBSCRIBE ✅, SHARE 🙌 and COMMENT ✍ if you enjoy this idea! Also share your ideas and charts in the comments section below! This is best way to keep it relevant, support me, keep the content here free and allow the idea to reach as many people as possible. **
-------------------------------------------------------------------------------
You may also TELL ME 🙋♀️🙋♂️ in the comments section which symbol you want me to analyze next and on which time-frame. The one with the most posts will be published tomorrow! 👏🎁
-------------------------------------------------------------------------------
👇 👇 👇 👇 👇 👇
💸💸💸💸💸💸
👇 👇 👇 👇 👇 👇

BITCOIN Fibonacci charts the new Bull Cycle! It's already began!This is Bitcoin (BTCUSD) on the 1W time-frame displaying all of its Cycles historically. I've used the Fibonacci Channel extensions to identify any possible correlations and how this can create a roadmap moving forward and project the next Cycle. To start putting the chart's indicators into perspective, the 1W MA50 is the blue trend-line, the 1W MA200 the orange, the 1W MA300 the red, while the yellow represents the Multiple 5 and the green the Multiple 6 of the Fib MA's.
** The next High **
For starters, I've made several publications on why the +.382 (horizontal) Fibonacci extension roughly calculates the Highs. I've plotted that on this chart again and as you see so far the 2.382 Fibonacci extension has roughly predicted the December 2013 High while the 3.382 extension, the December 2017 High. The previous Cycle though broke that progression and topped on the 3.786 Fib extension instead. This means that the top of the next Cycle doesn't have to be on the 4.382 Fib extension (roughly at $350k) but most likely will be in the lower 4.236 (230k) or even 4.0 (120k) tier.
** The Fibonacci Channel extensions **
But let's circle back to how the Fibonacci Channel extensions can relate to these patterns. As you see, the first two Cycle Highs have been (naturally for the first) on the 0.0 Fib with bottoms outside of the 0.5 Fib. The High of the next Cycle was on the 0.5 Fib with the Low outside of the 1.0 Fib. The Highs of April 2021 and November 2021 were outside of Fib 1.0 and the Low of June 2022, closer to the middle of the 1.5 Fibonacci extension of the Channel.
This pattern, though not perfect, it shapes fairly well Bitcoin's parabolic path over the years. Based on that, the next High should be either on or on the left of Fibonacci Channel extension 1.5 but most likely after its middle and the Low either on or left of extension 2.0 (probably middle).
** The Triangles and the bottom based on LMACD **
Notice also that all Cycles have traded inside an Ascending Triangle pattern until they hit their prior (All Time) High, and after turned parabolic for some months to complete the Cycle's Top.
As for those who are unsure if June was the bottom and if a new Bull Cycle now is not plausible amidst the current high interest and inflationary fundamentals, they can seek answers, only technically, on the 1W LMACD. As you see, we have completed the Ultimate Bottom Pattern: Formed a Bullish Cross and after a red rising histogram narrowed down, it has turned into green territory. MACD-wise, there isn't any other condition left to fill.
So if the bottom is in, is a top by late 2024 a wild projection to make? Can those Fibonacci Channel extensions identify the logarithmic path of Bitcoin and if so is $120k, $230k or $350k the next top? Feel free to let me know in the comments section below!
-------------------------------------------------------------------------------
** Please LIKE 👍, SUBSCRIBE ✅, SHARE 🙌 and COMMENT ✍ if you enjoy this idea! Also share your ideas and charts in the comments section below! This is best way to keep it relevant, support me, keep the content here free and allow the idea to reach as many people as possible. **
-------------------------------------------------------------------------------
You may also TELL ME 🙋♀️🙋♂️ in the comments section which symbol you want me to analyze next and on which time-frame. The one with the most posts will be published tomorrow! 👏🎁
-------------------------------------------------------------------------------
👇 👇 👇 👇 👇 👇
💸💸💸💸💸💸
👇 👇 👇 👇 👇 👇

BITCOIN: Can hit 24k next month. Major breakout on 1D RSI/ MA100Bitcoin hit the 1D MA100 (green) last week for the first time in 1.5 month with the 1D RSI crossing above the Lower Highs trendline that started on January 05 2021.
We have seen similar RSI Lower Highs breakouts in all previous Bear Cycles, namely on February 16 2019 and June 13 2015. Common characteristic is that the RSI breakout happened at the same time with a breaking above the 1D MA50 (blue) and caused an instant test of the 1D MA100. It took 15 days in 2015 and 40 days approximately in 2019 to reach (and break with ease) the 1D MA200 (orange).
Based on the above Bear Cycle bottom occurence, we should be expecting a test (and break) of the 1D MA200 next month, which is now at 24,665. Thumbs up if you agree!
## If you like our free content follow our profile to get more daily ideas. ##
## Comments and likes are greatly appreciated. ##
## Also DONATIONS through TradingView coins help our cause of increasing the daily ideas put here for free and reach out more traders like you. ##

BITCOIN The winning signal for the new Bull Cycle!This is Bitcoin (BTCUSD) on the 1W time-frame, where we will be basically adding elements and making an extension of our June 17 idea that projected the bottom on the 1W MA300 (red trend-line):
As you see, BTC hit the 1W MA300, the Ultimate Support Band as we called it and since then traded sideways in our designated Bottom Phase. On the current analysis, we are taking a slightly different approach, still focusing around the Halvings but also introducing new key Resistance trend-lines as well as the the element of the Vortex Indicator (VI).
** The ATH Lower Highs and 1D MA50 test **
The price is having a bullish week so far that took a stop yesterday. Still, we don't have a major break-out yet, as it is not only below the 1D MA200 (orange trend-line) but the 1D MA50 (blue trend-line) as well. The chart shows that the first major bullish break-out in Bitcoin's past Bear Cycles occurred when the price broke above the All Time High (ATH) Lower Highs trend-line, after which it immediately tested the 1D MA50. The 1D MA50 typically broke after some consolidation.
** The Vortex Indicator signal **
A critical indicator that basically confirmed the ATH Lower Highs break-out was when the 1W Vortex Indicator (VI) made a Bearish Cross (red line crossing below the blue). In past Cycles this Cross took place right on the LH break-out, practically calling for the 1D MA50 test next. We can see that the past two Cycles made the LH break-out 55 weeks on average before the next Halving. The next Halving (no 4) will be in early March 2024. That gives us a projected range for the LH break-out and 1D MA50 test within the Jan 30 2023 and Feb 27 2023 1W candles. With the VI diverging from a Cross, it confirms so far this scenario.
Do you agree with the above model? Is a break above the ATH Lower Highs the roadmap to follow into the new Bull Cycle and if yes will it come when the model predicts or earlier if the VI makes a Bearish Cross? Feel free to let me know in the comments section below!
-------------------------------------------------------------------------------
** Please LIKE 👍, SUBSCRIBE ✅, SHARE 🙌 and COMMENT ✍ if you enjoy this idea! Also share your ideas and charts in the comments section below! This is best way to keep it relevant, support me, keep the content here free and allow the idea to reach as many people as possible. **
-------------------------------------------------------------------------------
You may also TELL ME 🙋♀️🙋♂️ in the comments section which symbol you want me to analyze next and on which time-frame. The one with the most posts will be published tomorrow! 👏🎁
-------------------------------------------------------------------------------
👇 👇 👇 👇 👇 👇
💸💸💸💸💸💸
👇 👇 👇 👇 👇 👇

Bitcoin Chart H4Here is my view for BTCUSD on H4. The price could go up, you can put a pending order on the Order block or find an entry on LTF within OB Zone. Trade Safe!

BITCOIN Close to invalidating the doomsday scenario!Bitcoin (BTCUSD) is having an impressive two-day bullish stretch as it is up +8.00% from yesterday's Low. The first key development that this price action gave us is that it broke above the Lower Highs trend-line that started on the August 15 High and as we mentioned 2 weeks ago on the following post, was dictating the pace of this corrective wave:
Now the price broke above even the 20600 Symmetrical Resistance and is about to test the 1D MA100 (green trend-line) for the first time since September 13. This alone is a major buy signal.
** The Doomsday Scenario **
What is perhaps the most important outcome of this 2-day rise, is that Bitcoin diverged from the bearish pattern of the 2018/19 Bear Cycle (black trend-line) that was what we called the 'Doomsday Scenario' as it suggested that the price action since the mid-June 2022 Low was a sideways movement similar to July - November 2019 that eventually led to the final Bear Cycle flush that formed the mid-December 2018 Bottom.
** The 1D MA100 **
The chart on the right is the 2018/19 price action and the one on the left is the 2021/22 period. As you see, we've plotted the 2018/19 fractal on the 2022 sequence and up until yesterday's rise, the pattern were almost an exact match. If the current divergence closes the week above the 1D MA100, then most likely than not, the Doomsday Scenario is invalidated and BTC won't make a 2018 type collapse.
** The 1D RSI **
It is worth paying attention to the 1D RSI, which broke today its Lower Highs trend-line. The same Lower Highs break on February 08 2019, was followed with a break above the 1D MA100. After that, the 1D MA200 (orange trend-line) was hit in 5 weeks and a very aggressive rally started until late June 2019 that was supported by an unbroken 1D MA50 (blue trend-line).
Do you think that Bitcoin's divergence from the 2018/19 fractal is an early signal that the Doomsday Scenario got invalidated and a closing above the 1D MA100 will confirm it? And if yes, will it start a similar 4 month rally? Feel free to let me know in the comments section below!
-------------------------------------------------------------------------------
** Please LIKE 👍, SUBSCRIBE ✅, SHARE 🙌 and COMMENT ✍ if you enjoy this idea! Also share your ideas and charts in the comments section below! This is best way to keep it relevant, support me, keep the content here free and allow the idea to reach as many people as possible. **
-------------------------------------------------------------------------------
You may also TELL ME 🙋♀️🙋♂️ in the comments section which symbol you want me to analyze next and on which time-frame. The one with the most posts will be published tomorrow! 👏🎁
-------------------------------------------------------------------------------
👇 👇 👇 👇 👇 👇
💸💸💸💸💸💸
👇 👇 👇 👇 👇 👇

BITCOIN Can this pattern that has never failed before, fail?This chart represents Bitcoin (BTCUSD) on the 1W time-frame. With the price action sideways for a whole month, holding the 1W MA300 (red trend-line) as Support, comparisons with past Cycles in order to determine whether we've priced the bottom or not, are inevitable.
The comparison of the current Bear Cycle to the past two, leaves us with one main impression: how similar they've been (so far). The 'so far' narrative may be coming to an end as the only thing that BTC has left to do to complete the full package of similarities is break above the 1W MA50 (blue trend-line). Apart from that, the 1W MA300 (as mentioned) is holding, which did in both previous Cycles and more importantly, the LMACD is past its Bullish Cross formed in late September and has started to open the gap and trend upwards. Notice how all LMACD crossed were formed while the MA50 crossed below the MA100 (green trend-line) to form a Bearish Cross and how the 1W RSI Historic Support Zone was once again respected. As you see during all Cycles, the RSI has bounced on that Support Zone right after Bitcoin formed its bottom.
For a more accurate illustration of the comparison between all three Cycles, I have plotted the past two Bear Cycles (Grey = 2014/15 and Black = 2018/19) on the current one (Blue = 2021/22). The symmetry on the pattern followed is evident. The cyclical correlation tends to become stronger right before the Final Drop and straight after the bottom is formed. Then the Cycles diverge again as some are more aggressive than others (fundamentals involved). This graph shows that the current Cycle is lagging a bit as it has been consolidating for too long but still holds a tight resemblance especially with the 2014/15 Cycle.
Does this mean that Bitcoin is ready to rebound hard towards the 1W MA50? What do you think? Feel free to let me know in the comments section below!
-------------------------------------------------------------------------------
** Please LIKE 👍, SUBSCRIBE ✅, SHARE 🙌 and COMMENT ✍ if you enjoy this idea! Also share your ideas and charts in the comments section below! This is best way to keep it relevant, support me, keep the content here free and allow the idea to reach as many people as possible. **
-------------------------------------------------------------------------------
You may also TELL ME 🙋♀️🙋♂️ in the comments section which symbol you want me to analyze next and on which time-frame. The one with the most posts will be published tomorrow! 👏🎁
-------------------------------------------------------------------------------
👇 👇 👇 👇 👇 👇
💸💸💸💸💸💸
👇 👇 👇 👇 👇 👇

BITCOIN All bullish signals aligned but one last crucial remainsBitcoin (BTCUSD) has been consolidating throughout the whole month of October so far and as the short-term direction is neutral, it is useful to look again on the long-term charts to get a better understanding of where we might be at compared to previous Cycles.
** The 2W MA150 supporting **
This time I bring you this analysis on the 2W time-frame. Key points here to create a framework: The 2W MA150 (yellow trend-line) has made contact with the price and supported the Bear Cycle since the 2014/15 Bear Cycle. As you see the candles that have made contact so far are Jan 05 2015, Aug 17 2015, March 02 2020 and the current one. Basically this trend-line has been providing an almost flat Support since the crash of early June.
** The MA10 & MA50 **
It is common on both 2 previous Bear Cycles as well as the current one so far, that the price trades below the 2W MA10 (red trend-line), throughout the whole Cycle. In the past two, when it broke above it, a strong (initial) Bull Cycle rally took place.
The 2W MA50 (blue trend-line) also plays its part. Every time the 2W MA10 crossed below the 2W MA50 (Bearish Cross), the market formed its Bottom. That happened on the recent price flush in June. When the opposite cross took place (MA10/MA50 Bullish Cross), Bitcoin had already confirmed the start of its new Bull Cycle.
** The final crucial signal that remains **
At the moment, the price has been practically stuck within the 2W MA10 and 2W MA150 since the mid-August High. A break above the 2W MA10 would be an early rally sign. In the past two Cycles, this MA10 break-out has coincided with the LMACD forming a Bullish Cross. Basically that tends to confirm the new Bull Cycle and we can claim that it is the final signal that remains. At the moment it would appear that BTC is a minimum of 2 months away from an LMACD Bullish Cross. However, it would be hard to imagine the price staying flat for such a long time but the RSI, as long as it stays on Higher Lows, shows that the price action can tolerate this.
Do you think history will repeat itself and make Bitcoin rally with a break above the 2W MA10 and an LAMCD Bullish Cross? Or a break below the 2W MA150 will invalidate this cyclical pattern for good? Feel free to let me know in the comments section below!
-------------------------------------------------------------------------------
** Please LIKE 👍, SUBSCRIBE ✅, SHARE 🙌 and COMMENT ✍ if you enjoy this idea! Also share your ideas and charts in the comments section below! This is best way to keep it relevant, support me, keep the content here free and allow the idea to reach as many people as possible. **
-------------------------------------------------------------------------------
You may also TELL ME 🙋♀️🙋♂️ in the comments section which symbol you want me to analyze next and on which time-frame. The one with the most posts will be published tomorrow! 👏🎁
-------------------------------------------------------------------------------
👇 👇 👇 👇 👇 👇
💸💸💸💸💸💸
👇 👇 👇 👇 👇 👇

BITCOIN The Cyclical Bearish signal of the RSI*** ***
For this particular analysis on Bitcoin we are using the BTCUSDT symbol on the OKX exchange.
*** ***
The idea is on the 1D time-frame where Bitcoin ( BTCUSD ) is about to confirm or invalidate a very accurate signal provided by the RSI throughout the whole 2022.
As you see, the RSI is currently supported on a Higher Lows trend-line that started on the September 06 Low. Throughout the year, when the RSI broke below similar Higher Lows structures, Bitcoin's price dropped sharply. What is even more interesting is that the previous two RSI break-outs happened exactly 64 days since the previous one. This is the first difference from that (otherwise) very consistent pattern: Bitcoin is currently 5 days past that 64 day strike level (October 15).
This could be an early sign of a potential invalidation of this Cyclical pattern. I call it Cyclical because see how harmonically the Sine Waves guide the price action. But let's not draw the attention away from the RSI which is the key of this pattern. As long as it trades above the Higher Lows trend-line, the probabilities of invalidation get stronger. Perhaps for a pattern change a strike level can be used and this might be if the price closes above the 1D MA100 (green trend-line), which has been the Resistance since early April. If on the other hand, the RSI breaks below the Higher Lows trend-line, then the Cyclical Bearish pattern is confirmed and we should be expecting a considerably lower price.
For comparison purposes I have plotted the previous three sharp drops (grey, yellow and blue trend-lines) after the RSI break-down on the current price action. Pick your poison in that case. By the way, the LMACD indicator also gives an early sell warning on this Cyclical pattern and that is when the histogram attempts to get narrower. We have started such a sequence in the past 10 days.
So how useful do you think this RSI Cyclical pattern is? Do you think it will be confirmed for the 4th time in a row or invalidated above the 1D MA100 and practically establish the new Bull Cycle? Feel free to let me know in the comments section below!
-------------------------------------------------------------------------------
** Please LIKE 👍, SUBSCRIBE ✅, SHARE 🙌 and COMMENT ✍ if you enjoy this idea! Also share your ideas and charts in the comments section below! This is best way to keep it relevant, support me, keep the content here free and allow the idea to reach as many people as possible. **
-------------------------------------------------------------------------------
You may also TELL ME 🙋♀️🙋♂️ in the comments section which symbol you want me to analyze next and on which time-frame. The one with the most posts will be published tomorrow! 👏🎁
-------------------------------------------------------------------------------
👇 👇 👇 👇 👇 👇
💸💸💸💸💸💸
👇 👇 👇 👇 👇 👇

BITCOIN The last stand for Bulls. Failure will be catastrophic!Bitcoin (BTCUSD) is getting at that point where, based on its previous two Cycles, will provide a decisive move in the next weeks, as presented to you on this 1W time-frame analysis. The three charts represent Bitcoin's three Bear Cycles: 2021/22, 2018/19 and 2014/15 as they appear from left to right.
The LMACD indicator (logarithmic MACD) is what makes most of the difference at this point we are at, as in the past three weeks, it histogram has broken above the 0.00 level for the first time since March. With the Bullish Cross also taking place in October and the red histogram ascending, all this is consistent with the phases of the past Bear Cycles right after their Bottom and right before a rally to the 1W MA50 (blue trend-line) took place.
The price hasn't yet broken above the 1W MA20 (orange trend-line) but the 1W MA50/100 Bearish Cross was formed last month and that was always past the Bottom of the previous Bear Cycles. As you see the 1W MA300 (red trend-line) was always the major Support during Bear Cycles.
Do you expect a strong rebound towards the 1W MA50 in the coming weeks as per this Cycle Comparison Analysis or a closing deep below the 1W MA300 will unleash catastrophic consequences? Feel free to let me know in the comments section below!
-------------------------------------------------------------------------------
** Please LIKE 👍, SUBSCRIBE ✅, SHARE 🙌 and COMMENT ✍ if you enjoy this idea! Also share your ideas and charts in the comments section below! This is best way to keep it relevant, support me, keep the content here free and allow the idea to reach as many people as possible. **
-------------------------------------------------------------------------------
You may also TELL ME 🙋♀️🙋♂️ in the comments section which symbol you want me to analyze next and on which time-frame. The one with the most posts will be published tomorrow! 👏🎁
-------------------------------------------------------------------------------
👇 👇 👇 👇 👇 👇
💸💸💸💸💸💸
👇 👇 👇 👇 👇 👇

BITCOIN: USD rejected on 2008 Resistance. Turning point for BTC?Following the CPI release this week, the 3rd straight month of decreasing numbers with potentially high implications on the USD, I thought it would be relevant to look at the U.S. Dollar Index (DXY) and how it's current state can affect Bitcoin (BTCUSD) relative to key turning points and correlations of the past.
** Bitcoin's Bull and Bear against the Dollar **
The chart on the top displays Bitcoin with the Green Channel being a Bull Phase, the Red Channel being a Bear Cycle and the Blue Rectangle predominantly an Accumulation Phase straight after the Bear Cycle where investors bought at a low price in preparation of the Bull Cycle.
The chart on the bottom displays the Dollar Index with the Green Channel being a Rally Phase, the Red Channel a Decline Phase and the Blue Rectangle sideways movement/ consolidation. What is perhaps more critical on this 14 year chart, is the Higher Highs trend-line that started during the 2008 Housing Crisis and where DXY has been so far rejected 4 times, including the most recent hit on the weekly (1W) candle of September 26 2022.
** The 2008 Housing Crisis trend-line **
This trend-line is where the Dollar Rallies historically ended. What followed was either a consolidation phase or a decline. And as you see (and I am sure you are well aware of), the Dollar is negatively correlated with Bitcoin, meaning that (typically) when the USD trends towards one direction, Bitcoin trends towards the opposite. This is quite evident on this comparison chart. Red phases on the DXY are typically the Final Parabolic Rallies on BTC's Bull Cycles while Green phases on the DXY take place during BTC's Bear Cycles.
** Are we at a turning point? **
This is exactly where we are at now. The DXY has been on its strongest multi-month rally of recent times (Green) while Bitcoin is having its traditional Bear Cycle. With the DXY hitting its 2008 Higher Highs trend-line, the probability of a reversal gets stronger. The last two times the 2008 trend-line got hit, Bitcoin ended a Bear Cycle (January 2015) and started a Final Parabolic Rally (January 2017). As a result the probability of Bitcoin making a Bear Cycle bottom here increases. It is more likely to see an Accumulation Phase (blue) next as the Dollar tends to consolidate after such Rallies end.
But what do you think? Will DXY stay below its 2008 Higher Highs trend-line and reverse, giving Bitcoin a bottom or it will break above it and invalidate this historic pattern, sending Bitcoin even lower and changing the narrative? Feel free to let me know in the comments section below!
P.S. Snapshot of the chart below, in case it doesn't show up proportionally on your browser:
-------------------------------------------------------------------------------
** Please LIKE 👍, SUBSCRIBE ✅, SHARE 🙌 and COMMENT ✍ if you enjoy this idea! Also share your ideas and charts in the comments section below! This is best way to keep it relevant, support me, keep the content here free and allow the idea to reach as many people as possible. **
-------------------------------------------------------------------------------
You may also TELL ME 🙋♀️🙋♂️ in the comments section which symbol you want me to analyze next and on which time-frame. The one with the most posts will be published tomorrow! 👏🎁
-------------------------------------------------------------------------------
👇 👇 👇 👇 👇 👇
💸💸💸💸💸💸
👇 👇 👇 👇 👇 👇

BTC Weekend UpdateBTC got rejection from 19500$ level, price saw a good spike in price but it did not able to sustain it. Next support 18500$ to 18300$.. For a good upside move it need to close above 19500$👆 to march upward...
H1 Resistance level is marked at 41.92% to 41.86% level from where the price action got rejected and and went down As the volume decrease in bitcoin which is why the decrease in the price we are seeing
However, The price action is still consolidating in Daily Horizontal Resistance zone on Daily timeframe
main resistance area $20400 to $20750
main support area $18250 to $19300
DYOR and As always, stay safe

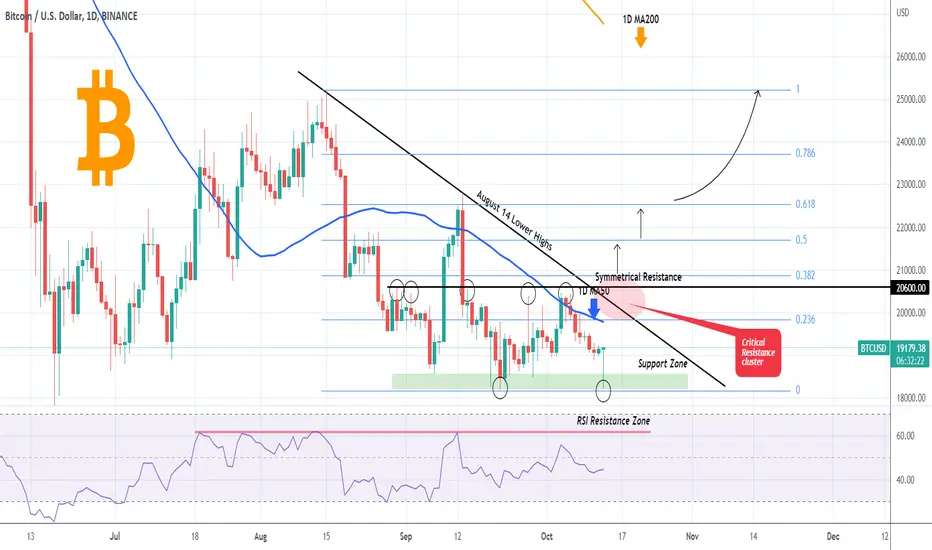
BITCOIN Today's CPI rebound may change the narrative.Bitcoin is rebounding massively on its September Support Zone following the CPI release despite a higher than expected reading. Being still lower than the previous month, the markets strong defense reaction on this Support level may change the bearish narrative of the past two months.
The immediate Resistance level is the 1D MA50 (blue trend-line) but the difference maker will be a break or rejection on the August 14 Lower Highs trend-line and the 20600 Symmetrical Resistance, which as we mentioned on last week's analysis shown below, has rejected the price 5 times in just over a month:
A break above this highly important Resistance Cluster, can set in motion bullish break-outs that can target the upper Fibonacci retracement levels one by one all the way towards the critical long-term 1D MA200 (orange trend-line) test. On the other hand a closing below the Support Zone, would probably be translated into a break below the 1W MA300, which has been holding since the June low. Below that level, 16000, 14000 even 12000 is possible before Bitcoin bottoms.
Which scenario do you think will prevail? Feel free to let me know in the comments section below!
-------------------------------------------------------------------------------
** Please LIKE 👍, SUBSCRIBE ✅, SHARE 🙌 and COMMENT ✍ if you enjoy this idea! Also share your ideas and charts in the comments section below! This is best way to keep it relevant, support me, keep the content here free and allow the idea to reach as many people as possible. **
-------------------------------------------------------------------------------
You may also TELL ME 🙋♀️🙋♂️ in the comments section which symbol you want me to analyze next and on which time-frame. The one with the most posts will be published tomorrow! 👏🎁
-------------------------------------------------------------------------------
👇 👇 👇 👇 👇 👇
💸💸💸💸💸💸
👇 👇 👇 👇 👇 👇
BTCUSD intraday trading & back to the home ⬇︎ 13 OCT 2022BTCUSD intraday trading alert
3 steps must fulfill before entry
1. 1st breakout done
2. Retracement done
3. 2nd breakout and see you in the home ⬇︎
More info in my profile..
Good luck traders..

BITCOIN 2021 RSI fractal points lowerAs Bitcoin (BTCUSD) is struggling to break above the Lower Highs trend-line that started after its November 2021 All Time High (ATH), the RSI on the 1D time-frame has been printing (since June) a sequence similar to that of mid-July - early-Nov 2021.
As you see with the candle comparisons (orange for 2021 and blue for 2022), even though the RSI patterns were fairly similar during their course, the candle patterns diverged halfway through as 2021 was an (aggressive) uptrend while post mid-June 2022 has been a consolidation so far.
Regardless of that and as Bitcoin is being rejected yet again on its ATH Lower Highs, does this mean we are on the verge of another sell-off? The RSI certainly points that way. Feel free to let me know in the comments section below!
-------------------------------------------------------------------------------
** Please LIKE 👍, SUBSCRIBE ✅, SHARE 🙌 and COMMENT ✍ if you enjoy this idea! Also share your ideas and charts in the comments section below! This is best way to keep it relevant, support me, keep the content here free and allow the idea to reach as many people as possible. **
-------------------------------------------------------------------------------
You may also TELL ME 🙋♀️🙋♂️ in the comments section which symbol you want me to analyze next and on which time-frame. The one with the most posts will be published tomorrow! 👏🎁
-------------------------------------------------------------------------------
👇 👇 👇 👇 👇 👇
💸💸💸💸💸💸
👇 👇 👇 👇 👇 👇

BITCOIN Break or fail on the November 2021 Resistance??This is Bitcoin (BTCUSD) on the 1D time-frame where we might be having perhaps the biggest development of the current Cycle. What do I mean by that? Well the 2021/22 Bear Cycle has been largely sustained 'thanks to' the Lower Highs trend-line that started on the November 10 2021 All Time High (ATH). The first major rejection it had was on the March 28 2022 Lower High, which happened to be also on the 1D MA200 (orange trend-line) and started the bearish leg of April-May-mid June, and the most reject minor rejection was on the September 13 Lower High which almost touched the trend-line.
As you see, the price touched that trend-line again on October 04, hitting the 1D MA50 (blue trend-line) in the process and after a marginal break on a candle wick above the trend-line on October 06, it pulled-back below it again. However the sideways trading of the past two days is putting BTC on the November 10 2021 trend-line again, adding more to that uncertainty of the trend.
What are you treating Bitcoin's persistence to trade around this trend-line as? Is it a break or a fail? So far it couldn't be more unclear indeed. Technically a decisive break can lead the price to the 1D MA200 for the first time since March 28 but that break alone would be one of the most critical steps of this Cycle towards starting the new Bull Phase. On the other hand a rejection has the June 18 Support Zone to test, which is also where the major Support trend-line of the 1W MA300 (red trend-line) is coming to.
So is Bitcoin breaking to the upside or failing here? Feel free to let me know in the comments section below!
-------------------------------------------------------------------------------
** Please LIKE 👍, SUBSCRIBE ✅, SHARE 🙌 and COMMENT ✍ if you enjoy this idea! Also share your ideas and charts in the comments section below! This is best way to keep it relevant, support me, keep the content here free and allow the idea to reach as many people as possible. **
-------------------------------------------------------------------------------
You may also TELL ME 🙋♀️🙋♂️ in the comments section which symbol you want me to analyze next and on which time-frame. The one with the most posts will be published tomorrow! 👏🎁
-------------------------------------------------------------------------------
👇 👇 👇 👇 👇 👇
💸💸💸💸💸💸
👇 👇 👇 👇 👇 👇

BTCUSDT Down Trend.!#BTCUSDT Looking for Sell trade setup as I mentioned in the Chart.!
Keep Supporting LIKE, COMMENT And FOLLOW.!
Thank You.!
