BITCOIN Can the Halvings time the Bottom?Those who follow our channels for long know that we are supporters of Halving approaches. Today we bring you such an approach that we've done in the past only this time is on its simplest version as we focus on one thing: purely Bitcoin's (BTCUSD) bottom.
As you see, we have drawn all past three Halvings plus the next one (around March 2024) and plotted on them the Fibonacci Time Zones. The time-frame is on the weekly (1W). There is no need to overextend the analysis so I will be as concise as possible. The bottom on each of the past two Cycles has been around the 0.618 Fibonacci level (green vertical line). On the current Halving Cycle, the 0.618 Fib was on the week of September 19. That exact day and Sep 21 were the lowest levels for Bitcoin since the June 18 Low.
If history repeats itself, then we should see a steady recovery, still within accumulation limits, and bullish break-out by early next year. For comparison purposes I display the price action of the past two Cycles from the 0.618 Fib to the next Halving and plot it on today's until Halving 4. They do diverge as they traded on different fundamentals (Feb - April 2019 were on the Libra news) but they both reveal that a break above the 1W MA50 (blue trend-line) would be the bullish break-out signal buyers look for.
So do you think that this Halving approach can time the bottom? If not where do you expect the bottom to be at? Feel free to let me know in the comments section below!
-------------------------------------------------------------------------------
** Please LIKE 👍, SUBSCRIBE ✅, SHARE 🙌 and COMMENT ✍ if you enjoy this idea! Also share your ideas and charts in the comments section below! This is best way to keep it relevant, support me, keep the content here free and allow the idea to reach as many people as possible. **
-------------------------------------------------------------------------------
You may also TELL ME 🙋♀️🙋♂️ in the comments section which symbol you want me to analyze next and on which time-frame. The one with the most posts will be published tomorrow! 👏🎁
-------------------------------------------------------------------------------
👇 👇 👇 👇 👇 👇
💸💸💸💸💸💸
👇 👇 👇 👇 👇 👇
Btcusdsignals

BITCOIN Is it DECOUPLING from the stock market?Lately we see the stock market (for this analysis the S&P500 is used (blue trend-line)) falling sharply while at the same time Bitcoin (BTCUSD, orange trend-line) falls at a much lower rate or even at times remains stable (even increasing on some occasions). While this phenomenon might seem odd, especially in the eyes of people believing dogmatically that Bitcoin and the stock market are 100% correlated, it has occurred in the past and even a quick look can help us draw very useful conclusions.
On this 1W time-frame chart, I've displayed the times that the BTC - SPX decoupling has been notable. As you see, since December 2015 there have been three major and four minor occurrences where the S&P500 dropped sharply while Bitcoin remained stable and on some occasions even increased (October 2020, May 2019, late December 2018, early August 2017, October 2016). Two of them where on BTC Cycle Bottoms where a strong rally was starting. Another three was during BTC's parabolic rally phase. For obvious reasons (being a Black Swan event), I exclude the March 2020 COVID crash from the sample.
What do you think that the current divergence/ decorrelation may suggest for Bitcoin? Will it follow SPX sharply lower (if it continues to fall) or form a market bottom and start rising? Feel free to let me know in the comments section below!
P.S. You might find useful looking at the BTCUSD (orange) vs BTCUSD/SPX ratio (blue trend-line) below:
Also in case your browser distorts the lines placement, this is what the main chart of this analysis looks like:
-------------------------------------------------------------------------------
** Please LIKE 👍, SUBSCRIBE ✅, SHARE 🙌 and COMMENT ✍ if you enjoy this idea! Also share your ideas and charts in the comments section below! This is best way to keep it relevant, support me, keep the content here free and allow the idea to reach as many people as possible. **
-------------------------------------------------------------------------------
You may also TELL ME 🙋♀️🙋♂️ in the comments section which symbol you want me to analyze next and on which time-frame. The one with the most posts will be published tomorrow! 👏🎁
-------------------------------------------------------------------------------
👇 👇 👇 👇 👇 👇
💸💸💸💸💸💸
👇 👇 👇 👇 👇 👇

BITCOIN The scariest fractal right now.-------------------------------------------------------------------------------
** Please LIKE 👍, SUBSCRIBE ✅, SHARE 🙌 and COMMENT ✍ if you enjoy this idea! Also share your ideas and charts in the comments section below! This is best way to keep it relevant, support me, keep the content here free and allow the idea to reach as many people as possible. **
-------------------------------------------------------------------------------
Yesterday's sudden reversal to Bitcoin's (BTCUSD) strong rise early in the day, just below the 1D MA50 (blue trend-line) was far from ideal as it closed the daily candle in red. That brings to memory the last time that happened and was the last signal before a massive sell-off.
That was on May 04 2022. As you see the price was again rejected just before hitting the 1D MA50, only a few days after it marginally broke above it (April 21) but again failed, just like on September 13. Following the May 04 rejection, the resulting sell-off initially dropped by -36% and by June 18 it completed a -63% fall from the March 28 Top. Such huge decreases have not been uncommon throughout this Bear Cycle (which has been trading within a Bearish Megaphone pattern) and especially since the November 10 All Time High, whose subsequent drop was around -52%.
I have replicated the January 22 - June 18 price action (blue) and pasted it on the post June 18 sequence. That fractal that hints to a -61% drop at around $10000. If it follows the Megaphone's first drop of -52%, then it would result to around $12000. Whatever happens, that is indeed a scary fractal, in fact the scariest projection that can be made on BTC right now. It may or may not happen. What matters is to be prepared for both and apply a strategy that utilizes the appropriate risk management.
But what's your view on this fractal? Do you think it is realistic? What are your targets for Bitcoin on a 1-2 month horizon? Feel free to let me know in the comments section below!
-------------------------------------------------------------------------------
You may also TELL ME 🙋♀️🙋♂️ in the comments section which symbol you want me to analyze next and on which time-frame. The one with the most posts will be published tomorrow! 👏🎁
-------------------------------------------------------------------------------
👇 👇 👇 👇 👇 👇
👇 👇 👇 👇 👇 👇
👇 👇 👇 👇 👇 👇

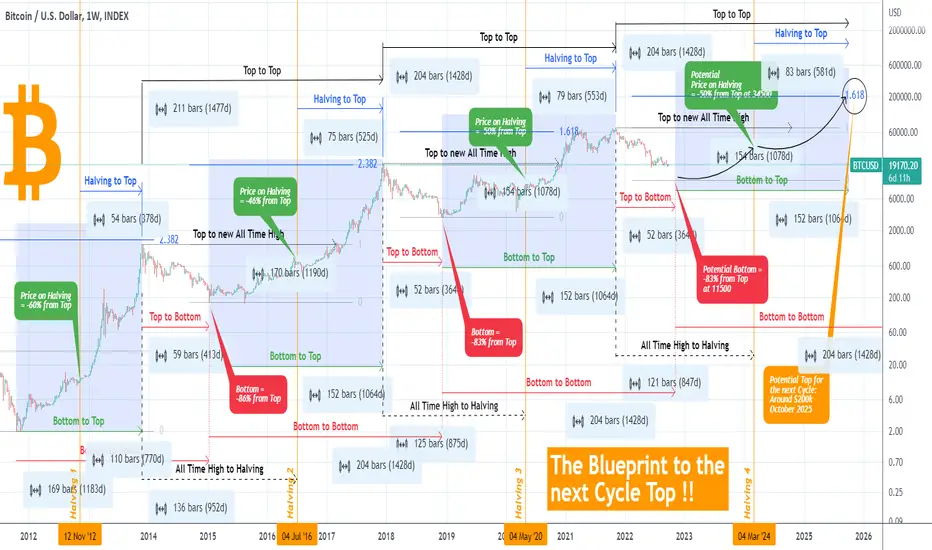
BITCOIN The Blueprint to the next Cycle TopThis is Bitcoin (BTCUSD) on the 1W time-frame and displays a projection both in terms of pricing and timing of its next Cycle modelled out of the previous three using the following attributes:
* The Halvings.
* Fibonacci extensions from Cycle Top to Bottom to calculate the next Top.
* Top-to-Top-to-Bottom-Bottom-to-Halving stats and vice versa.
Basically this is an extension and combination of previous studies that we've published here on TradingView.
The features of the New Cycle based on the previous ones:
- There is a potential Bottom for the current Cycle around $11500 and this is based on a -83% decrease from the $69000 Top. The previous two Cycles made a Bottom at -83% and -86% from their respective Tops.
- This Bottom is expected to be on the week of November 07 2022 based on the Top-to-Bottom stat, calculated at 52 weeks (364 days). This is consistent with the previous two Cycles Top-to-Bottom stats at 52 weeks (364 days) and 59 weeks (413 days) respectively.
- The Bottom-to-Top range for the next Cycle is calculated at 152 bars/ weeks (1064 days), giving a potential Top on the week of October 06 2025. The previous two Cycles Bottom-to-Top stats have also been 152 weeks (1064 days), while the earlier one 110 weeks (770 days).
- That Top of the new Cycle , can potentially be around $200000, calculated on the 1.618 Fibonacci extension level of the previous Top and the next potential Bottom. The Top of the previous Cycle was a little over 1.618, while the Tops of the previous two Cycles were around the 2.383 Fib. Having lower tops, i.e. lower returns is consistent with the Theory of Diminishing Returns in time.
- The Halving-to-Top ranges at 83 weeks (581 days), while the Top-to-Top at 204 weeks (1428 days) projected after the previous two Cycles.
- The price on the date of the Halving can potentially be around $34500. That is calculate at -50% from the top, consistent with the previous three Cycles (-50%, -46% and -60% respectively).
- Also the Bottom-to-Bottom stat (calculated at 204 weeks/ 1428 days) gives an estimated Bottom to the next Cycle around the week of October 05 2026.
If I forget something, it is all on the chart for you to see and draw your own conclusions. As the title says this is a Blueprint of the next Cycle, a roadmap purely drawn on Bitcoin's historical data at hand. The reality can turn out to be quite different if the fundamentals weigh differently this time but in a market of constantly moving variables, this 'Blueprint' may be a good way to start and do your own research.
So how useful do you think this model is? Do you agree with the potential Bottom and Top levels? Feel free to let me know in the comments section below!
------------------------------------------------------------------------------------------
** Please LIKE 👍, SUBSCRIBE ✅, SHARE 🙌 and COMMENT ✍ if you enjoyed this idea! Also share your ideas and charts with the community down below! This is best way to keep it relevant and support me and allow the idea to reach as many people as possible. **
------------------------------------------------------------------------------------------
You may also TELL ME 🙋♀️🙋♂️ in the comments section which symbol you want me to analyze next and on which time-frame. The one with the most posts will be published tomorrow! 👏🎁
------------------------------------------------------------------------------------------
👇 👇 👇 👇 👇 👇
👇 👇 👇 👇 👇 👇
👇 👇 👇 👇 👇 👇
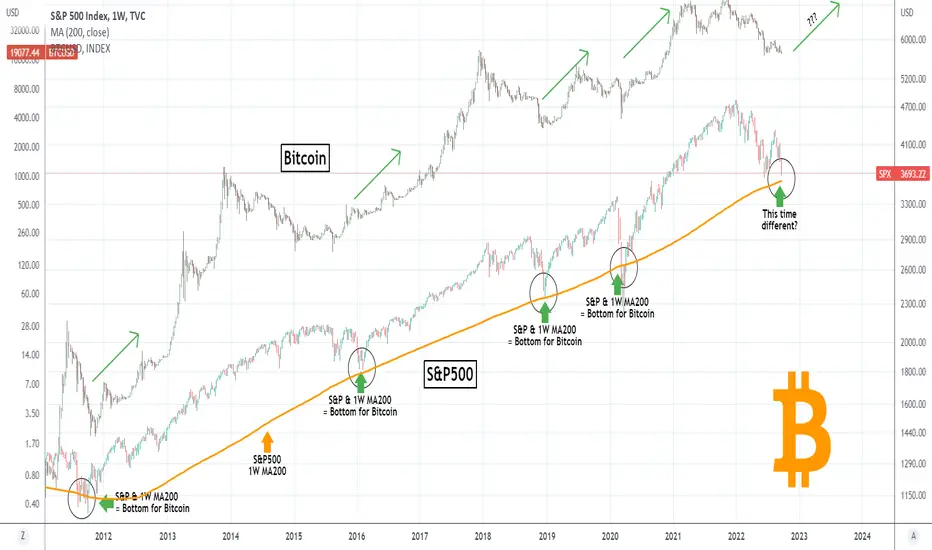
BITCOIN The S&P tests MA200. Crucial week ahead for BTC.Simple 1W chart. Every time the S&P500 index (SPX) hit and broke above or (nearly) bounced on its 1W MA200 (orange trend-line), Bitcoin has formed a bottom and started along with the S&P rally phases. This week the S&P500 will have an opportunity for such a test. Will it find Support and cause Bitcoin to bottom finally and rally? Or is this time different?
Feel free to let me know in the comments section below!
------------------------------------------------------------------------------------------
** Please LIKE 👍, SUBSCRIBE ✅, SHARE 🙌 and COMMENT ✍ if you enjoyed this idea! Also share your ideas and charts with the community down below! This is best way to keep it relevant and support me and allow the idea to reach as many people as possible. **
------------------------------------------------------------------------------------------
You may also TELL ME 🙋♀️🙋♂️ in the comments section which symbol you want me to analyze next and on which time-frame. The one with the most posts will be published tomorrow! 👏🎁
------------------------------------------------------------------------------------------
👇 👇 👇 👇 👇 👇
👇 👇 👇 👇 👇 👇
👇 👇 👇 👇 👇 👇
BITCOIN In DANGER if this level breaks. Can this save the day?Bitcoin (BTCUSD) has been trading within a Falling Wedge pattern ever since the August 15 top. This analysis is on the 1D time-frame but we do incorporate the 4H MA50 (green trend-line) and the 4H MA200 (grey trend-line) to help us understand critical Resistance and break-out level.
** The Falling Wedge and the importance of the 4H MA50 **
What stands out here is that while Bitcoin is on Lower Lows (Falling Wedge), the 1D RSI has been on Higher Lows, showcasing a Bullish Divergence. However that is not enough on its own to start a rebound to the top of the Wedge. What is needed is a candle closing above the 4H MA50. We haven't had one since September 12, which was the previous High of the Wedge. Even before that, since August 15, we see that the candle never closed above the 4H MA50 and only when it did once (Sep 09), did the price rebound. As a result we should consider a closing above the 4H MA50 as a bullish break-out signal targeting the 1D MA50 (blue trend-line) and the top (Lower Highs trend-line) of the Falling Wedge, on the short-term term only. We can derive further confirmation if the 1D MACD makes a Bullish Cross again (last did on Sep 09, exactly when the rebound took place).
** The danger of breaking a Triple Support cluster **
The danger for BTC lies on the potential 1W MA300 (red trend-line) test. As long as the 4H MA50 keeps rejecting a break-out, the price should continue trading lower on the Lower Lows trend-line. Eventually that can test the 1W MA300 on the first week of October. Interestingly enough, this is where the current Support level is (17600), formed by the June 18 Low. If this Triple Support level breaks and the week closes below it, an enormous sell-off can taken place. During this 2021/22 Bear Cycle, it has been common for Bitcoin to fall within -45.50% and 55.50%, as the following chart suggests:
Assuming that the August 15 High was the start of such a sell-off, then a -45.50% move can be completed around 14000 while a -55.50% drop can be completed at around 11500.
What probabilities would you give to see those targets? Feel free to share your work and let me know in the comments section below!
------------------------------------------------------------------------------------------
** Please LIKE 👍, SUBSCRIBE ✅, SHARE 🙌 and COMMENT ✍ if you enjoyed this idea! Also share your ideas and charts with the community down below! This is best way to keep it relevant and support me and allow the idea to reach as many people as possible. **
------------------------------------------------------------------------------------------
You may also TELL ME 🙋♀️🙋♂️ in the comments section which symbol you want me to analyze next and on which time-frame. The one with the most posts will be published tomorrow! 👏🎁
------------------------------------------------------------------------------------------
👇⬇🔽 👇⬇🔽 👇⬇🔽 👇⬇🔽 👇⬇🔽 👇⬇🔽 👇⬇🔽

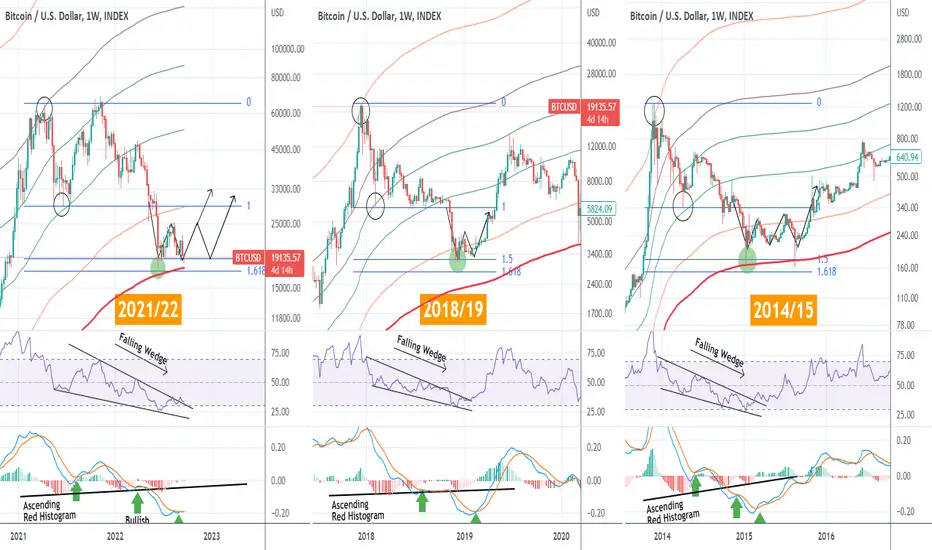
BITCOIN Do we have a clear recovery pattern based on pastCycles?Just as we are waiting for today's Fed Rate Decision, Bitcoin (BTCUSD) remains low, in fact it is the closest it has been to June's Low with the 1W MA300 (bold red trend-line) approaching from below. Is this the last selling before a bottom is formed. One way to look at it is by analyzing Bitcoin's past Bear Cycles. On this analysis we will compare the structure of the current (2021/22) Cycle to the previous two, 2018/19 and 2014/15.
Let's look at the similarities:
* All patterns have hit the 1.5 - 1.618 Fibonacci Zone following their most aggressive sell-off of the Cycle. The 2018/19 Cycle recovered after making a 2nd low and pull-back on a W-shaped pattern, while the 2014/15 had two pull-backs on an M-shaped recovery.
* No (weekly) candle closed below the 1W MA300.
* All RSI sequences formed a Falling Wedge pattern and when it broke to the upside (for 2018/19 and 2014/15), it signaled the start of the new Bull Cycle. For 2021/22, it broke upwards this month.
* The 2018/19 and 2014/15 MACD sequences formed the final Bullish Cross (green arrow) after bouncing on the -0.20 level, which is where the MACD is currently at.
Also their red histograms where on an Ascending (Higher Lows) pattern. The first green bars after that, signaled the start of the Bull Cycle.
As you may have noticed, we are using the Fibonacci MAs on these charts, painting a fairly clear picture of the steps the price took within the Cycles. So far, BTC's current Cycle is extremely consistent with the past two, especially with the 2014/15 one. If yet another Cycle gets completed by repeating this, then we are either at the very low and the start of a rally is imminent on a W-shaped recovery, or we will bounce once more and pull-back to test the 1W MA300 towards the end of the year, before starting the new Bull, on an M-shaped recovery.
Which of the two do you think is going to be? Or do you expect to close below the 1W MA300 and invalidate this historic model? Feel free to share your work and let me know in the comments section below!
--------------------------------------------------------------------------------------------------------
Please like, subscribe and share your ideas and charts with the community!
--------------------------------------------------------------------------------------------------------
BITCOIN 1W On Balance Volume calling for the ultimate buy nowThis Bitcoin (BTCUSD) analysis is on the 1W time-frame, utilizing a historically key indicator, the On Balance Volume (OBV). This has helped us spot both buy and sell opportunities in the past, especially since 2013, and as the market is trading sideways, potentially forming the Cycle bottom, it is perhaps the ideal time to take a look into it again.
Since 2013, the OBV has been trading within a Channel Up. The red arrows present tops on (or near) the Higher Highs trend-line, hence sell opportunities, while the green arrows present bottoms on the Higher Lows trend-line, hence buy opportunities. As you see, BTC has been trading on the Channel's Higher Lows trend-line since the June 13 1W candle. Since it is holding it and gradually trending upwards along with the Higher Lows trend-line, it is a sequence consistent with all prior market bottoms.
The 1W MA50/100 Bearish Cross has been formed this month, strengthening the bottoming argument. If the model continues to play out as it did all these years, then with should be expecting a rally soon with a 1st medium-term target on the middle of the OBV Channel Up and a 2nd on the Red Resistance (circle), which is the extension of the first Lower High of the Bear Cycle.
Do you think the OBV model will continue this pattern and deliver 48k-50k by Q1 2023? Feel free to share your work and let me know in the comments section below!
--------------------------------------------------------------------------------------------------------
Please like, subscribe and share your ideas and charts with the community!
--------------------------------------------------------------------------------------------------------

BTCUSD Double TopBTC double top pattern and bounce off 200-week MA resistance
RSI strong bearish below 40 and 30 level support if break down 30 further down

BITCOIN 1W Chaikin and Stoch show we are entering the new BullThis is a Bitcoin (BTCUSD) analysis on the 1W time-frame using the Chaikin Oscillator and the Stochastic. It is not common to see those two indicators, especially on such an asset, but despite being overlooked, they offer an excellent explanation of where the price is trading relative to its previous Cycles.
** The Chaikin Oscillator **
The Chaikin Osc, which is displayed by the red histogram has been mostly trading below the 100.00 level since the start of the year (Jan 2022). We saw the same trading pattern during the late 2014/ early 2015 Cycle bottom formation and to a shorter extent during the November 2018 - March 2019 Cycle bottom formation. Observe how symmetrical the peaks (which made Lower Highs during the Bear Cycle) of the Chaikin are.
** The Stochastic **
Now take a look at the Stoch, which also forms Lower Highs during Bitcoin's Bear Cycles, a pattern that is again consistent throughout the current Cycle. At the same time, there is a noticeable Support Zone. At the end of that zone, after the last Lower Highs, the Stoch prints a Higher Lows formation, quite volatile, which then aggressively breaks to the upside the breaks the 80.00 level. It appears that BTC is currently at this exact stage.
Every such Chaikin - Stoch combo in the past Cycles has always come after the Bottom and indicated that BTC was at the start of the recovery Channel (green), which slowly but methodically led the price to the previous All Time High that gave way to the Parabolic Rally that eventually ended the Cycle with the new High.
Do you agree with the above evidence. Has BTC entered the Bull Channel or we haven't seen the Bottom yet? Feel free to share your work and let me know in the comments section below!
P.S. Because the chart having the Chaikin Osc plotted together with the BTC candles, it is not constant and may appear distorted based on your screen's/ browser dimensions. The original looks like this below, so if yours doesn't, adjust the vertical/ horizontal axis in order to make it look like this and better understand what is illustrated:
--------------------------------------------------------------------------------------------------------
Please like, subscribe and share your ideas and charts with the community!
--------------------------------------------------------------------------------------------------------

BTCUSD top-down analysisHello traders, this is the full breakdown of this pair. We will take this trade if all the conditions are satisfied as discussed in the analysis. Smash the like button if you find value in this analysis and drop a comment if you have any questions or let me know which pair to cover in my next analysis.
Press like button if you enjoy this content 😊

BITCOIN Bottom completed. Bull Flag about to start the 30k rallyBitcoin (BTCUSD) is having a red week so far (1W time-frame) following last week's rebound. The worse than expected CPI is leading this pull-back fundamentally. Technically though, the price remains both above the Support provided by the 1W MA300 (red trend-line) and the Channel Down that started after the mid-August High. As long as no further Low is made, this Channel can be technically considered a Bull Flag, and is consistent with both prior Cycle bottom sequences.
** Past Cycles bottom formation **
As you see on this chart, the pattern that emerged after each prior Cycle bottom, was this Bull Flag. The price basically started to break above the Flag when a 1W MA50/ 1W MA100 Bearish Cross (1W MA50 in the blue trend-line crossing below the 1W MA100 in the green trend-line). Once the 1W MA50 break, the price never looked back and the parabolic rally of the new Bull Cycle took off.
The 1D MA200 (black trend-line) is the first level of Resistance on the medium-term and is currently around 29800. The importance of this is high because on those past Cycles, every time the 1D MA200 crossed below the 1W MA100 to form a Bearish Cross, the Cycle's Bottom was priced.
** The Fibonacci levels as Targets **
Back to the 1W MA50, once it broke, the price reached the 0.5 Fibonacci retracement level, which was just above the 1W MA100, very quickly in fact in a matter of 3 weeks. The next Target on the medium-term (and Resistance) for both prior Cycles, was the 0.786 Fibonacci. In 2016 it was hit in 32 weeks after the 0.5 while in 2019 in just 6 (but that was a rapid growth based on, among others, the Libra fundamentals).
** What's next? **
All the above suggest that if the same cyclical pattern continues to play out, Bitcoin should complete the Bull Flag now and start rising as the 1W MA50/100 Bearish Cross has been formed. A realistic technically target towards the end of the year would be the 0.5 Fib at $33900, where by that time it can make contact with the 1W MA50 potentially. We can then expect a 0.786 Fib test at just above $49000 by Q2 2023. All this calculated as the average projection of the past 2 Cycles.
Do you agree that this Bull Flag, following the MA50/100 Cross is about to start a rally to test the August High and then $33900 before the year is over? Feel free to share your work and let me know in the comments section below!
--------------------------------------------------------------------------------------------------------
Please like, subscribe and share your ideas and charts with the community!
--------------------------------------------------------------------------------------------------------

BITCOIN The 3D cheat-sheet approaching a major Bull break-out!This is an analysis of Bitcoin (BTCUSD) on the alternative but highly informative 3D time-frame where we can claim that its cyclical behavior is most accurately displayed. As always, the MA50 is shown with the blue trend-line, while the MA200 with the orange trend-line).
** Bear Cycles & the Death Cross **
First let's start with the Bear Cycles. As you see, when the 3D MA50 crosses below the 3D MA200 and forms the popular Death Cross pattern, the market tends to give the last warning of a huge sell-off. On all Cycles, that was the last drop before the Cycle forms its market bottom.
** Accumulation and MA50 break-out **
Then on a Higher Lows trend-line as Support and the MA50 as Resistance, the market enters its Accumulation Phase (blue Triangle pattern), until the MA50 breaks and it officially starts rising on the new Bull Cycle. At the moment, with the MA50 at 25500 and declining rapidly, BTC is at the closest it has been to it since May 04. On top of that, the 3D RSI just broke above its Bear Cycle Lower Highs trend-line, just like it did on January 04 2019.
** Parabolic Rally above the MA200 **
So what now? Well if the price breaks above the MA50, chances are that Bitcoin will start rising (not necessarily as aggressively as in April - June 2019, which was based on outside factors as well), assuming that the macro-economic conditions don't get worse. Then, a new break above the 3D MA200 will most likely place BTC on the infamous Parabolic Rally course of the Bull Cycle. Notice how in the previous two Cycles, when the price broke above the MA200 and the Golden Cross was formed (MA50 crossing over MA200), the price used the MA200 as the Support of the Parabolic Rally (excluding of course the COVID crash in March 2020, which is a once in a life-time event).
So what do you think about those 3D patterns and conditions? Does it offer a comprehensive road-map of this new Cycle and if yes, are you expecting a strong rally when the MA50 breaks? Feel free to share your work and let me know in the comments section below!
--------------------------------------------------------------------------------------------------------
Please like, subscribe and share your ideas and charts with the community!
--------------------------------------------------------------------------------------------------------

BITCOIN Testing the most important long-term Resistance levels!Bitcoin (BTCUSD) is currently on a strong +17% four day rally, the strongest since July 29. By doing so, it is about to test the important short-term Resistance of 22000, formed off the August 24 High. There is however a trend-line and cluster of critical Resistance levels on the long-term as well that the price is about to hit, and outweigh by far the short-term technicals.
** The ATH trend-line and Bullish - Bearish extremes **
That is the Lower Highs trend-line that started on the November 10 2021 All Time High (ATH). Basically this is the Lower Highs trend-line of the Channel Down pattern (log scale) that has been dominating the price action for most of the past 10 months. As you see on this 1D chart, the price has broken outside of this Channel Down twice these past 10 months. Once on March 22 where it made a Bullish Extreme but still was contained below the 1.382 Fibonacci extension and once on June 18 where it made a Bearish extreme but still was contained above the -0.382 Fibonacci extension.
** The 1D MA100 **
The last time BTC attempted a break above the ATH trend-line was on the August 15 High where it wasn't just rejected on the top of the Channel Down but also on the 1D MA100 (green trend-line). Excluding the Bullish Extreme, the price has been trading below the 1D MA100 since December 03 2021 with three clear rejections on it. At the moment, the 1D MA100 is trading exactly on the ATH trend-line and has been doing so since the August 15 rejection. It is obvious that at the moment, this is the most important Resistance Zone that BTC is facing.
A break and close above it though doesn't 'guarantee' the end of the long-term Bearish Trend as that took place when it broke on March 22 but was still rejected on the 1.382 Fib ext. As you realize, only a break above the 1.382 Fib turns the odd in favor of a long-term Bullish reversal and can sustain a rally invalidating bearish bias of March 29 - April 05. On a different occasion, the 10 month Channel Down will continue to dictate the trend.
But what do you think is going to happen? Will a close above the ATH line and the 1D MA100 accumulate enough buyers to finally push above the 1.382 tolerance level and into a new Bull rally or we will get again rejected and stay within the long-term Channel Down? Feel free to share your work and let me know in the comments section below!
--------------------------------------------------------------------------------------------------------
Please like, subscribe and share your ideas and charts with the community!
--------------------------------------------------------------------------------------------------------

BITCOIN TRADE OF THE YEAR 3333 dollar !!!According to my chart analysing , btcusd Bitcoin to 3333 dollar !!!!

BITCOIN The Double Bottom effect on Cycles. Huge rally starting?Bitcoin (BTCUSD) made a Low two days ago and today we are seeing a strong rebound on the biggest 1D candle (so far) since July 27. Based on the Cyclical Double-Bottom Effect, we can argue that this low is a hit on the Double Bottom zone of the June 18 market Bottom. What is that effect? Well it appears to be not just a Theory but a pragmatic phenomenon that has been seen on every Cycle bottom on Bitcoin's past three Cycles.
On this 1D chart, you can see the current Cycle on top of the previous ones for a more effective illustration of the Double-Bottom effect. The range of the Double-Bottom is the green zone. Cycle 1 is displayed with the black trend-line making the 2011 Double Bottom, Cycle 2 with the blue trend-line making the 2015 Double Bottom and Cycle 3 in the orange trend-line making the 2019 Double Bottom.
As it is shown, the Double Bottoms are fairly structured in the same way on each of the past Cycles and straight after each one was formed, a strong rally followed. The past cycles have been adapted in order to fit the Green Range, which is formulated by the current Cycle. Still, the bullish trend following each Double Bottom is obvious. This study isn't designed to show the time-length, but rather the bullish move that follows.
You can view each Double Bottom plotted on top of each other, with the current Cycle being the green trend-line, in the chart below:
So what do you think? Has the market double bottomed and if so, based on the above, are we about to witness a strong multi-month rally as the new Bull Cycle is starting? Feel free to share your work and let me know in the comments section below!
--------------------------------------------------------------------------------------------------------
Please like, subscribe and share your ideas and charts with the community!
--------------------------------------------------------------------------------------------------------

BITCOIN extends its bearish trend. Our options on the short-termBitcoin (BTCUSD) had yet another strong 4H red candle, consistent to the past two hard selling sequences since the August 15 High. Today's post is an extension to the short-term analysis we made a few days back.
** The selling patterns **
As mentioned, the time-frame here is the 4H (4hours). As you see, since the price broke above the former Triangle, it failed to stay above the 4H MA50 (blue trend-line) and eventually yesterday made that strong 4H sell-off. The common characteristic with the previous two selling patterns that were within the Triangle, is that it did so when the price broke above the Higher Lows trend-line (bold dotted lines) that was supporting until then.
** Fibonacci targets **
The target yesterday was once again the 1.618 Fibonacci extension as with the previous two sequences. If a new Higher Lows trend-line emerges, then in line with the previous sequences, we should be expecting an upwards consolidation that could reach the 1.236 Fib.
** The former Lower Highs trend-line supporting **
What's really interesting is that since BTC broke above the former Triangle, its Lower Highs trend-line has been tested twice (including yesterday) and held. Can that turn into a Support and provide a new trend? Well this is the short-term and we have to keep looking into it and the every-day changes on indicators continuously. If that former Lower Highs line breaks, expect another flash crash, this time to test the ultimate Support level of the 1W MA300 (yellow trend-line).
** Neutral zone, Break-out Buy and a very consistent RSI **
We consider the range within the 4H MA50 and the 4H MA100 (green trend-line) as neutral space, thus a 'no-trade zone'. On the other hand, consider buying if the price closes above the MA100 and target the 4H MA200 (orange trend-line).
Among the fuss, just check how well-structured the 4H RSI has been, with a clear Higher Lows line providing a solid buy entry and a Resistance providing a sell.
So do you think Bitcoin is up for yet another Higher Lows consolidation until it breaks downwards again or an MA100 break will save the day? Feel free to share your work and let me know in the comments section below!
--------------------------------------------------------------------------------------------------------
Please like, subscribe and share your ideas and charts with the community!
--------------------------------------------------------------------------------------------------------

BITCOIN Bullish Cross on MACD similar to the 2018/19 bottomBitcoin (BTCUSD) is about to form a Bullish Cross on the MACD (1D time-frame) as it trades below both the 1D MA50 (blue trend-line) and the 1D MA100 (green trend-line). The last time it did a similar formation on those levels while Bitcoin was recovering from a market low was on February 07 2019, during the December 2018 - March 2019 Cycle Bottom formation.
What followed was an instant price rebound which around 10 days it broke above both the 1D MA50 and 1D MA100 and a little after 2 weeks it tested the Bottom Fractal's Resistance. Once BTC broke above that Resistance it instantly broke above the 1D MA200 (orange trend-line) also and the Q2 2019 rally, the first of the previous Bull Cycle was already well underway.
At the moment it appears that we are exactly on that kick-start point, supported on the 12° angle Higher Lows trend-line, with the Supertrend indicator flashing red. Do you think that this emerging MACD Bullish Cross, can repeat the post February 2019 sequence? Feel free to share your work and let me know in the comments section below!
--------------------------------------------------------------------------------------------------------
Please like, subscribe and share your ideas and charts with the community!
--------------------------------------------------------------------------------------------------------

BITCOIN Short-term outlook doesn't look promising. Unless...This analysis is on Bitcoin (BTCUSD) on the 4H time-frame where we're looking on its short-term perspective. As you see since the August 15 High and the rejection on the 1D MA100 (red trend-line), the trend has been bearish and using the Fibonacci Channel with its extensions, better grasps the movement.
The price has been closing below the 4H MA50 (blue trend-line) since August 16 and the 4H MA200 (orange trend-line) since August 18. Every major drop (black arrows) was preceded by a Channel Up/ Bear Flag pattern, where sellers accumulated. It appears that we are in such a Flag currently that is about to break downwards. On top of that, BTC failed to break above the Lower Highs trend-line tha started on the August 15 High and last time that happened (August 26), the new drop happened. We are though very close to the Channel's Bottom (Lower Lows trend-line), which broke momentarily on Aug 28, so a new drop may target the -0.5 Fibonacci extension.
On the bull side, the 4H RSI has been on Higher Lows since August 19, also printing an Inverse Head and Shoulders pattern. A candle close above the 4H MA50 should be enough to accumulate buyers into targeting the 4H MA200 (orange trend-line). On the longer-term, only a weekly closing above the 1D MA100 seems capable to restore the bullish trend.
Also, consider this Higher Lows zone since June 30, illustrated by the dashed lines on the chart below (I didn't include this on the main chart to make it less messy):
Which direction do you think Bitcoin will follow? Break above the 1D MA50 or new drop? Feel free to share your work and let me know in the comments section below!
--------------------------------------------------------------------------------------------------------
Please like, subscribe and share your ideas and charts with the community!
--------------------------------------------------------------------------------------------------------

BTCUSD intraday trading & back to the home ⬇︎ 30 AUG 2022BTCUSD intraday trading alert
3 steps must fulfill before entry
1. 1st breakout done
2. Retracement done
3. 2nd breakout and see you in the home ⬇︎
More info in my profile..
Good luck traders..

BITCOIN Recovering the 1D MA100 is key for $30000 as in 2019The trading set-up on Bitcoin (BTCUSD) since the June 18 low looks a lot like the price action that followed the December 15 2018 Bottom of that Bear Cycle. There is no need to overanalyze this as a simple comparison of the two charts of 2022 and 2019 would suffice.
As you see in 2019 when the price broke below the 1D MA50 (blue trend-line), it entered the final stage of Accumulation inside a Channel Down before the first rally of the new Bull Cycle. The pull-back was contained above the 0.786 Fibonacci retracement level. Once the price broke above the 1D MA50 but more clearly above the 1D MA100 (green trend-line), there was considerable buying accumulation that in just over one month broke also above the 1D MA200 (orange trend-line) to reach the 2.0 Fibonacci extension. This Fib is on today's set-up around 32700. The 1D MACD patterns so far are fairly similar. One more Bullish Cross on the MACD may confirm the bias to break above the 1D MA50 initially.
Do you think that as long as the 0.786 Fib holds and the 1D MA100 breaks, BTC can reach 32700? Feel free to share your work and let me know in the comments section below!
--------------------------------------------------------------------------------------------------------
Please like, subscribe and share your ideas and charts with the community!
--------------------------------------------------------------------------------------------------------

Bitcoin Prediction H1Here is my view for BTCUSD on H1. The price could go up, you can put a pending order on the Order block or find an entry on LTF within OB Zone. Trade Safe!

BTCUSD top-down analysisHello traders, this is the full breakdown of this pair. We will take this trade if all the conditions are satisfied as discussed in the analysis. Smash the like button if you find value in this analysis and drop a comment if you have any questions or let me know which pair to cover in my next analysis.
Press the like button if you enjoy this content :)
