BTCUSD Breakout Short!BTC-USD was trading in a local uptrend
Along the rising support line
But then the pair broke the support line
Which became a resistance
And so after the retest horizontal resistance at 22572.7
The most likely direction of the next move
Is down towards the target below
Btcusdsignals

BITCOIN Cyclical 1D MA200 model shows bottom & bullish break-outBitcoin (BTCUSD) tends to have a constant cyclical behavior, repeating certain aspects over and over again during each Cycle. The model that I will quickly analyze on today's post is no different and it involves the 1D MA200 (orange trend-line).
** Similar dips and break-out durations **
On this 1W time-frame, you can see that during the past two Cycles, the price dipped -65% (Jan 12 2015) and -63% (December 10 2018) after the last rejection on the 1D MA200, before making the Bottom of the Bear Cycle. Also, the times from the rejections until the price broke again above the 1D MA200 are comparable, as it respectively took 33 weeks (231 days) to break above it on June 29 2015 and 36 weeks (252 days) on the April 01 2019 1W candle.
As you see, those are roughly identical numbers and continue to hold during the current Cycle as well, as the drop from the last 1D MA200 rejection (March 28 2022 candle) to the June 13 2022 Low, has also been -63%, making it a bottom according to the model. If this process is fulfilled, then the price will break above the 1D MA200 again by the week of December 05 2022 the latest.
** Williams Alligator showing the Bottom is in **
An additional indicator that brings value to this model, is the Williams Alligator used on a 3W time-frame here. As shown during the past two Cycles, the market Bottom was made right when the green trend-line (lips) crossed below the blue trend-line (jaw). Similarly when the green trend-line crossed back above the blue, BTC had already started rising into the new Bull Cycle and that was an indication that the first rally of the Cycle made its top.
So do you think that this model will be repeated once more, meaning that the market has already bottomed and Bitcoin will break above the 1D MA200 by the week of December 05 2022 the latest? Feel free to share your work and let me know in the comments section below!
P.S. Because the chart has the added element of the Williams Alligator plotted and pinned to scale Z, it is not constant and may appear distorted based on your screen's/ browser dimensions. The original looks like this below, so if yours doesn't, adjust the vertical/ horizontal axis in order to make it look like this and better understand what is illustrated:
--------------------------------------------------------------------------------------------------------
Please like, subscribe and share your ideas and charts with the community!
--------------------------------------------------------------------------------------------------------

BTCUSDT Down Trend.!#BTCUSDT Looking for Sell trade setup as I mentioned in the Chart.!
Keep Supporting LIKE, COMMENT And FOLLOW.!
Thank You.!

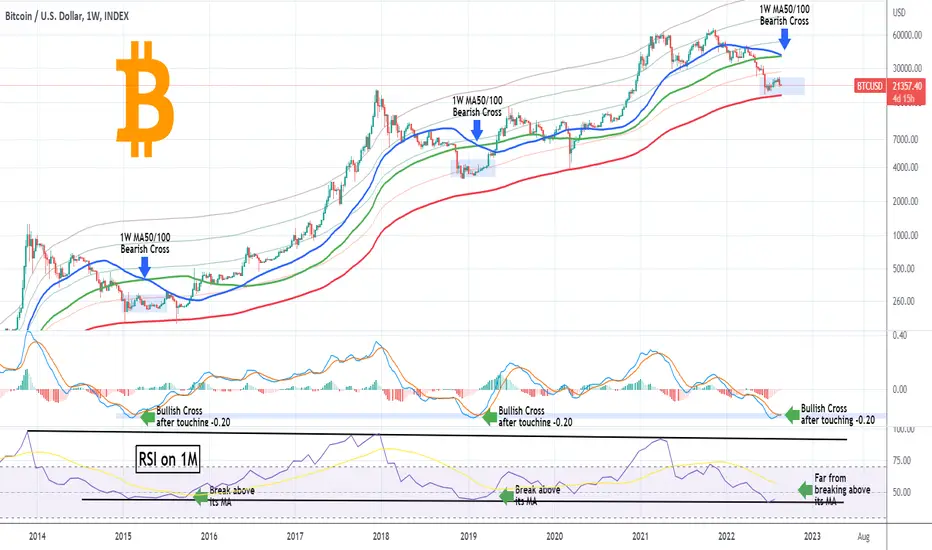
BITCOIN 1W MA50/100 Cross! No better time to buy than now!Bitcoin (BTCUSD) saw a strong pull-back last week after it failed to break above its 1D MA100 and got rejected. We've already addressed that but what we do need to update you on is the fact that the 1W MA50 (blue trend-line) is crossing below the 1W MA100 (green trend-line). This is technically a Bearish Cross but as the chart shows, during the previous two Bear Cycles, it has always been a signal that the price has formed its Cycle low and that BTC was inside the Accumulation Zone leading to the new Bull Cycle.
It is evident that the current price action is very similar to those of February 2019 and April 2015 where BTC made its 1W MA50/100 Bearish Cross following a pull-back. With the 1W MA300 supporting, we may be closer to a 2015 type price action than 2019. In any case, there is another important set of indicators showing that the bottom is in.
First the 1W LMACD making a Bullish Cross. Every time it made this formation after touching the -0.20 level, BTC was well inside the Accumulation Zone of the new Bull Cycle.
Secondly, the RSI on the 1M time-frame hit and is rebounding on the historic Lower Lows trend-line (Support). Every time this happened the Cycle bottom was in and when the RSI broke above its MA (yellow trend-line), a new rally (first of the Bull Cycle) started above the 1W MA50.
Do you agree that this indicator combo is enough evidence that the time to buy is now? Feel free to share your work and let me know in the comments section below!
--------------------------------------------------------------------------------------------------------
Please like, subscribe and share your ideas and charts with the community!
--------------------------------------------------------------------------------------------------------
BTCUSD Miner Capitulation ended! Best Buy but eyes on the USD.Two days ago the Hash Ribbon on the well-known indicator flashed a buy signal, technically ending the Miner Capitulation! What does this mean for Bitcoin (BTCUSD)? Well historically, Miner Capitulation periods have occurred on absolute market bottoms (or lows during uptrends), providing the most attractive buy entries. The 'blue' buy signal on this indicator practically marks the end of this period, which gives the most optimal entry for a long-term investor.
With the price being within the Buy Zone that comes all the way from the previous Bear Cycle bottom, still on Higher Lows, continuing to imitate the December - March 2019 bottom formation process, we may be in a spot similar to Jan 12 2019, when the price broke below its 1D MA50 (blue trend-line) after having marginally broken above it previously, stayed below for 2-3 weeks but when it recovered it again, it didn't break it for months, starting the first rally into the new Bull Cycle. BTC is again currently below the 1D MA50 after trading above it for the majority of August. A break above it again, could be the last we see for months, initiating the new rally.
The only objection we have against this pattern getting repeated, is the U.S. Dollar Index (DXY) displayed by the green trend-line, which has been rising aggressively since mid August and is something that isn't consistent with Bitcoin rallies. Technically, BTC doesn't rise when the USD rises as well. Check the recent history where all major bottoms (Dec 2019 and March 2020) have coincided with the USD trading at least sideways.
Do you think however that the Miners Capitulation ending can provide a boost strong enough on its own regardless of the rising USD? Feel free to share your work and let me know in the comments section below!
--------------------------------------------------------------------------------------------------------
Please like, subscribe and share your ideas and charts with the community!
--------------------------------------------------------------------------------------------------------

BTCUSD: Growth possible soonThe price of BTC continues to decline within the descending momentum.
Now it is fashionable to publish information about mass liquidations of traders' positions and, in general, liquidation is an excellent tool for market makers to write off liabilities and generate profits for exchange and brokerage institutions.
Paying attention to the news feed, one cannot help noticing how very often the information about the price reaching historical lows is mentioned soon.
I am not sure that with the current decline it would be logical, because it would be much more interesting to continue the upward correction and liquidation of traders, who took a short position in the hope to close them below $17k.
After such a scenario, it would be logical to reverse the price and put a fat point on the breakdown of $17k, when the main mass would give up the idea of updating the lows.
In general, for now, I'm set to buy at $19k to $20k, with certain signs of weak seller pressure. In addition, many altcoins are also building a similar structure, which hints at an upside shot soon.
Be careful and follow market dynamics.

BTCUSD intraday trading & back to the home ⬇︎ 22 AUG 2022BTCUSD intraday trading alert
3 steps must fulfill before entry
1. 1st breakout done
2. Retracement done
3. 2nd breakout and see you in the home ⬇︎
More info in my profile..
Good luck traders..

BTCUSD top-down analysisHello traders, this is the full breakdown of this pair. We will take this trade if all the conditions are satisfied as discussed in the analysis. Smash the like button if you find value in this analysis and drop a comment if you have any questions or let me know which pair to cover in my next analysis.

BITCOIN CONSOLIDATING & PREPARING FOR UPSIDE.BITCOIN CONSOLIDATION & PREPARATION FOR A MILD BOUNCE FROM THE ASCENDING TRENDLINE.
Bitcoin has been consolidating on the ascending trendline which had been established over the past 2 months since its price bottomed in mid-June. The move looks to have been completed & relief on CAPITALCOM:BTCUSD price seems to be in the works.
RSI
The RSI on the 1H is at 30 (barely oversold), RSI on the 4H is at about 26 at the point of writing, and on the 15M, we can see RSI at the mid-range of 50. On the macro time frames the signal would be that after the latest capitulation move CAPITALCOM:BTCUSD is ready for relief & we should be eyeing a move to the ~61.80% level to the ~38.20% Fibonacci levels.
BB%B
The BB%B indicator with a longer period of 75 shows that there has been a double bottom of price action, which is also reflected on the chart at the support levels of $20,800 where the price has already bounced twice. We can expect to see a strong expansion or oscillation of the indicator to the upside above 1.0 readings over the next 36 hours from the writing of this post.
Targets
Based on the cyclical timeframe measurement, we should be able to expect the price to hit targets of $21,550 within the next 24 hours of the time of writing.
The secondary target for the relief bounce of price would be $21,795 within 48 hours of the time of writing based on the cyclical timeframe measurements.
If you managed to fill your entries around the $28,000 levels, you could expect a 3.18% move to the upside at target 1 ($21,550) & a 4.56% move to the upside at target 2 ($21,795).
------
As usual, this piece of analysis is simply my perspective & due diligence is imperative when you are entering your trades.
Leave a like or comment if this piece of analysis helped.
Good luck trading.
NOIV

BITCOIN Will the historic Growth Support come to the rescue?Since the rejection on the 1D MA100 five days ago, Bitcoin (BTCUSD) has been on a short-term pull-back which got accelerated yesterday. We covered the short-term outlook with an urgent update yesterday:
For long-term traders and investors, the scene is a little different and is best illustrated on the 1W time-frame. This shows the price breaking below the 1W MA200 (orange trend-line) but still considerably above the 1W MA300 (red trend-line), which was the level that provided the support and immense rebound in March 2020 during the COVID asset-wide collapse.
What is perhaps more relevant than ever now, is BTC's Historic Growth Zone (blue) which has held on the mid-June low and is about to be put up to test again. That Support Zone has started back on the August 2015 low, the first after the 2014 Bear Cycle. Respecting this level, means that we are still inside the ultimate Buy Zone and therefore at the start of a new Bull Cycle.
At the same time the 1W RSI is (naturally) pulling back a notch and seems to be consistent with the April 2015 and January 2019 pull-backs, which where right before the start of the first rallies of the new Bull Cycles.
So what do you think? Will the historic Growth Support come to the rescue once again or not? Feel free to share your work and let me know in the comments section below!
--------------------------------------------------------------------------------------------------------
Please like, subscribe and share your ideas and charts with the community!
--------------------------------------------------------------------------------------------------------

BITCOIN Critical test for this uptrend. CAUTION needed.Bitcoin (BTCUSD) was rejected on Monday on the 1D MA100 (green trend-line) with the selling accelerating today as the price broke below the 1D MA50 (blue trend-line) for the first time since July 27. This is a critical test for this uptrend as the very stable Channel Up that started after the June 18 Low, is approaching its Higher Lows (bottom) trend-line).
** An identical Channel Up **
The 1D RSI shows that we are testing the symmetrical Support Zone of another Channel Up, that of January 24 - May 04, similar in structure with the current one. As you see as long as that Support Zone held, the price was contained within the former Channel Up. In fact that Channel was also rejected at first on the 1D MA100 and fell below the 1D MA50 (twice also) but recovered and hit the 1D MA200 (orange trend-line) where the eventual rejection started to the June 18 Low.
** 1D MA200 or 1W MA300? **
As a result, the RSI shows the limits where trading inside the current Channel Up can be prolonged. A break above the Higher Highs (top) trend-line of the Channel could be enough to hit the 1D MA200 but a break below can be extremely alarming as not only the long-term Support of the 1W MA300 (red trend-line) may be tested but if failed, even a downside extension to the 1.5 Fibonacci extension level is possible, which is exactly the first level hit when the former Channel Up broke.
What scenario do you think is more probable? Feel free to share your work and let me know in the comments section below!
--------------------------------------------------------------------------------------------------------
Please like, subscribe and share your ideas and charts with the community!
--------------------------------------------------------------------------------------------------------

Bitcoin Prediction H1Here is my view for BTCUSD on H1. The price could go down, you can put a pending order on the Order block or find an entry on LTF within OB Zone. Trade Safe!

BITCOIN This 3D RSI rejection is far from ideal. CAUTION needed!Bitcoin (BTCUSD) is trading today on the fourth straight red 1D candle and even though the pull-back is insignificant so far, there is a certain pattern on the 3D time-frame that is worrying.
As you see, the 3D RSI hit last week the Lower Highs trend-line that started on January 07 2021 and defined this whole Bear Cycle. This week, we see that 3D RSI turning lower as the test turned out to be a rejection. This has also happened on March 26 2022 and November 06 2021, which marked the last two Highs of the market.
Based also on the 3D MACD, which has been steadily rising since June 30, this pattern resembles the bottom sequence and subsequent first rise of the recovery phase during the previous Bear Cycle of 2019. As shown, the 3D RSI had a rejection exactly on the same level as today's one, while the 3D MACD was rising. As with today, the rejection came before hitting the 3D MA50 (blue trend-line) and took place on the 0.382 Fibonacci retracement level (counting from the top of the last collapse, essentially the 3D Death Cross).
The resulting pull-back found Support on the Higher Lows trend-line and the 0.236 Fibonacci level and after some more consolidation both the RSI Lower Highs and the 3D MA50 broke and a very strong rally took place. Now, the fundamentals behind that rally were different and a 3D MA50 break-out doesn't have to necessarily follow 2019 into such a strong rally. But still it will be evidence of the new Bull Cycle.
If you are a short-term trader though, that 3D RSI rejection tells you to proceed to the next days with caution and look for that more confident lower buy. Do you agree? Feel free to share your work and let me know in the comments section below!
--------------------------------------------------------------------------------------------------------
Please like, subscribe and share your ideas and charts with the community!
--------------------------------------------------------------------------------------------------------

BTCUSD - Rising Wedge - Bitcoin to FallBTCUSD - Rising Wedge - Bitcoin to Fall
Bitcoin has formed a rising wedge, Price should fall.

BITCOIN monthly is making a huge shift to the upsideThis is a simple Bitcoin (BTCUSD) analysis on the 1M (monthly) time-frame, using two powerful indicators that are often overlooked. Those are the Aroon Oscillator and the Vortex Indicator. The chart illustrated the Fibonacci MAs to give a sense of the long-term Support Zones, a level where we clearly are at now.
As you see, every time the Aroon Osc turns sideways following a huge downfall, the Cycle bottoms. We are now sideways since June and that is typically the market accumulation phase. Once the Aroon shifts upwards even slightly, the first rally of the Bull Cycle will have already began.
At the same time, the Vortex Indicator has already made its first Cross since April. Once the lines cross again, it will be an indication that the accumulation phase is over and the rally will begin, which is consistent with all prior Bear Cycle bottoms.
That wraps it up on this short BTC update. Remember that sometimes, it is useful to keep a long-term perspective, especially in the crypto market. And that currently tells us that most likely we won't get a better opportunity to accumulate for the new Bull Cycle. Do you agree? Feel free to share your work and let me know in the comments section below!
--------------------------------------------------------------------------------------------------------
Please like, subscribe and share your ideas and charts with the community!
--------------------------------------------------------------------------------------------------------

BITCOIN hit its 1D MA100 for the firsts time since April!Bitcoin (BTCUSD) has been trading within a sustainable Channel Up every since the June 18 Low and today hit the 1D MA100 (green trend-line) for the first time since April 21 2022. The trend looks strong considering that the MACD on the 1W time-frame is on a Bullish Cross, however if you are a short/ medium-term trader you should be skeptical of these levels.
The reason isn't just the fact that the 1D MA100 is a Resistance but as you see, the last 1W MACD Bullish Cross (March 30) was formed on a market top and failed to deliver a sustainable rise. As a result, we should be looking for a break above the November 10 2021 Lower Highs trend-line (started after the market's All Time High), which would be a bullish break-out signal towards the 1D MA200 (orange trend-line).
On the long-term, only a break above the 1D MA200 can call for a long-term trend reversal to bullish, as the MA200 was the one that rejected BTC on the March 28 High. Also on the long-term, it would be useful to consider the importance of the 0.382 - 0.5 - 0.618 Fibonacci retracement levels, when the 1D MA200 breaks, as the highest volatility of this Bear Cycle has been seen within those levels.
Feel free to share your work and comment below!
--------------------------------------------------------------------------------------------------------
Please like, subscribe and share your ideas and charts with the community!
--------------------------------------------------------------------------------------------------------
