BTC Today's strategyToday, BTC trading is relatively stable and has been fluctuating in the 80K-85K range. We are still buying near support points and selling near resistance points. Once there is a new breakout range, we can simply adjust it
Today's BTC trading strategy:
btcusdt sell@85K-87K
tp:83K-81K
Btcusdsignals

(BTC/USDT) Analysis: Supply Zone Rejection & Potential Drop to SSupply Zone (~85,296 - 84,835):
The price has reached a supply zone, which is acting as resistance. A rejection from this area could push BTC down.
Support Zone (~82,260 - 81,977):
This is a demand area where buyers might step in if the price declines.
Indicators:
EMA 30 (Red Line - 83,553.82): Short-term trend indicator.
EMA 200 (Blue Line - 83,743.52): Long-term trend indicator, currently above the price, indicating potential resistance.
Price Action & Prediction:
The price has touched the supply zone and is showing signs of rejection.
The blue projected path suggests a potential pullback followed by a drop toward the support zone (~82,260).
If price breaks below the support zone, further downside could be expected.
Potential Trade Idea:
Short Setup: If rejection at the supply zone continues, a short position could target the 82,260 support zone.
Long Setup: If price reaches the support zone and shows bullish reactions, a long position could aim for a rebound toward resistance.

BITCOIN The 2021 Pivot trend-line that is coming to its rescue.Bitcoin (BTCUSD) has stayed stable after last week's rebound on the 1W MA50 (blue trend-line), which has been the level that offered support on the Bull Cycle Channel's previous Higher Low (August 05 2024).
Technically however, that is not the only major Support level that may be coming to BTC's rescue as we've identified the Pivot trend-line that started on the April 12 2021 High as a Resistance and since then made another 2 contacts (as rejections). This is the first time now that is being tested as Support.
During the previous Cycle (2018 - 2021) a similar Pivot trend-line was the level that supported Bitcoin during the last year of its parabolic rally on January and June 2021. The June 2021 contact in particular tested the 1W MA50 as well, which is the exact situation we're in right now. That double support hold initiated the final rebound towards the Cycle's new All Time High (ATH).
Check also how similar the 1W CCI patterns between the two fractals are and based on that, a 1W CCI reading at 200.00 would be a solid level to sell and take profit. As a result, we expect this Cycle's Channel Up to accelerate the current rebound, technically its Bullish Leg and make a new ATH, which would be the Cycle's new Top, ideally with a CCI at 200.00.
So do you think this cyclical Pivot trend-line is coming along with the 1W MA50 to BTC's rescue? Feel free to let us know in the comments section below!
-------------------------------------------------------------------------------
** Please LIKE 👍, FOLLOW ✅, SHARE 🙌 and COMMENT ✍ if you enjoy this idea! Also share your ideas and charts in the comments section below! This is best way to keep it relevant, support us, keep the content here free and allow the idea to reach as many people as possible. **
-------------------------------------------------------------------------------
💸💸💸💸💸💸
👇 👇 👇 👇 👇 👇

BTCUSD SELL signal. Don't forget about stop-loss.
Write in the comments all your questions and instruments analysis of which you want to see.
Friends, push the like button, write a comment, and share with your mates - that would be the best THANK YOU.
P.S. I personally will open entry if the price will show it according to my strategy.
Always make your analysis before a trade

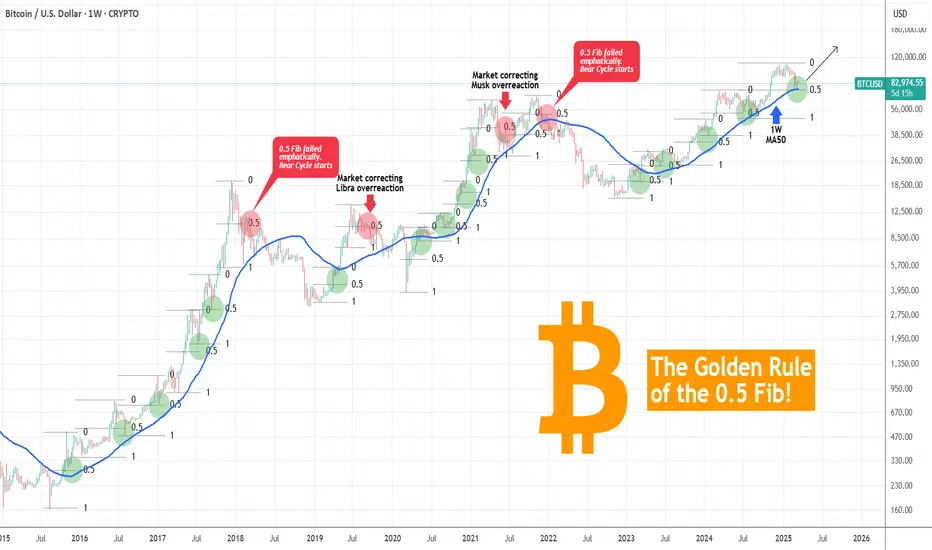
BITCOIN The 0.5 Fib Golden Rule! This is not a Bear Market yet!Bitcoin (BTCUSD) shook the bullish market sentiment last month, as late February saw it drop aggressively not just from the 109k All Time High (ATH) but also below the key psychological Support of $90000. We have discussed already how the 1W MA50 (blue trend-line) coming to its rescue, is the critical Support and rightfully so, but there is also another critical condition that is currently showing incredible strength, keeping BTC into Bull Cycle territory (for now).
That is the 0.5 Fibonacci retracement level Golden Rule. This suggests that BTC's corrections/ pull-backs up to the 0.5 Fib level are technical and perfectly systemic, especially with the 1W MA50 supporting. If anything, such pull-backs during a Bull Cycle are the most optimal buy opportunities. We are currently on an exact such opportunity as the price hit last week both the 1W MA50 and the 0.5 Fib.
In the past 10 years since the August 2015 Bear Cycle bottom, every correction up to the 0.5 Fib was a buy. In the 4 cases it broke, 2 were the signals of the 2018 and 2022 Bear Cycles and the other 2 signals of the market correcting the bullish overreaction to the Libra (2019) and Musk (2021) rallies. The latter though was still contained above the 1W MA50 and so would the 2019 one if it wasn't for the March 2020 COVID crash.
As a result, we still see no cause for concern (yet) and so far this is the best buy opportunity for Bitcoin since last year and the August 05 2024 Low.
But what do you think? Is this 0.5 Fib Golden Rule coming to push Bitcoin higher to its next ATH? Feel free to let us know in the comments section below!
-------------------------------------------------------------------------------
** Please LIKE 👍, FOLLOW ✅, SHARE 🙌 and COMMENT ✍ if you enjoy this idea! Also share your ideas and charts in the comments section below! This is best way to keep it relevant, support us, keep the content here free and allow the idea to reach as many people as possible. **
-------------------------------------------------------------------------------
💸💸💸💸💸💸
👇 👇 👇 👇 👇 👇
BTC Today's strategyThe support level of Bitcoin has begun to move upward. Currently, the market is still trading in the range of $80,000 to $85,000. The short-selling strategies I continuously provided have also made profits many times.
This week's BTC trading range could be broken at any time. We just need to wait for the market to show a new direction and then adjust our strategy
Today's BTC trading strategy:
btcusdt sell@85K-87K
tp:83K-81K
We will share various trading signals every day. Fans who follow us can get high returns every day. If you want stable profits, you can contact me.

BTCUSD Analysis StrategyBitcoin prices are currently hovering around $84,000 as the market's bull-bear struggle intensifies.
In the short term, Bitcoin remains in a sideways consolidation and base-building phase. Traders are advised to remain nimble and adjust strategies based on the actual breakout direction.
Bitcoin Trading Strategy
sell @ 87000
buy @ 81500,78500
Finally, I'd like to remind every investor that the cryptocurrency market is inherently highly volatile, and every decision you make may have an impact on your investment returns.
you can visit my profile for free strategy updates every day.

BTC Today's strategyThe support level for Bitcoin has started to move upwards. Currently, the market is still trading in the range of 80K to 85K. The consecutive short bets I have offered have also been profitable many times
If you are currently unsatisfied with the bitcoin trading results and are looking for daily accurate trading signals, you can follow my analysis for potential assistance.
Today's BTC trading strategy:
btcusdt sell@85K-87K
tp:83K-81K

BTC Today's strategyAt present, BTC is still fluctuating in the range of 80K-85K. This week, after reaching around 85K many times, it started to fall, and the consecutive short bets I provided also made profits many times.
If you are currently unsatisfied with the bitcoin trading results and are looking for daily accurate trading signals, you can follow my analysis for potential assistance.
Today's BTC trading strategy:
btcusdt sell@85K-87K
tp:83K-81K

BTCUSD SELL PATARAN Resistance Zone (Red Box at ~$85,000)
The price has reached a strong resistance level.
A double-top pattern is forming, suggesting a potential reversal.
There is a rejection from the resistance zone, indicating selling pressure.
Support Levels (Blue Boxes at ~$83,000 & ~$81,500)
If the price breaks below the minor consolidation, it may test the first support level (~$83,000).
A further breakdown could push BTC towards the second support (~$81,500).
Trendline Support (~$79,000 - $80,000)
The red trendline suggests BTC may find stronger support around $79,000, aligning with a potential descending move.
Bearish Scenario (If resistance holds)
BTC fails to break above $85,000.
A reversal pattern (double top) leads to a breakdown to support levels.
A possible downward trend towards trendline support at ~$79,000.
Bullish Scenario (If resistance breaks)
If BTC breaks and holds above $85,000, we may see continuation towards $87,000 - $89,000.
Confirmation would require strong volume and a retest of resistance turning into support.
Conclusion:
Currently, the chart leans bearish unless BTC breaks above $85,000 convincingly.
Watch for support reactions and confirmation of a breakdown before shorting.
If BTC holds above $85,000, a bullish continuation is possibl

BTC Today's strategyThe balance of long and short power in the market suggests that there may be explosive movements in the short term. At present, the price of Bitcoin is fluctuating in the range of 82,000-85,000 US dollars, and the short-term resistance is at 86,000 US dollars. A break through 86,000 US dollars could trigger a new round of gains
Bitcoin ETF funds have seen net outflows for five consecutive weeks, with demand falling to the lowest level in 2025, indicating that institutional funds are withdrawing and market sentiment is turning cautious. However, institutions such as MicroStrategy continue to buy, providing some support for bitcoin prices
The market is worried about the risk of possible liquidity tightening before the FOMC meeting in March, the uncertainty of the global economic situation and the signs of monetary policy adjustment in some major economies, making traditional financial marekts more attractive, and there is a trend of capital flowing back from the cryptocurrency market to the traditional financial field, which has some pressure on the bitcoin price
btcusdt sell@85500-86500
tp:83K-81K
We will share various trading signals every day. Fans who follow us can get high returns every day. If you want stable profits, you can contact me.

BITCOIN Is this a Falling Wedge bottom formation?Bitcoin (BTCUSD) is trading since the February 28 Low within a Falling Wedge pattern, below the 1D MA50 (blue trend-line) and at the same time supported by the 1W MA50 (red trend-line).
Throughout its dominant Bull Cycle pattern, the +2 year Channel Up, it has formed another 6 such Falling Wedges, all below the 1D MA50 and all turned out to be market bottom formations, which paved the way for an immediate bullish break-out. On all occasions, the 1D CCI has been almost as low as on the February Low.
The shortest rebound it made before another break below the 1D MA50, was +26.68% and the highest was +106.96%. As a result this gives us a minimum immediate potential Target of $96800 and a maximum of a little more than $150000. Given that the price has touched the bottom of the long-term Channel Up, like the bottom formations of September 06 2024 and September 11 2023, it is quite likely to see the stronger rebound probability taking place.
But what do you think would be the case? Is this a classical Falling Wedge bottom break-out formation and if so what may be the Target? Feel free to let us know in the comments section below!
-------------------------------------------------------------------------------
** Please LIKE 👍, FOLLOW ✅, SHARE 🙌 and COMMENT ✍ if you enjoy this idea! Also share your ideas and charts in the comments section below! This is best way to keep it relevant, support us, keep the content here free and allow the idea to reach as many people as possible. **
-------------------------------------------------------------------------------
💸💸💸💸💸💸
👇 👇 👇 👇 👇 👇

BTC Today's strategyIndustry News: Japanese listed company Metaplanet increased its holdings of 162 BTC, which to some extent reflects institutional optimism towards Bitcoin, and may have a positive impact on market sentiment, attracting more investors to pay attention and buy. However, Bitcoin's real-world application is still relatively limited, and its fundamentals are still relatively weak, which may limit the price of Bitcoin in the long run.
From the supply side, after bitcoin hit its highest price in history, short-term holders (STH) increased their holdings, while long-term holders (LTH) decreased their holdings. This change in supply pattern reflects the growing speculative atmosphere in the market, and short-term traders are more sensitive to price fluctuations, which may lead to increased volatility in bitcoin prices. From the demand side, despite the continued increase in bitcoin holdings by institutional buyers and ETFs, actual spot demand continues to decline. If demand does not recover, bitcoin's continued rally may be difficult to maintain.
Overall, the price of Bitcoin on March 14, 2025 is currently showing a certain upward trend, but the overall trend is still facing many uncertainties. A variety of factors such as the macroeconomic environment, the Federal Reserve's monetary policy, industry dynamics, and market supply and demand are all having an impact on the trend of Bitcoin.
buy:77K-79K
tp:83K-85k
We will share various trading signals every day. Fans who follow us can get high returns every day. If you want stable profits, you can contact me.

BITCOIN Money Supply, Dollar and Bonds pushing for MEGA RALLY!This is not the first time we publish a Bitcoin (BTCUSD) analysis in relation to the U.S. Dollar Index (green trend-line) or Chinese Bonds (red trend-line) and Global Liquidity (blue trend-line). In fact we have been doing this since the late 2022 bands in China and like the highly bearish sentiment that was in the market then, we decided to dive into this cross-asset analysis yet again in order to put the current sentiment in perspective.
Well it couldn't be more relevant. What we discovered is that all the financial assets mentioned above have yet again aligned to offer the strongest bullish confirmation for BTC since the November 2022 Bear Cycle bottom!
More specifically, we are a little past the point where the DXY peaks and declines aggressively, Global Liquidity bottoms and starts rising, while Chinese bonds (our CN02Y/CN20Y ratio) bottom and rise aggressively. In the past 10 years this combination of events has happened 6 times, 2 times during each Cycle: one at the bottom of the Cycle and the other when the final, most aggressive rally starts.
Notice also that (naturally) this is where the stock market (SPX, black trend-line) also bottoms and starts rising aggressively.
As a result, the above market conditions are an indication that despite the recent monthly correction and turbulence due to a number geopolitical and other trade fundamental reasons, the macro-economic parameters remain intact for the wider picture of this Cycle. Truthfully, this is where an announcement next week of future Fed Rate Cuts would come very handy.
So what do you think of this analysis above? Are you fearful that a new Bear Cycle is starting or more confident that the market will soon recover and price a new High? Feel free to let us know in the comments section below!
-------------------------------------------------------------------------------
** Please LIKE 👍, FOLLOW ✅, SHARE 🙌 and COMMENT ✍ if you enjoy this idea! Also share your ideas and charts in the comments section below! This is best way to keep it relevant, support us, keep the content here free and allow the idea to reach as many people as possible. **
-------------------------------------------------------------------------------
💸💸💸💸💸💸
👇 👇 👇 👇 👇 👇

BITCOIN Cycle pattern completed. Year-end Target locked at $150kBitcoin (BTCUSD) is showing the first signs of life after nearly testing the 1W MA50 (blue trend-line) early this week. Whether this leads to a full on recovery or not, can been partially answered by this Cycle's price action so far.
Historically we do know that BTC's Bull Cycles so far tend to peak towards the end of their 3rd year and that's 2025. This Cycle has been predominantly trading within a Fibonacci Channel Up, since its very start, the November 2022 bottom. Its 1W MA50 has been supporting since the March 13 2023 break-out, so it's been exactly 2 years of holding and throughout this time period has provided two excellent buy opportunities.
As you can see, the Channel Up can be classified into two main Phases so far: each has a Primary correction (red) of more than -30% drop, followed by a rally (blue), then a Secondary correction (yellow) of more than -20%, followed by the second and last rally (blue). All rallies have so far been around +100%. Based on this model, we are now on the Secondary correction of Phase 2.
Notice that all corrections (either primary or secondary) hit or approached apart from the 1W MA50, the 0.382 Fibonacci retracement level from their previous Low. This is actually the first time that the price has marginally broken below the 0.382 Fib. At the same time, the 1D RSI almost got oversold last week (34.50) and according to the August 05 2024 (Higher) Low, this is were a series of RSI Higher Lows would be a signal of a new bottom formation.
The bottom and recovery process may take a while though, another 4-6 weeks. According to the Time Fibs (blue dashed vertical lines), each correction (whether primary or secondary) has ended at or a little before the 1.0 Fib with the 0.0 being the bottom of the previous one and 0.5 Fib the Top of the rally. Based on this, we can expect the new rally to start by the week of April 28 the latest.
So now as to how high this can get, if it repeats the 'weakest' rally of the Channel's three so far, it should rise by +95.95%, which gives us a straight price of $150000 as a Target. If the rally symmetry also holds, this should come by late September, perfectly aligning with Bitcoin's historic Cycle expectation for the final year.
Do you think that will be the case? Recovery starting within 4-6 weeks and if so, are you expecting $150k? Feel free to let us know in the comments section below!
-------------------------------------------------------------------------------
** Please LIKE 👍, FOLLOW ✅, SHARE 🙌 and COMMENT ✍ if you enjoy this idea! Also share your ideas and charts in the comments section below! This is best way to keep it relevant, support us, keep the content here free and allow the idea to reach as many people as possible. **
-------------------------------------------------------------------------------
💸💸💸💸💸💸
👇 👇 👇 👇 👇 👇

BTC/USDT "Bitcoin vs Tether" Crypto Market Heist Plan🌟Hi! Hola! Ola! Bonjour! Hallo! Marhaba!🌟
Dear Money Makers & Robbers, 🤑💰✈️
Based on 🔥Thief Trading style technical and fundamental analysis🔥, here is our master plan to heist the BTC/USDT "Bitcoin vs Tether" Crypto market. Please adhere to the strategy I've outlined in the chart, which emphasizes long entry and short entry. 🏆💸Be wealthy and safe trade.💪🏆🎉
Entry 📈 :
"The loot's within reach! Wait for the breakout, then grab your share - whether you're a Bullish thief or a Bearish bandit!"
🏁Buy entry above 89000
🏁Sell Entry below 78000
📌However, I recommended to place buy stop for bullish side and sell stop for bearish side.
Stop Loss 🛑:
🚩Thief SL placed at 84000 (swing Trade Basis) for Bullish Trade
🚩Thief SL placed at 92000 (swing Trade Basis) for Bearish Trade
Using the 4H period, the recent / swing low or high level.
SL is based on your risk of the trade, lot size and how many multiple orders you have to take.
Target 🎯:
🏴☠️Bullish Robbers TP 110000 (or) Escape Before the Target
🏴☠️Bearish Robbers TP 62000 (or) Escape Before the Target
📰🗞️Fundamental, Macro, COT Report, On Chain Analysis, Sentimental Outlook, Intermarket Analysis, Future Prediction:
BTC/USDT "Bitcoin vs Tether" Crypto market is currently experiencing a 🐼Bearish Trend in short term (Trend will expect to move on 🐂Bullish in future),., driven by several key factors.
⭐⚡🌟Fundamental Analysis⭐⚡🌟
Fundamental analysis for BTC involves assessing its intrinsic value based on adoption, utility, network security, and regulatory developments.
Adoption & Utility: By March 2025, Bitcoin adoption has likely continued to grow, with more institutions (e.g., ETFs, corporate treasuries) and countries (e.g., El Salvador-style experiments) integrating BTC. The Lightning Network and other scaling solutions may have matured, enhancing transaction speed and reducing costs, boosting its use case as a payment system.
Network Security: Bitcoin’s hash rate is likely at an all-time high, reflecting robust miner participation despite rising energy costs. Halving cycles (last one in 2024) reduce issuance, reinforcing scarcity at $84,000.
Regulatory Environment: Global regulation remains mixed—some nations embrace BTC (e.g., pro-crypto U.S. policies under a potentially favorable administration), while others (e.g., China) maintain bans. Regulatory clarity in major markets could be a tailwind.
Development Activity: Ongoing upgrades (e.g., Taproot enhancements) signal a healthy ecosystem.
Conclusion: Fundamentals are strong, with scarcity and adoption supporting a bullish outlook, though regulatory risks linger.
⭐⚡🌟Macro Economics⭐⚡🌟
Macro factors influence BTC as both a risk asset and a "digital gold" hedge.
Inflation & Monetary Policy: By 2025, inflation may have moderated from 2022 peaks, but persistent debt levels (e.g., U.S. debt-to-GDP >130%) and money printing could bolster BTC’s appeal as an inflation hedge. If central banks (e.g., Fed) maintain loose policies or cut rates, BTC benefits.
Interest Rates: Higher rates in 2025 (e.g., 3-4%) could pressure risk assets, but BTC’s decoupling from equities (observed in prior cycles) suggests resilience.
Geopolitical Tensions: Ongoing conflicts (e.g., Russia-Ukraine, U.S.-China trade wars) and sanctions drive capital flight to decentralized assets like BTC.
Dollar Strength: A weakening USD (DXY potentially below 100) supports BTC’s rise as an alternative store of value.
Conclusion: Macro conditions lean bullish, with BTC thriving amid uncertainty and dollar erosion.
⭐⚡🌟COT Data (Commitment of Traders)⭐⚡🌟
COT reports from futures markets (e.g., CME Bitcoin futures) provide insight into institutional positioning.
Commercial Hedgers: Likely net short at $84,000, locking in profits after a rally from 2024 lows.
Large Speculators: Net long, reflecting bullish bets by hedge funds and institutions anticipating further upside post-halving.
Small Traders: Overly long and crowded, a contrarian signal of potential short-term exhaustion.
Open Interest: Rising OI at $84,000 suggests strong conviction, but a spike could signal an overleveraged market ripe for a pullback.
Conclusion: Mixed signals—bullish institutional bias with short-term caution due to retail crowding.
⭐⚡🌟On-Chain Analysis⭐⚡🌟
On-chain data reflects real-time network activity.
HODLing Behavior: High percentage of BTC unmoved for 1+ years (e.g., 65%+ of supply) indicates strong holder conviction at $84,000.
Exchange Reserves: Declining BTC on exchanges (e.g., 1.8M BTC vs. 2.5M in 2021) signals reduced selling pressure.
Transaction Volume: Stable or rising volume supports price legitimacy, though a drop could hint at waning momentum.
Realized Cap: Likely near all-time highs, reflecting long-term holders’ profits and new capital inflows.
MVRV Ratio: If above 3 (market value significantly exceeds realized value), BTC may be overbought short-term.
Conclusion: On-chain metrics are bullish, with accumulation outweighing distribution, though overbought risks emerge.
⭐⚡🌟Intermarket Analysis⭐⚡🌟
BTC’s correlation with other markets shapes its trajectory.
Equities (S&P 500): Correlation may have weakened by 2025, but a tech-led rally (e.g., AI stocks) could spill over to BTC.
Gold: Inverse correlation strengthens as BTC gains "digital gold" status—gold at $2,500/oz could coincide with BTC at $84,000.
USD: A declining DXY (e.g., 95) supports BTC’s rise.
Bonds: Rising yields (e.g., 10-year Treasury at 4%) pressure risk assets, but BTC’s safe-haven narrative mitigates this.
Altcoins: If ETH/BTC or other pairs are strong, altcoin outperformance could cap BTC dominance (e.g., 45% vs. 60% historically).
Conclusion: Intermarket trends favor BTC, with selective decoupling from risk assets.
⭐⚡🌟Market Sentiment Analysis (All Investor Types)⭐⚡🌟
Sentiment varies by cohort.
Retail Investors: Euphoric at $84,000 (e.g., X posts screaming "to the moon"), a contrarian sell signal.
Institutional Investors: Optimistic but cautious—ETF inflows (e.g., BlackRock’s BTC ETF) remain steady but not parabolic.
Whales: Accumulating dips (per on-chain data), signaling long-term confidence.
Miners: Selling pressure eases post-halving as higher prices offset lower rewards.
Social Media Trend: Search reveals polarized views—bullish memes dominate, but bearish "bubble" warnings grow louder.
Conclusion: Sentiment is overheated short-term (retail FOMO) but structurally bullish (institutional/whale support).
⭐⚡🌟Next Trend Move Prediction (Short, Medium, Long Term Targets)⭐⚡🌟
Based on technicals, cycles, and above factors:
Short-Term
Target: $92,000 (potential upside) or $78,000 (potential downside)
Prediction: A moderate level of buying pressure could push BTC towards the $92,000 level. However, if selling pressure increases, BTC could drop to $78,000.
Medium-Term
Target: $110,000 (potential upside) or $60,000 (potential downside)
Prediction: A sustained level of buying pressure could push BTC towards the $110,000 level. However, if macroeconomic conditions deteriorate, BTC could drop to $60,000.
Long-Term
Target: $140,000 (potential upside) or $40,000 (potential downside)
Prediction: A strong level of adoption and favorable regulatory environment could push BTC towards the $140,000 level. However, if the global economic outlook worsens, BTC could drop to $40,000.
⭐⚡🌟Overall Summary Outlook⭐⚡🌟
Current State: BTC at $84,000 reflects a strong rally, likely post-2024 halving, supported by fundamentals and macro conditions.
Risks: Regulatory crackdowns, overleverage, or a macro shock (e.g., recession) could trigger sharp declines.
Opportunities: Institutional adoption, dollar weakness, and scarcity drive upside.
Final Call: Short-term Bearish (correction imminent), Medium/Long-term Bullish (uptrend intact).
📌Keep in mind that these factors can change rapidly, and it's essential to stay up-to-date with market developments and adjust your analysis accordingly.
⚠️Trading Alert : News Releases and Position Management 📰 🗞️ 🚫🚏
As a reminder, news releases can have a significant impact on market prices and volatility. To minimize potential losses and protect your running positions,
we recommend the following:
Avoid taking new trades during news releases
Use trailing stop-loss orders to protect your running positions and lock in profits
💖Supporting our robbery plan 💥Hit the Boost Button💥 will enable us to effortlessly make and steal money 💰💵. Boost the strength of our robbery team. Every day in this market make money with ease by using the Thief Trading Style.🏆💪🤝❤️🎉🚀
I'll see you soon with another heist plan, so stay tuned 🤑🐱👤🤗🤩

BTCUSD buy signal. Don't forget about stop-loss.
Write in the comments all your questions and instruments analysis of which you want to see.
Friends, push the like button, write a comment, and share with your mates - that would be the best THANK YOU.
P.S. I personally will open entry if the price will show it according to my strategy.
Always make your analysis before a trade

BTCUSDT 1WBTC ~ 1W Analysis
#BTC We hope Bitcoin does not damage this bullish structure. Or everything will get worse.

There are no failed investments, only failed operationsI. Trend analysis
🔹 overall trends:
Since the beginning of 2024, Bitcoin has experienced a clear upward trend, peaking at nearly $115,000.
The price has recently fallen below several key support levels and entered a downward trend, with prices testing support in the 80,000-85,000 range.
The short-term trend remains weak, and the market may continue to seek lower support levels.
🔹 moving average system:
The short-term moving average (red, 10th) indicating that the market is still dominated by short-term bears.
The long-term moving average (blue, 60 days) has also started to turn downward, suggesting a weakening of the medium-term trend.
Conclusion: The market is still in a downward trend, and the moving average system shows no obvious signs of stabilization.
Structural analysis (K-line morphology)
📌 head and shoulders may have been completed:
From the high level formed by 93,000 to 115,000, there is a more obvious head and shoulder structure, which is currently falling below the neckline (82,000) and accelerating the decline.
If this pattern holds, the target decline level may test the 77,000-80,000 area.
📌 M head shape:
The previous two highs (around 100,000) formed an M-head and fell below key support, remaining weak in the short term.
📌 support area:
77000 (important support, if broken, the medium-term trend may accelerate to short)
72000~ 75000 (target in extreme cases)
📌 resistance areas:
89000~ 90000 (early neckline, has turned to strong resistance)
93000 (if the market rebounds, it needs to break through this level to reverse the trend)

Bitcoin Collapses $80K, What’s Next?Its price briefly stabilized around $86K over the weekend before heading south at the start of the business week. It dropped to around $80K, leaving millions in liquidations on a 24-hour basis. Later, bulls stepped in and pushed the valuation to nearly $84K. The resurgence, however, was short-lived and was followed by another free fall to as low as $79,500. As of this writing, BTC is trading around $79,000, representing a 5% drop on the day. Its market cap dropped below $1.6 trillion.
While many industry players are hopeful that this is another temporary pullback that can be replaced by a new bull run, others are not so optimistic. Next up is a re-estimation of $78K for BTCUSD, “if that fails, the next $76300, 75,500 in the crosshairs.” BINANCE:BTCUSDT BITSTAMP:BTCUSD COINBASE:BTCUSD BYBIT:BTCUSDT.P

BITCOIN Is this the last defense before the narrative changes?Bitcoin (BTCUSD) got yet again increasingly volatile during the weekend and is approaching the 1W MA50 (blue trend-line). As mentioned on the title, this is "the last defense" for BTC as so far this price action hasn't diverged a bit from the Channel Up of the 2015 - 2017 Bull Cycle but a break and 1W candle close below it, would jeopardize that.
** The key 1W MA50 **
In fact the only times that Bitcoin closed below its 1W MA50 during a Bull Cycle and the Cycle continued was of course during the March 2020 COVID global market flash crash and November 18 2019. But the current Bull Cycle is nothing like in 2019 - 2021, it doesn't have the initial overextension of the Libra hype (May - June 2019) or Elon's early 2020 hype nor of course the pandemic shutdown. On the contrary it is incredibly similar with 2015 - 2017 with the only difference being that, thanks to the ETF launch in January 2024, the market marginally breached the previous All Time High (ATH) earlier.
** Symmetry playing out **
So back to the similarities between those two Cycles. The Cycle count indicates that we are at the end of the (blue) Bull Rectangle in March 2017 (847 days) when the price almost tested the 1W MA50 and then started the (green) Parabolic Phase to new ATHs (217 days). Even in terms of 1W RSI and MACD, the two fractals are similar, with the RSI being on its 2nd 'Buy the dip Volatility Phase' bottom and the MACD on its 2nd Bullish Cross.
** How high can it get? **
Now as to how high the new Cycle Top can be, can be anybody's guess, but if it repeats the less aggressive 2021 Top, it could be on the 1.618 Fibonacci extension, i.e. around $170k, while if it repeats the (much more unrealistic for such short period of time in terms of market cap) 2017 Top, it could be on the 2.382 Fib ext, i.e. around $520k. The worst case scenario is to have Fib extension Tops on a decreasing rate, in which case the 1.5 - 1.382 levels are next, giving us a potential target range of 120k - 145k, which would be almost a Double Top similar to November 2021.
So what do you think? Will the 1W MA50 come to Bitcoin's rescue yet again or the narrative will change this time? Feel free to let us know in the comments section below!
-------------------------------------------------------------------------------
** Please LIKE 👍, FOLLOW ✅, SHARE 🙌 and COMMENT ✍ if you enjoy this idea! Also share your ideas and charts in the comments section below! This is best way to keep it relevant, support us, keep the content here free and allow the idea to reach as many people as possible. **
-------------------------------------------------------------------------------
💸💸💸💸💸💸
👇 👇 👇 👇 👇 👇

Bitcoin bullish again?I expect Bitcoin to be bullish again and return to the sell zone next week and enter a consolidation period before a big drop.
PS: Dont pay attention to the dates.. The consolidation period may take shorter or longer.

BTC/USD Ready for a BIG DROP? Next Target: Demand Zone!Bitcoin Showing Weakness – Smart Money Preparing a Move!
BTC/USD is struggling to hold key resistance levels, signaling potential distribution before a larger sell-off. Institutional players have grabbed liquidity, and a Break of Structure (BOS) to the downside confirms bearish momentum.
