BTCUSDT Forming Bullish WaveBTCUSDT is currently setting up a promising bullish wave pattern, showing signs of steady upward momentum that could deliver a healthy 10% to 20% gain in the near term. After a period of consolidation and healthy correction, Bitcoin’s price is starting to push above key resistance levels, indicating strong buying interest and renewed confidence among long-term investors and institutional traders alike. This setup has caught the attention of market participants looking to capitalize on Bitcoin’s next potential leg up.
Recent on-chain data and technical indicators show a robust foundation for this bullish wave pattern, with increasing trading volume supporting the upward move. Bitcoin continues to hold above crucial support zones, which adds further confidence for buyers aiming to ride the trend towards its next major psychological levels. The overall sentiment remains positive as Bitcoin’s dominance in the crypto market signals strength, helping to drive capital inflow from altcoins back into the king of crypto.
As we know, Bitcoin’s market behavior often sets the tone for the entire crypto ecosystem, so this bullish scenario could spill over into other major altcoins as well. Traders and investors should keep an eye on key resistance zones, potential breakout levels, and any sudden surges in volume that confirm the wave pattern is playing out as expected. Patience and disciplined risk management will be essential to maximizing profits during this phase.
✅ Show your support by hitting the like button and
✅ Leaving a comment below! (What is You opinion about this Coin)
Your feedback and engagement keep me inspired to share more insightful market analysis with you!
BTCUSDT

BITCOIN CRASH INCOMING!!! (Brace Yourself Now???) I am breaking down MARKETSCOM:BITCOIN and the potential completion of the 4th wave on an leading diagonal which might work as an early warning of a crash towards $93k!
Wait for the confirmations, and play the market with a proper trading strategy that you have backtested enough to be able to say that you will be long-term profitable. That means make sure your trading system is good enough that you always have an edge and a great enough money management system to make sure that you are giving your edge enough space to play out in the long run and be robust against losing streaks!

7.7 Analysis of the latest BTC trend and operation layout📊 Cautious wait-and-see strategy (Recommendation index ⭐️⭐️⭐️⭐️⭐️)
📰 News information:
1. Digital Market Asset Transparency Act
2. Anti-CBDC Regulation Act
3. US Stablecoin Innovation Act
📈 Technical Analysis:
At present, the price of BTC is around 109,000, and the overall narrow fluctuation pattern continues. The market as a whole lacks clear direction. However, it is worth noting that the trading volume has dropped to 30.1 billion US dollars, which has further shrunk compared with the previous day, reflecting a decline in market participation.
In my opinion, the driving factors of the market include the following:
1. The continued activity of ancient whales has attracted attention
2. The technical side shows that the momentum is weakening
3. Market sentiment has turned neutral
4. ETF fund inflows remain strong
5. The "Crypto Week" policy catalyst is coming
Currently, BTC continues to consolidate within the upward trend line, but the momentum indicator shows fatigue, the 4H Bollinger Bands shrink, and the price is running near the middle track of 108,400. Enter the market cautiously during the day and pay attention to the support of 107,000
🎯 Trading Points:
SELL 109,000-110,000
TP 107,500-107,000
In addition to investment, life also includes poetry, distant places, and Allen. Facing the market is actually facing yourself, correcting your shortcomings, facing your mistakes, and being strict with yourself. I share free trading strategies and analysis ideas every day for reference by bros. I hope my analysis can help you.
BITSTAMP:BTCUSD

BTC's Situation, A Comprehensive Analysis !!!Bitcoin is now at a point where it cannot be ignored! In my view, the bullish wave has started after the corrective wave ended. This wave could continue until it breaks the ascending triangle, then with a slight correction, push the price upward again. The current period and the coming days could be crucial in determining the market's trend.
Best regards CobraVanguard.💚

GBPJPY BULLISH OR BEARIS DETAILED ANALYSISGBPJPY has successfully broken out of a long-term falling wedge on the weekly chart, and the bullish momentum is unfolding as expected. Price has rallied from 190.00 to the current 197.00 level, delivering solid profits from the breakout zone. This continuation setup is extremely strong, with the market respecting the wedge breakout structure and forming higher highs. As long as we hold above the 190.00 support, the bullish bias remains fully intact, with 205.00 as the next key upside target.
Fundamentally, the British pound remains well-supported due to the Bank of England’s hawkish stance. Despite softer inflation data, the BoE has signaled a cautious approach to rate cuts compared to other central banks, maintaining underlying GBP strength. On the other side, the Japanese yen continues to weaken as the Bank of Japan sticks with its ultra-loose monetary policy. Yen weakness is further fueled by rising US and UK bond yields, widening the yield differential and attracting carry trades into GBPJPY.
Technically, the breakout is unfolding with textbook precision. Price has cleared descending resistance, retested it, and is now building a new leg higher. The volume profile is supporting this bullish breakout, and market structure is confirming further upside. The 200.00 psychological level may act as a minor resistance, but once cleared, 205.00 is well within range and aligns with major Fibonacci extensions.
GBPJPY is also benefiting from increased volatility in risk-on sentiment, as equity markets remain firm and bond yields rise globally. Traders are favoring high-yielding currencies like GBP while shorting low-yielders like JPY. With the fundamentals and technicals now strongly aligned, this trade is well-positioned to deliver continued profits toward 205.00 and beyond.

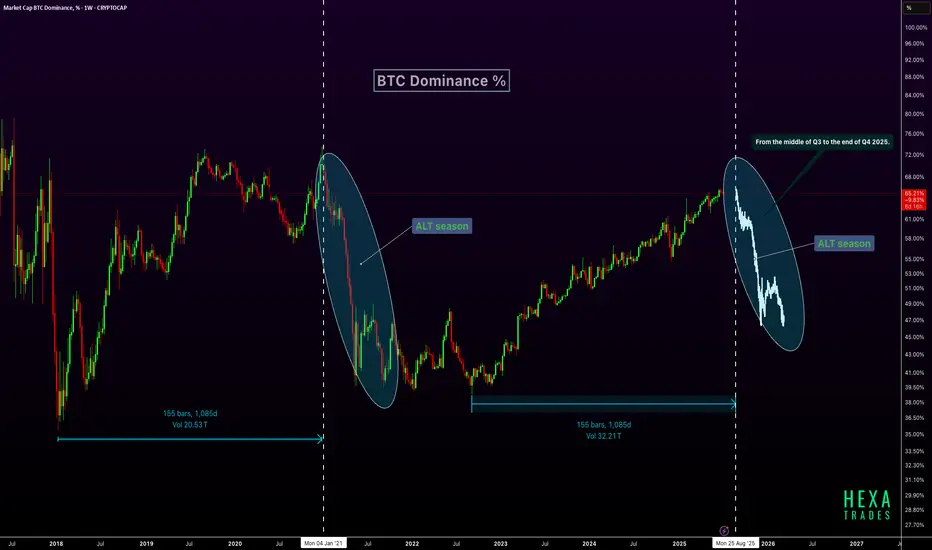
Altseason Ahead? BTC Dominance Cycle RepeatsBTC dominance is forming a pattern similar to the 2021 cycle, where dominance peaked after a long uptrend and then sharply declined, triggering a major altseason. Interestingly, that drop occurred after a 1,085-day rise, a time span we are once again approaching in 2025, projected to end around late August. If history repeats, BTC dominance could start declining from mid-Q3 2025, leading into a strong altcoin rally that may last through the end of Q4. This setup aligns with typical post-halving behavior, suggesting the final phase of the cycle could heavily favor altcoins.
CRYPTOCAP:BTC CRYPTOCAP:ETH CRYPTOCAP:XRP
Are You Really Analyzing Or Just Defending your imagination? You might think you're analyzing every time you open a chart.
But what if you're just looking for reasons to justify a bad trade?
Real analysis is data-based. Justification is emotion-based.
Let’s figure out if you're really trading smart or just lying to yourself.
Hello✌
Spend 3 minutes ⏰ reading this educational material.
🎯 Analytical Insight on Bitcoin:
BINANCE:BTCUSDT is currently testing a strong resistance near the upper boundary of its parallel channel. A breakout to the upside looks likely soon. From this level, I expect at least a 5% gain, with a main target around $114,500. 📈🚀
Now , let's dive into the educational section,
🎯 Analysis or Mental Justification?
Many traders, once they’re in a position, stop looking for truth and start looking for confirmation.
Instead of reading what the chart actually says, they twist every line and indicator to make it look like their trade still makes sense even when it doesn’t.
🛠 TradingView Tools That Kill Self-Deception
TradingView is way more than just a place to slap on some EMAs and MACDs. If used right, it can literally stop you from fooling yourself:
Replay Tool – Use this to backtest without future data bias. It trains your brain to analyze based only on the present moment.
Multi-Timeframe Layouts – View your idea across multiple timeframes. Confirmation bias collapses fast when you see the same chart from different angles.
Volume Profile – This shows where real trading happens, not where you wish it would happen.
Community Scripts & Public Indicators – Looking at someone else's logic helps you catch your own blind spots.
Idea Journal & Posts – Publish your analysis and compare it with what actually happened. You’ll quickly see how often emotion was driving your trade.
😵💫 What Does Justification Even Look Like?
It’s when you’re deep in the red but instead of managing your loss, you draw a new trendline… or add a reversed Fibonacci… or tell yourself, “It’s just a correction.”
That’s not analysis. That’s emotional defense.
💡 Know the Real Difference
Analysis = data-driven, emotion-free.
Justification = emotion-driven, data-twisted.
🔂 Why Do You Keep Making the Same Mistake?
Because your brain loves to feel right even when it's wrong.
Instead of accepting reality, it tries to bend it.
So you dig for signals to support your bad position, not question it.
🧠 The Psychology Behind the Trap
What you’re feeling is cognitive dissonance. Two thoughts fighting in your head:
“This position is failing.”
“I don’t want to be wrong.”
So your brain builds fake reasons to stay in it. Welcome to the mental loop that kills portfolios.
🎯 How To Break the Cycle
Write down why you’re entering any trade before you open it.
Only trade what you can explain, not what you hope.
Decide your stop-loss level before you enter.
If you’re “hoping” for something to turn around, it probably won’t.
🪞Be Brutally Honest With Yourself
The real question isn’t “Can you analyze?”
It’s “Can you admit you were wrong when it matters?”
Every losing trade you hold onto out of ego is a reminder that you chose comfort over skill.
⚠️ What Makes a Pro Trader?
A pro doesn’t just win trades. They cut losses fast.
They don’t “marry” a position just because they drew a trendline.
They survive by respecting truth, not bending it.
🧪 Train Your Brain To See Reality
To break the habit of self-justification, you need to rewire your analysis process. Here's how:
Before analyzing a chart, review your previous trade honestly.
Ask: What made me enter? Strategy or emotion?
Replay the chart with TradingView’s tool. If you didn’t know the future, would you still take that trade?
Answer those questions and you'll start separating real analysis from self-defense.
👁 Look at the Chart Without Bias
If you’re holding a position while analyzing, you’re probably just looking for evidence to stay in.
Try this instead: Pick a timeframe where you have no position, and do a clean analysis.
No hope. No fear. No money on the line.
That’s when real analysis happens.
🔚 Final Note
Real analysis hurts because it forces you to face mistakes. But it's also the path to real consistency.
Next time you open a chart, ask yourself:
“Am I seeking the truth or just a reason to hold on?”
One moment of honesty can change your entire trading journey.
✨ Need a little love!
We put so much love and time into bringing you useful content & your support truly keeps us going. don’t be shy—drop a comment below. We’d love to hear from you! 💛
Big thanks , Mad Whale 🐋
📜Please remember to do your own research before making any investment decisions. Also, don’t forget to check the disclaimer at the bottom of each post for more details.

BTC - Fly High or Just Nuke down?As depicted earlier in the earlier drawing, 109,850 and now little bit more push to fall it down!

Bitcoin (BTCUSD) - Daily Price Uptrend, Resistance Breakout TestBitcoin (BTCUSD) has been in a recent Daily price Uptrend, rallying up from the $100,000 price support level.
A SMA Golden Cross printed on May 21st, 2025.
Bitcoin price is attempting a resistance zone test and has yet to breakout and hold above the $111,000 to $112,000 price zone.
Resistance levels: $110,000 , $112,000 , $117,000 , $121,000.
Support levels: $108,000 , $107,000 , $105,000 , $104,000 , $100,000.
Recent crypto industry, government legislation news, and institutional crypto purchases have helped to keep Bitcoin price above $100,000 support.
Stock market correlation volatility could also affect the crypto market and prices for the next 30 to 45 days.

Bitcoin Final Push: Cycle Top in Sight?Historically, the final two quarters of a Bitcoin cycle, especially in post-halving years, have shown strong bullish trends. This pattern played out in 2013, 2017, and 2021, where Q3 and Q4 delivered significant gains leading into cycle tops. With 2025 being the post-halving year and Q2 already showing strong performance, we may be setting up for a similar rally in Q3 and Q4 if history repeats.
CRYPTOCAP:BTC BITSTAMP:BTCUSD


Bitcoin (BTC) 4H Chart – May see new ATH SOON !!Bitcoin is currently moving tightly within a broad symmetrical wedge structure. Despite multiple fakeouts and low-conviction moves, the price has managed to stay range-bound and is holding above key support, a sign of underlying strength.
Chart Structure:
Price has broken out of the downtrend resistance but is yet to confirm momentum.
The structure suggests a larger move is imminent, with bulls gradually gaining control.
Key Levels:
Immediate Resistance: $108,700
Major Resistances Ahead: $111,862 → $116,818 → $122,341
Immediate Support: $105,189
Major Support Below: $97,205
Potential Setup:
A confirmed breakout above $108,700 with volume could initiate a rally toward the next resistance zones.
Bulls must hold the $105,000 area to avoid another deep pullback into the lower structure.
Bias:
Cautiously bullish — market is waiting for a catalyst to trigger follow-through.
Stay patient, and watch for confirmation through price and volume.
DYOR. Not financial advice.

BTC - Are you the one who is long?If yes! Book, Looks like a LIQ hump trap here! Wait for 105k smooth, or let it fall to retrace up to 109,860 to initiate!

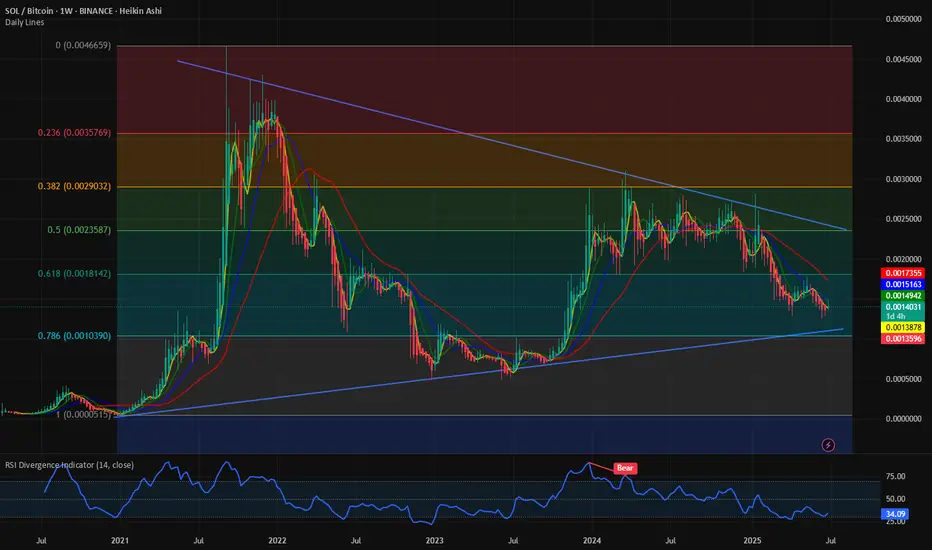
$SOLBTC: Little strength to show for. In the crypto space we time and again regularly focus on the CRYPTOCAP:BTC and the CRYPTOCAP:BTC.D chart and we have time and again predicted that CRYPTOCAP:BTC.D will touch at least 66% in this Crypto cycle. This CRYPTOCAP:BTC Dominance can be interpreted not only as the CRYPTOCAP:BTC superiority but the weakness of Altcoins. Most of it comes from the big caps like CRYPTOCAP:ETH and $SOL.
On June 23 we wrote about the BINANCE:ETHBTC failed breakout, and we put forward the case why the chart looks bearish.
BINANCE:ETHBTC failed multiyear breakout. for BINANCE:ETHBTC by RabishankarBiswal
The second largest Altcoin CRYPTOCAP:SOL is also not showing any strengths either. The BINANCE:SOLBTC chart is still range bound within the 0.618 and 0.786 Fib retracement levels. It has failed to break out of this channel, and it is boxed within the downward sloping wedge which also is not bullish for the crypto pair. The best case is BINANCE:SOLBTC sweeps the 0.5 Fib levels at the highs and 0.786 at the lows. That means BINANCE:SOLBTC valuation will be 0.0025 at its upper range and 0.001125 at its lower bound.
Verdict: BINANCE:SOLBTC range bound between 0.0025 to 0.00125 with downward bias.
Evening BTC Trend Analysis and Trading SuggestionsLet's review this afternoon's market performance. The BTC price, as we anticipated, rebounded to around 109,000 in the afternoon before plummeting sharply. Living up to "Black Friday", this violent drop was well within our expectations. In the afternoon's live trading, we also reminded everyone that as long as there was a rebound to the upper zone, it was a good opportunity to go short. This drop has created a space of nearly 1,500 points. Currently, the BTC price has pulled back to around 107,800.
From the current 4-hour K-line chart, after a strong upward surge, the market encountered significant resistance near the upper track of the Bollinger Bands. As bullish momentum gradually faded, the price started to come under pressure and decline, suggesting that the short-term upward trend may come to a temporary halt. At present, the market has recorded multiple consecutive candlesticks with large bearish bodies. The price has not only effectively broken below the key support level of the Bollinger Bands' middle track but also caused the Bollinger Bands channel to switch from expanding to narrowing, indicating that market volatility is decreasing. In terms of trading volume, it showed a moderate increase during the price pullback, which further confirms the authenticity of the bearish selling pressure.
BTCUSD
sell@108000-1085000
tp:107000-106000
Investment itself is not the source of risk; it is only when investment behavior escapes rational control that risks lie in wait. In the trading process, always bear in mind that restraining impulsiveness is the primary criterion for success. I share trading signals daily, and all signals have been accurate without error for a full month. Regardless of your past profits or losses, with my assistance, you have the hope to achieve a breakthrough in your investment.
Weekend BTC Trend Analysis and Trading SuggestionsLet's review this afternoon's market performance. The BTC price, as we anticipated, rebounded to around 109,000 in the afternoon before plummeting sharply. Living up to "Black Friday", this violent drop was well within our expectations. In the afternoon's live trading, we also reminded everyone that as long as there was a rebound to the upper zone, it was a good opportunity to go short. This drop has created a space of nearly 1,500 points. Currently, the BTC price has pulled back to around 107,800.
From the current 4-hour K-line chart, after a strong upward surge, the market encountered significant resistance near the upper track of the Bollinger Bands. As bullish momentum gradually faded, the price started to come under pressure and decline, suggesting that the short-term upward trend may come to a temporary halt. At present, the market has recorded multiple consecutive candlesticks with large bearish bodies. The price has not only effectively broken below the key support level of the Bollinger Bands' middle track but also caused the Bollinger Bands channel to switch from expanding to narrowing, indicating that market volatility is decreasing. In terms of trading volume, it showed a moderate increase during the price pullback, which further confirms the authenticity of the bearish selling pressure.
BTCUSD
sell@108000-1085000
tp:107000-106000
Investment itself is not the source of risk; it is only when investment behavior escapes rational control that risks lie in wait. In the trading process, always bear in mind that restraining impulsiveness is the primary criterion for success. I share trading signals daily, and all signals have been accurate without error for a full month. Regardless of your past profits or losses, with my assistance, you have the hope to achieve a breakthrough in your investment.
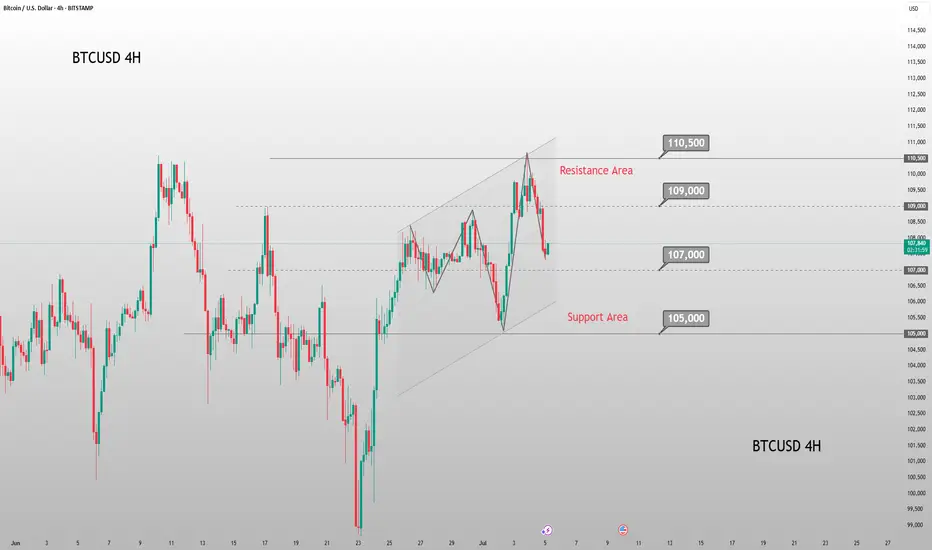
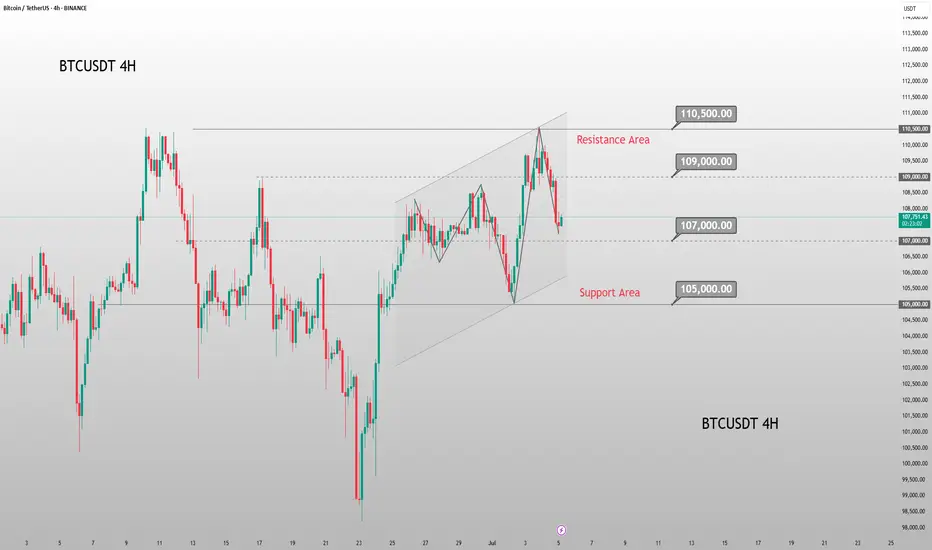
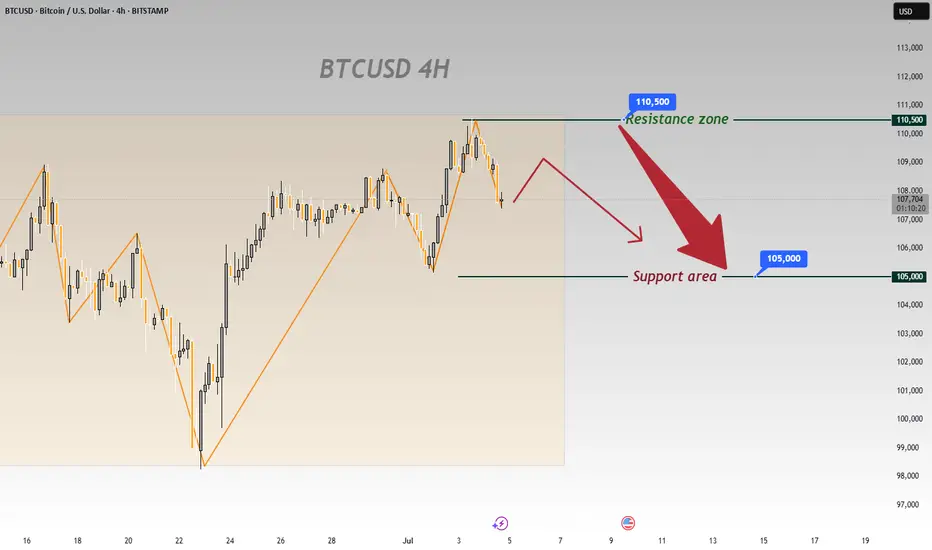
On BTCUSD’s 4 - hour chart, downside risks prevailOn BTCUSD’s 4 - hour chart, downside risks prevail:
Resistance Holds
Price failed to break 110,500, showing strong selling pressure that caps bulls 🚫. A pullback is likely.
Downtrend Signals
Post - resistance, price is retracing. Candlesticks and chart arrows point to a drop toward 105,000 support, fueled by building bearish momentum ⬇️.
Support Test Looms
105,000 is the next key level 🔑. Even if support slows the fall, the setup favors downside—bullish reversals seem unlikely after resistance failure.
Trend Weakness
Orange trendlines show the prior uptrend is fragile 🧊. Failing at 110,500 signals fading bullish force, setting up for a bearish correction.
In short, the 4 - hour chart is bearish. Watch for drops to 105,000; 110,500 will likely block bulls 🛑. Trade cautiously with this bias.
🚀 Sell@108500 - 107500
🚀 TP 106500 - 105500
Accurate signals are updated every day 📈 If you encounter any problems during trading, these signals can serve as your reliable guide 🧭 Feel free to refer to them! I sincerely hope they'll be of great help to you 🌟 👇
SCRUSDT UPDATE
Pattern: Falling Wedge Breakout
Current Price: \$0.268
Target Price: \$0.398
Target % Gain: 50.1%
Technical Analysis: SCR has broken out of a falling wedge pattern on the 12H chart with a clean close above resistance. The breakout is backed by bullish candles and increasing volume, suggesting a potential 50% move upward.
Time Frame: 12H

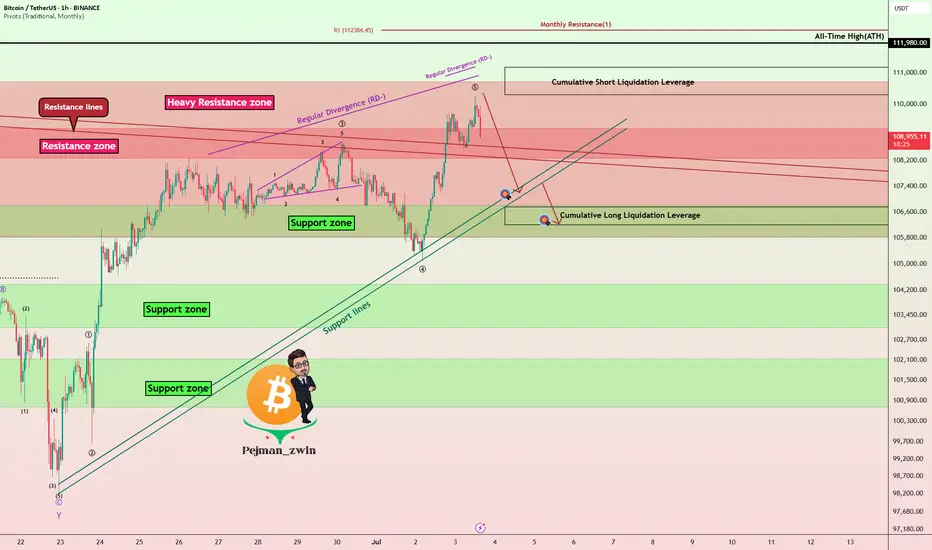
Bitcoin Roadmap => Short-termBitcoin ( BINANCE:BTCUSDT ) is moving above a Heavy Resistance zone($110,720-$105,820) , Cumulative Short Liquidation Leverage($110,300-$111,177) and is approaching All-Time High(ATH) .
Do you think Bitcoin will create a new All-Time High(ATH) in this rally?
In terms of Elliott Wave theory , Bitcoin's rise over the last two days appears to have been in the form of wave 5 .
Also, we can see the Regular Divergence(RD-) between Consecutive Peaks.
I expect Bitcoin to start declining in the coming hours. Targets are marked on the chart.
Cumulative Long Liquidation Leverage: $106,750-$106,202
Note: Stop Loss(SL)= $111,223
Please respect each other's ideas and express them politely if you agree or disagree.
Bitcoin Analyze (BTCUSDT), 1-hour time frame.
Be sure to follow the updated ideas.
Do not forget to put a Stop loss for your positions (For every position you want to open).
Please follow your strategy and updates; this is just my Idea, and I will gladly see your ideas in this post.
Please do not forget the ✅' like '✅ button 🙏😊 & Share it with your friends; thanks, and Trade safe.

BTC Analysisfor here no trade zone, short from mentioned zone and keep the sl tight, I would prefer long from the 100k zone, if we get daily closing below the mentioned zone then will long from 92-90k area, target still remains the same 112k-120k

BTC short setup As previous weekly went good on BTC, a nice bounce from the area on swing setup. Now wait for the liquidity grab from 107.8k then take short, that whiteline is important to break and sustain for btc to continue it's Bullish trend. Longer sl is just to avoid wick damage closing matter here. Good luck, book at least 50% on 105.2k rest hold the position, and take long from mentioned zone.

BTC - Isn't it obvious where it will go?BTC shorts not likely here - needs movement to top for further down momemntum!
