NEW BTC HIGHS?BTC just broke a previous resistance zone. Previous data indicates a more upward push.
This may even lead to new highs.
BTCUSDT
DMTR/usdt next target 1.2$ BULLISH MEGAPHONEHi trader,
We witness the biggest altseaon in history. Dont fall for those kids cry that we dump lower.
Last low was buy for altseason.
Im introducing you the DMTR chart and it looks like it has potential for a bullish megaphone.
Trust me this coin will go viral soon and have a lot volume and exchanges.
u looking for a altcoin that has over x50 potential not a problem im telling you now.
sincerely,
loyaltrader777

Is BTC having War INDUCED PA? - 110k?
Owing to this the movement has been commenced due to the ceasefire! Whats next?
The move can be seen on the bit up 106,500 can be eyed, just expect a bit

Bitcoin (BTCUSDT) - Price Testing Resistance after Morning StarBitcoin (BTCUSDT) price is currently testing the resistance zone of $105,000 to $110,000 (yellow lines).
A morning star candle pattern has formed above the 100 ema (orange line), which is also $100,000 price support.
Some bullish momentum is forming on the MACD Histogram, however, Bitcoin is still technically in a short-term downtrend for the past 30 days.
Bitcoin price needs to create a new uptrend on the daily chart, a series of higher-highs and higher-lows in the price, which could take several months.
At this time, Bitcoin is still reacting to global news and stock market correlations.

BTCUSD 4-Hour Analysis – Sell Setup IdeaCurrently, the trend on BTCUSD is bearish. On the 4-hour chart, I’m watching for a reaction at the Balanced Price Range (BPR) zone. This area aligns with a daily Rebalanced Breaker (-RB), adding higher time frame confluence.
In addition to the BPR, there’s an Order Block (OB) within the same region, and a nearby swing high, which strengthens the case for a bearish reaction. If price respects this zone, I expect continuation to the downside targeting the 98,000 and the 96,000 price level.

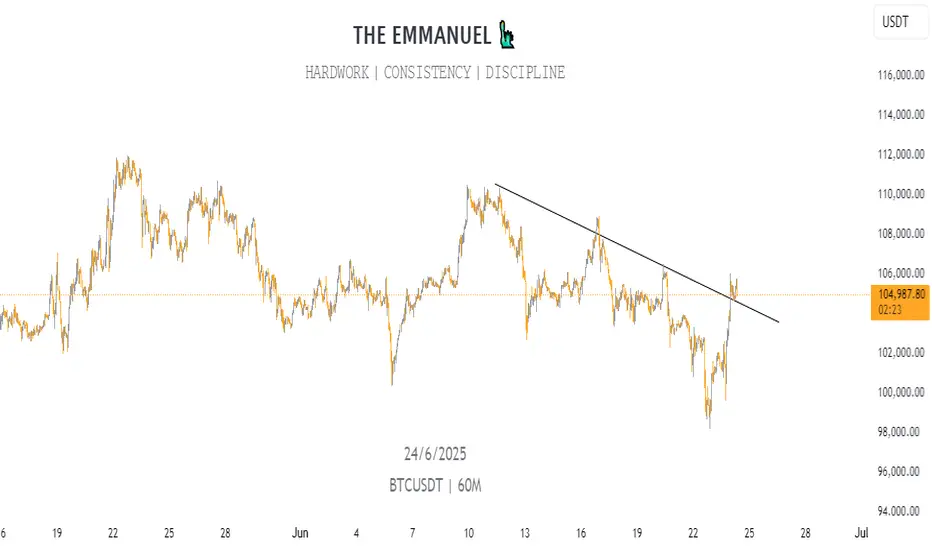
BTC is the champion our portfolio needs. BTC has some work to do. Either it will correct for a nice confrimatio low or strucure out for a bull fag. Either way, the price remains within a downward-sloping channel. That keeps me neutral bullish. But until I see a pivot point structure with signs of divergence in oversold conditions, it's difficult to get a proper RR.
Full TA: Link in the BIO

#BTC Bounced, 100EMA saved the day!100 EMA saved the day.
But the one concern? We’ve printed a new Lower Low, not a great sign.
The chart looks bouncy, but the overall structure still feels uncertain.
No point guessing or forcing trades here, I’d rather wait for clear confirmation.
I’ll share updates if I spot any changes or interesting altcoin setups.
For now, patience is our best edge. I know many altcoins might look great, but BTC Dominance is not yet done. I'll be sharing that chart tomorrow.
Stay sharp.
Hit that like button if you find this short update useful.
Thank you
#PEACE
Bitcoin: The price. I don't like it. I remember so clearly in November 2021 when Bitcoin showed bearish divergence on the weekly charts.
We might all be suffering from PTSD and fear the same outcome, especially with the potential for a double top.
If BTC is able to stay above the 1D 200MA, as well as the RSI remaining above 50, there may be hope... If not, i.e. a weekly close below and retest of the 1D 200MA; RSI <50, there might be a real cause for concern.
This, supported by a declining RSI would most certainly be a bearish signal and a shift in market trend.
Nobody knows the future and I think we're all running on hopium due to all the positive news about BTC this year.
Until BTC makes a new ATH, we may want to manage our expectations.
What are your thoughts?

BTCUSDT Update — Big Macro Forces In Play!!Hey Traders!
If you’re finding value in this analysis, smash that 👍 and hit Follow for high-accuracy trade setups that actually deliver!
Bitcoin once again testing key support levels as global tensions continue to fuel uncertainty in the markets.
Chart Overview:
BTC broke down from short-term resistance and is now retesting the major support zone between $102K–$103K. The structure still remains within a broader consolidation range, but this support zone is absolutely critical for bulls to defend.
Immediate Resistance: $106K → $110K
Immediate Support: $102K → $100K
A breakdown below $100K could trigger deeper liquidations towards $95K–$98K, while a successful defense here could push BTC back toward previous highs.
Geopolitical Impact:
Global headlines are heavily influencing risk assets right now:
🇮🇱 Israel-Iran tensions are escalating.
🇺🇸 The US is signaling stronger involvement diplomatically, adding more fear to markets.
📉 Traditional markets have already started to show signs of caution.
Bitcoin, as a risk asset, remains vulnerable to these global macro shocks in the short term.
The Game Plan Right Now:
If we see sustained support at $102K–$103K, there’s still room for a relief bounce towards $106K–$110K in the near term.
However, if global tensions escalate further, expect increased volatility with downside liquidity grabs.
Stay cautious with tight risk management. Macro headlines are still driving sudden sentiment shifts.
📊 My Bias:
Watching for potential sweep of $102K with possible reversal structure forming. Any clear reclaim of $105K may signal a local bottom.
📝 Key Takeaway:
Global narratives are bigger than technicals right now. The next few days could dictate whether BTC holds or faces another sharp liquidation event.
Stay patient. Stay disciplined. And most importantly: manage your risk.
👉 Follow for more real-time updates as we track both price action and macro headlines impacting crypto.

A bearish trend is gradually taking shape.From a technical perspective, the complete breakdown of the box bottom, coupled with the MACD indicator about to fully crossing below the zero axis, both indicate that bullish momentum is weakening and a bearish trend is gradually forming. Short-term bulls need to take a temporary break and wait for the construction of a stabilizing platform. For bears, according to the current trend, they can lay out short positions on rallies. The ideal entry position is near the lower edge of the box, and they can try to lay out positions boldly after setting stop-losses.
On the news front, "Laote"'s policies change frequently, with extremely high uncertainty. The market needs global stability, and there has been no bull market in history built in a turbulent environment. Therefore, we need to treat market conditions cautiously, avoid blind and radical operations, and only by maintaining rationality can we respond to market changes.
you are currently struggling with losses,or are unsure which of the numerous trading strategies to follow,You have the option to join our VIP program. I will assist you and provide you with accurate trading signals, enabling you to navigate the financial markets with greater confidence and potentially achieve optimal trading results.
Trading Strategy:
sell@102300-102800
TP:100000-100500

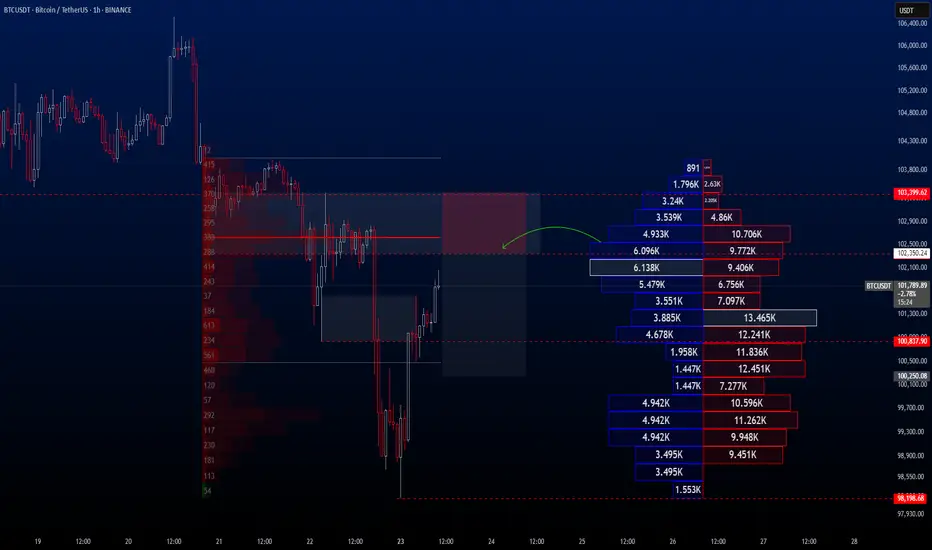
BTCUSDT Hello traders.
The BTCUSDT trade I shared the other day played out just as expected, with BTC experiencing a significant drop in value shortly after. The price fell all the way down to the 98K level.
Following this decline, I anticipate a short-term rebound toward the 102K–103K range, after which I expect the downtrend to resume. Therefore, I’ve placed a Sell Limit order at 102,350, and I’m currently waiting for the price to reach that level.
If you'd like, you can consider this opportunity in the same way.
🔍 Trade Details
✔️ Timeframe: 1-Hour
✔️ Risk-to-Reward Ratio: 1:2
✔️ Trade Direction: Sell Limit
✔️ Entry Price: 102,350.24
✔️ Take Profit: 100,250.08
✔️ Stop Loss: 103,399.62
🕒 If the trade doesn’t gain strong momentum, I will keep the position open only until 23:00 (UTC+4) today. Otherwise, I will manually close the trade—either in profit or at a loss—depending on price action.
🔔 Disclaimer: This is not financial advice. I’m simply sharing a trade I’ve taken based on my personal trading system, strictly for educational and illustrative purposes.
📌 Interested in a systematic, data-driven trading approach?
💡 Follow the page and turn on notifications to stay updated on future trade setups and advanced market insights.
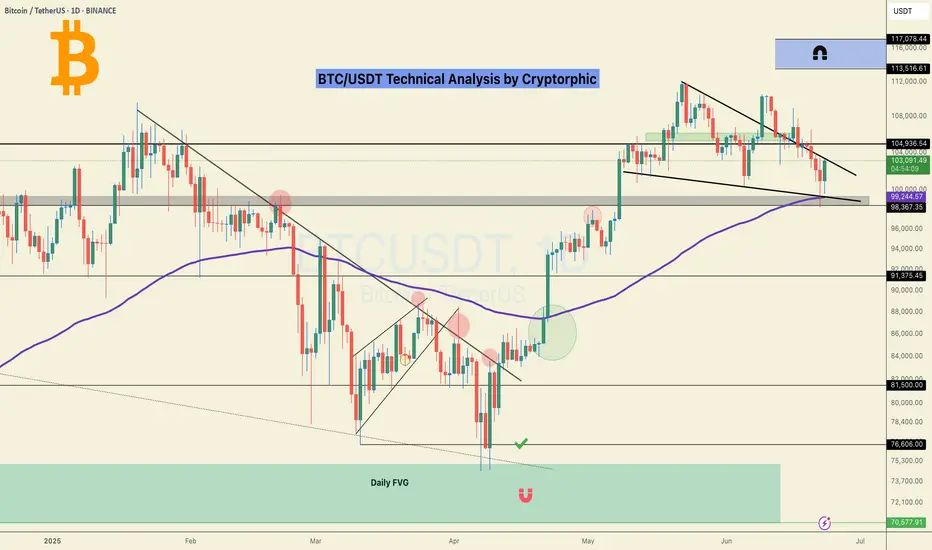
₿itcoin: PullbackBitcoin has experienced significant selling since Friday, briefly slipping below the $100,000 mark. We previously mentioned that a sharper pullback wouldn't surprise us. Whether prices will drop a bit further remains to be seen for the moment. Ultimately, we still expect Bitcoin to climb into the upper blue Target Zone (coordinates: $117,553 – $130,891) before a broader C-wave sell-off occurs, pushing the price down to the lower blue Target Zone (coordinates: $62,395 – $51,323). There, we anticipate the low of the larger orange wave a, which should mark the start of another corrective upward move. Afterward, we're preparing for the last downward leg of blue wave (ii). However, if Bitcoin directly surpasses the resistance at $130,891 – and thus our upper blue Target Zone – we'll locate it still in blue wave alt.(i) (30% probability).
📈 Over 190 precise analyses, clear entry points, and defined Target Zones - that's what we do.

BTCBTC is currently trading within an 8H short FVG. For continued upside, a clean inversion of this zone is required.
Failure to flip this level may trigger a corrective move toward the $93K–$98K range. Monitor price action closely — confirmation is key.

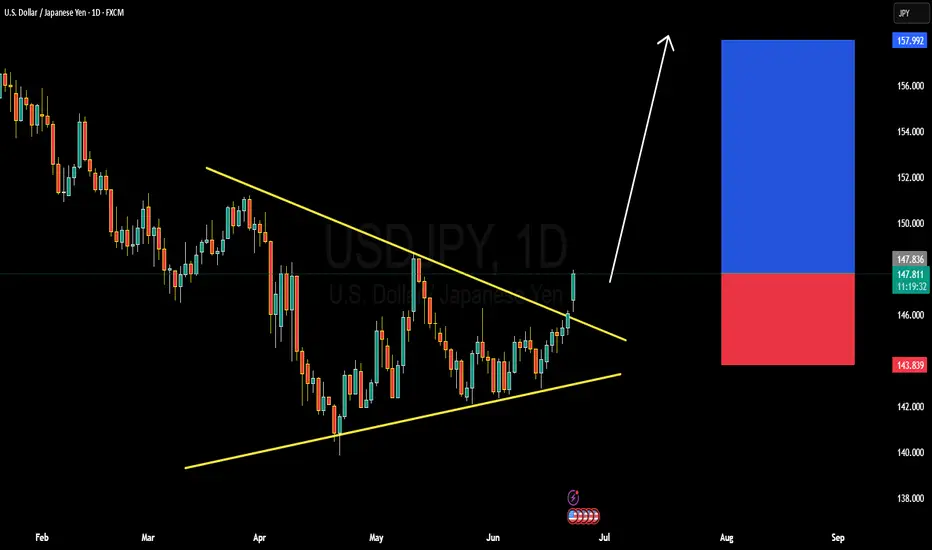
SDJPY BULLISH OR BEARISH DETAILED ANALYSISUSDJPY has successfully broken out of the symmetrical triangle structure that has been forming since early April, with today’s daily candle showing strong bullish momentum above the resistance zone around 147.500. The breakout is clean and backed by volume, which suggests that bulls are in full control. Price action is respecting the trendline structure and has now confirmed a fresh higher high, setting the stage for the next bullish leg. My immediate upside target for this move stands at 157.900.
Fundamentally, the divergence between the Federal Reserve and the Bank of Japan continues to widen. The Fed remains hawkish with inflation still sticky in the US and interest rate cuts being pushed further out. In contrast, the Bank of Japan remains ultra-dovish, with no major policy tightening in sight and continued yield curve control. This policy mismatch is keeping the Yen under consistent selling pressure. Additionally, Japan's core inflation slipped again this week, further reducing the probability of any BOJ rate hike this quarter.
The technical breakout aligns perfectly with the macro narrative. A strong bullish candle breaking structure on the daily suggests momentum will likely continue. With no strong resistance until the 157.900 area, this setup offers a high-conviction long opportunity. Traders should watch for minor pullbacks toward 147.000–146.800 as potential re-entry or add-on zones.
With rising US bond yields, weak Japanese fundamentals, and breakout confirmation on the chart, USDJPY is now well-positioned for a continuation rally. This is a trend-following setup with solid fundamentals and momentum confirmation—ideal conditions for a profitable move in the current forex environment.
U
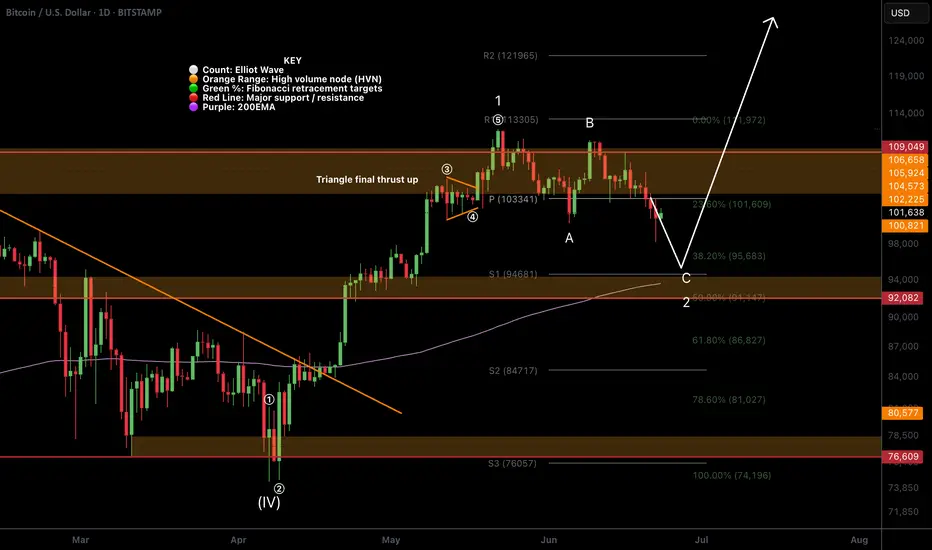
BTC Textbook Elliot Waves!CRYPTOCAP:BTC local analysis hasn't changed in a few weeks.
Price printed another text book Elliot motif wave, with the wave 4 triangle terminal pattern ending in the usual thrust up with a poke above all time high.
Price is also printing a textbook ABC for wave 2 with 5 waves down for A, 3 waves up for B and a strong wave C down to finish. Wave C's are always the strongest.
Pattern suggests price has one more push lower to complete this corrective wave tapping the quadruple support: S1 daily pivot, ascending daily 200EMA, major support High Volume Node (HVN) and 0.5 Fibonacci retracement at 92-94k range.
Most investors are publicly calling for buys in this area so price may be front run by the whales! The consensus often do not get what they want.
Safe trading
Bitcoin's Failed 60-Day Cycle: Relief Rally Before More DownsideBitcoin has officially failed its current 60-day cycle by breaking below the previous cycle low on June 5th, touching $100,000. This marks a key structural shift that traders should not ignore.
📉 What’s Next? Likely Scenario:
The highest probability setup now is a relief rally toward the Stoch RSI highs on the 1-Day and 3-Day timeframes, followed by a move downward into the 60-day cycle low, projected to form between late July and early August. This aligns with a potential retest of the Value Area Low from April, a key support zone to watch.
📈 Upside Target:
If we do see bullish continuation in the short term, the main upside target is $105,000. This level is significant as it clusters three Weekly Point of Control (POC) levels from May and June, making it a high-liquidity magnet for price. Historically, Bitcoin tends to gravitate toward these levels when several align closely.
💼 Current Positioning:
I’m currently long BTC and ETH, and I’m watching closely for Stoch RSI to top out on the 1-Day and 3-Day timeframes. I’ll look to reduce or exit those positions as we approach those cycle peaks.
🔔 Pro Tip: Price often seeks out stacked POC levels. If you’re a volume profile trader, keep $105K on your radar.
📌 P.S. For access to my custom indicators and deeper cycle analysis, check the description in my profile.

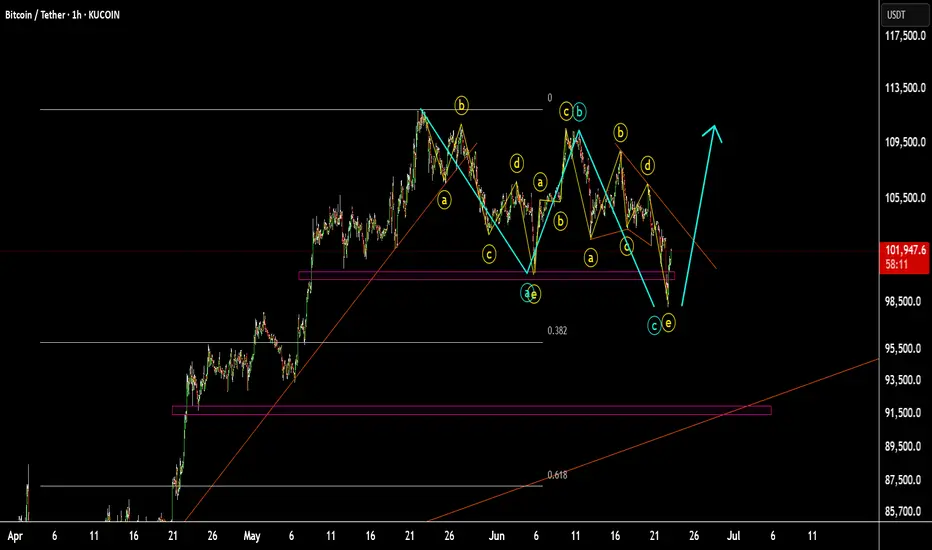
BTCUSD scenario 2#BTCUSD scenario 2 is waiting for 3 (TOP) High and then start to move down again.
scenario 1 is ZIGZAG pattern.
I dont buy at this time.
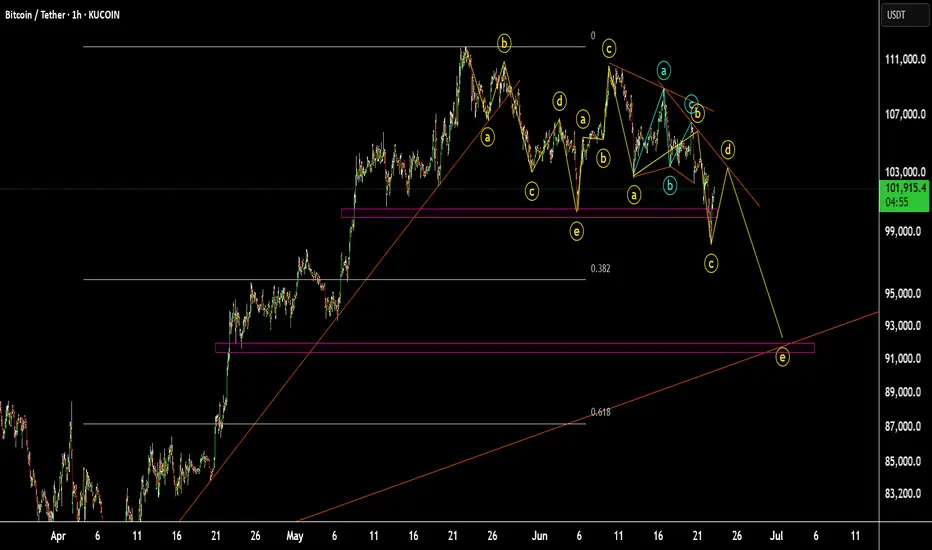
BTCUSD scenario 1#BTCUSDT is bearish umtil 92k.
because of main trendline is break
the main flow is 535 correction in this scenario.
Pullback Correction after a Sharp DeclineTechnical Analysis of BTC Contracts: As of today, on the daily timeframe (major cycle), yesterday closed with a small bearish candle, showing consecutive bearish declines. The price remains below moving averages, and attached indicators are in a death cross, clearly indicating a downward trend. With the trend being evident, two key points should be noted: First, guard against significant pullback corrections; Second, risk control must be prioritized under any circumstances, which is of utmost importance.
On the hourly timeframe (short cycle), the price fell under pressure during the US session yesterday, breaking below the 100,000 level. It rebounded after hitting the intraday low in the morning. The breakdown level is near the 102,700 area. Currently, the K-line shows a large bullish rebound, and attached indicators form a golden cross, suggesting that corrective movements will prevail today. However, the breakdown level (102,700) must not be breached; otherwise, the corrective trend may fail to sustain, which aligns with typical price movement patterns.
you are currently struggling with losses,or are unsure which of the numerous trading strategies to follow,You have the option to join our VIP program. I will assist you and provide you with accurate trading signals, enabling you to navigate the financial markets with greater confidence and potentially achieve optimal trading results.
Trading Strategy:
sell@102300-102800
TP:100000-100500

$BTC - Short-term OutlookCRYPTOCAP:BTC | 4h
We got a solid bounce off 98k
Next key level is 103.5k–104k. A clean reclaim flips short-term bias bullish.
If price gets rejected again, this likely confirms a bearish retest, and likely leading back down to the 94k–92k value area
Price could range for awhile at this level as we challenge the 104k — prior value acting as resistance.

Checking the trend change after the volatility period
Hello, traders.
If you "Follow", you can always get the latest information quickly.
Have a nice day today.
-------------------------------------
(BTCUSDT 1D chart)
This volatility period is expected to last from June 21st to 23rd.
Therefore, it is necessary to check the trend formed after the volatility period.
The 99705.62 point is the HA-High indicator point of the 1W chart, so it is important to see if there is support near this point.
If it falls without support, it may fall to around 89294.25.
The 89294.25 point is the HA-Low indicator point of the 1D chart.
Since the M-Signal indicator of the 1W chart is rising to around 99705.62, the area around 99705.62 is likely to play an important role as support and resistance.
Even if it turns upward, it must rise above the HA-High indicator point of 108316.90 of the 1D chart to maintain the price.
If not, it is likely to fall again.
-
The fact that the HA-High indicator was created means that it fell from the high point range.
In other words, if it falls below the HA-HIgh indicator point, it is likely to start a downtrend.
However, since the HA-High indicator is an intermediate value, if it is supported near the HA-High indicator, it is possible to show a stepwise upward trend.
The end point of the high point is the DOM (60) indicator.
Therefore, it should be interpreted that it has risen above the high point section only if it rises above the 111696.21 point.
Therefore, depending on how the 108316.90-111696.21 section is broken upward, an upward trend can be predicted.
----------------------------------------------------------------------
There are auxiliary indicators OBV indicators made of Low Line ~ High Line channels and PVT-MACD oscillator indicators.
The OBV indicator made of Low Line ~ High Line channels is an indicator that can see how the channel is structured, and whether OBV falls below the Low Line of the channel or rises above the High Line.
Therefore, you can predict the future trend based on the channel pattern.
-
The PVT-MACD oscillator indicator is an indicator created by adding the Close value dash PVT value to the MACD formula.
Therefore, it shows a similar appearance to the MACD oscillator indicator.
The reason for looking at the PVT-MACD oscillator indicator is to find out how the trading volume flows.
There are many trading volume indicators, but I think this PVT-MACD oscillator indicator reflects the trading volume flow well.
-
However, you should look at the support and resistance points where the changes in the movement of the PVT-MACD oscillator indicator, the OBV indicator created by the Low Line ~ High Line channel, and the StochRSI indicator occur.
If the changes in these indicators occur near the DOM(-60), HA-Low, HA-High, and DOM(60) indicator points, it can be of great help in creating a trading strategy.
The DOM(-60) indicator indicates the end point of the low point.
That is, falling below the DOM(-60) indicator means that it has entered the low point range, and there is a high possibility that it will show a full-scale downtrend.
The fact that the HA-Low indicator was created means that it has left the low point range.
That is, if it rises above the HA-Low indicator, it means that there is a high possibility that an uptrend will begin.
However, since the HA-Low indicator is an intermediate value, if it encounters resistance and falls, it is possible that it will show a stepwise downtrend.
Therefore, whether there is support in the DOM(-60) ~ HA-Low range is important.
-
Currently, the OBV indicator created as the Low Line ~ High Line channel has fallen below the Low Line.
Therefore, we need to look at whether the Low Line ~ High Line channel will change to a downtrend channel in the future.
We need to look at whether an 'M'-shaped pattern indicating a trend change occurs.
Since the PVT-MACD oscillator indicator is still below the 0 point, it can be seen that the selling force is dominant.
However, since the oscillator is maintaining an upward trend, you can see that the overall selling pressure is decreasing.
Even so, since it is located near the HA-High indicator, the resistance in the HA-High ~ DOM(60) section is expected to be considerable.
-
Support and resistance points should be drawn on the 1M, 1W, and 1D charts.
This will increase accuracy.
However, since the standard time frame chart for all indicators is a 1D chart, it is most important to check the flow of the 1D chart.
-
You may think it is difficult because you have to look at multiple indicators at once.
The most important thing is to look at the movement when approaching the HA-Low or HA-High indicator.
The reason is that the basic trading strategy is to buy near the HA-Low indicator and sell near the HA-High indicator.
-
Thank you for reading to the end.
I hope you have a successful transaction.
--------------------------------------------------
- Here is a description of the big picture.
(3-year bull market, 1-year bear market pattern)
I will explain more details when the bear market starts.
------------------------------------------------------

Bitcoin Weekly, Not Good But... Opportunities AboundI cannot say about the weekly timeframe the same I said for the daily, the situation here is different. The chart looks bad. The weekly close changes nothing.
If Bitcoin moves and closes weekly above $106,000, this can be good news, but any trading below this level has bearish potential. It can be a period of bullish consolidation but the bearish potential cannot be ignored. So, I will keep it short. Bitcoin remains in doubt on the weekly timeframe.
Bullish above $100,000. Bearish below $100,000.
It has been six weeks with Bitcoin moving with basically no change.
Last week's action did produce some loses for some traders, but for us the market remains the same. We focus on the altcoins, ignore Bitcoin for now, there is no growth and the action is still happening near resistance; at short-term support but overall, closer to a top than a bottom. It is risky to say the least. Many altcoins are trading at bottom prices and growing strong. We go for the low risk vs high potential for reward chart setups. We don't mind the market shaking, evolving or reacting to some geopolitical event, we do care about making the right choices... Focus on the altcoins for now, and for long...
Hold on. I shall give you more information.
Bearish action is indeed present but still weak.
Bearish volume is very low.
The fact that more than 1B worth of leveraged positions were liquidated calls for a pause. Each and every time this amount of money is taken out of peoples hands and transferred to the exchanges, the market changes direction. Regardless of the signals, the bigger picture or the long-term. This is a huge transfer, the whales are getting richer, retail is getting rekt.
So, the market is likely to shake some more. This is only because Bitcoin is trading way too high and hasn't produced any significant retrace after considerable growth. Again, we buy those trading low near support. We sell those trading high near resistance. As long as this is the MO, we are sure to win in the long-run.
I wouldn't want to buy-long a project that is crashing when there are others growing, yet to grow and with huge potential for growth.
Remember, the market is big now, Bitcoin is very strong above 100K. It can happen that Bitcoin goes on a retrace while the altcoins move ahead. Money flowing out of the big projects reaches the smaller projects, classic bull market dynamic. Nothing surprising; opportunities are endless.
Thanks a lot for your continued support.
Namaste.

Bitcoin Daily Bearish: If 100K Breaks, 80KBitcoin being bearish is only true if the $100,000 support level breaks. If it breaks expect the market to dive down, deep and fast and reach around $82,500 or $88,888. But this is only if the support breaks. If support holds, as it is doing so far, then you can expect higher prices in the coming weeks. If support breaks, the flush is likely to be super fast and strong which means that you will still get higher prices in the coming weeks, so the conditions remain the same mid- to long-term, only the short-term is now in question. The bears are putting pressure on the market and many LONGs have been liquidated already.
It will be nice to see how it all develops, but it shouldn't take more than two weeks. We are likely in the clear in a matter of days (2-3 days). Do not be afraid if the market shakes, Bitcoin is going up; Crypto will grow, regardless of the short-term.
Namaste.
