BTC Macro Analysis☕ 𝙂𝙈. CRYPTOCAP:BTC macro analysis update...
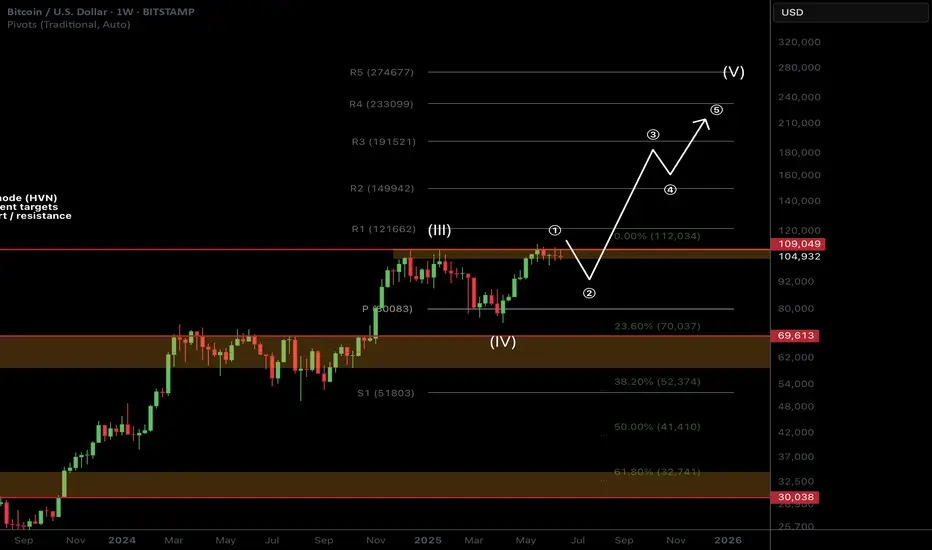
📈 𝙇𝙤𝙣𝙜 𝙩𝙚𝙧𝙢 outlook remains unchanged and recent price action is barely a blip on the weekly chart. SD+2 target is still $211k as a blow off top.
📉 𝙎𝙝𝙤𝙧𝙩 𝙩𝙚𝙧𝙢 outlook has investors looking lower towards the $92K target but this isn't guaranteed to be reached and price action may front those who wait.
War escalation's and retail selling are keeping price suppressed as price changes hands to private companies and large wallets.
The time for patience continues. Money is made in the sitting, weathering volatility, not flipping in and out of trades on every bit of news and price movement
𝙏𝙚𝙘𝙝𝙣𝙞𝙘𝙖𝙡 𝘼𝙣𝙖𝙡𝙮𝙨𝙞𝙨
Price is consolidating under all time high resistance. Consolidation under resistance has high probability of breaking out, the longer it remains the higher the probability.
Elliot Wave (EW) analysis suggests a motif wave ended with the poke above all time high (per the EW rules), with a wave 2 retracement underway. Price remains above the daily pivot (bullish) but below the DEMA (bearish). A triangle could still be forming but this is not my preferred EW count.
Safe trading
BTCUSDT
BTCUSDT – Price Poised to Break Descending ChannelBTCUSDT has been maintaining a series of higher lows since early May, consistently rebounding from its dynamic support trendline. Currently, the price is consolidating just below the descending channel resistance around the 108,000 USDT level. A clear double-bottom pattern accompanied by solid recovery momentum suggests a potential breakout from the prolonged correction phase that has persisted throughout June.
If BTC breaks above the descending trendline, the next target could be the major resistance zone near 113,000 USDT.
On the news front, the market is reacting positively to BlackRock’s announcement of expanding investment in crypto ETF products. At the same time, recent soft U.S. inflation data has strengthened expectations that the Fed may halt its tightening cycle. This combination is improving investor sentiment and driving renewed interest in risk assets like Bitcoin.

Current BTC Trend Analysis and Trading RecommendationsThe daily candlestick chart of BTC shows a three - day consecutive bearish retracement, having fallen back to the vicinity of the starting point of the previous pinbar rebound and currently remaining in a recent low - level sideways consolidation zone. However, the 4 - hour trend is pressured by the middle band of the Bollinger Bands, staying within a downward channel and forming a rebound - retracement wave pattern.
For short - term strategies, anticipate a further retracement first. Long positions should be initiated only after the support level is confirmed valid. This retracement represents a necessary consolidation phase before the bullish trend continues, and the current adjustment range does not pose a substantial threat of trend reversal to the overall uptrend. With the core upward trend intact and the direction remaining clear, BTC is expected to resume its upward momentum after a brief consolidation. The operational approach remains to go long on retracements.
BTCUSD
buy@103500-104000
tp:105500-106500
Investment itself is not the source of risk; it is only when investment behavior escapes rational control that risks lie in wait. In the trading process, always bear in mind that restraining impulsiveness is the primary criterion for success. I share trading signals daily, and all signals have been accurate without error for a full month. Regardless of your past profits or losses, with my assistance, you have the hope to achieve a breakthrough in your investment.

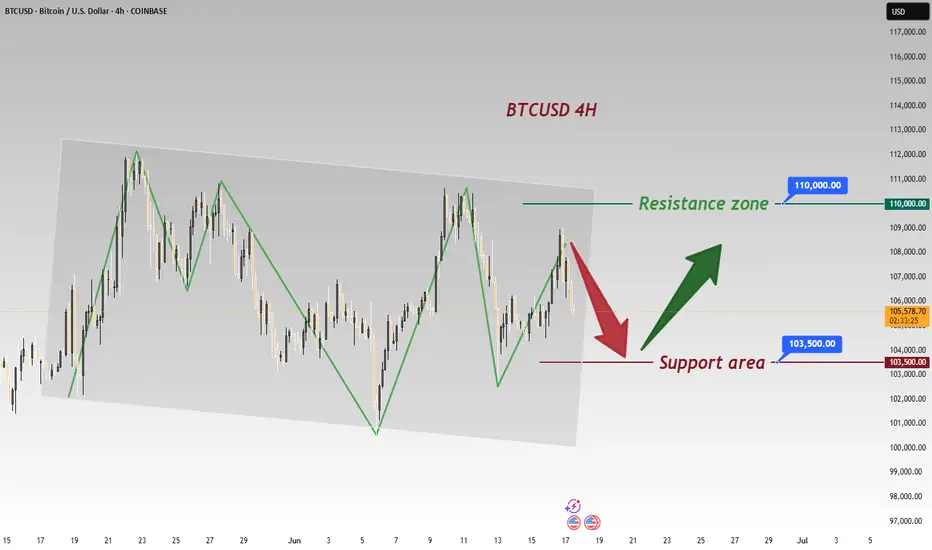
BTCUSD Tests Support—Buy for ReboundBTCUSD opened high and trended lower today 📉, now approaching the support zone—time to buy directly and ride the rebound! 🚀
⚡️⚡️⚡️ BTCUSD ⚡️⚡️⚡️
🚀 Buy@ 105000 - 105500
🚀 TP 106000 - 107500
Accurate signals are updated every day 📈 If you encounter any problems during trading, these signals can serve as your reliable guide 🧭 Feel free to refer to them! I sincerely hope they'll be of great help to you 🌟 👇
weekly BULL-FLAG!it looks like after the rally bitcoin had since early April, now this is a bull-flag pattern on weekly and that can push bitcoin to $140k.

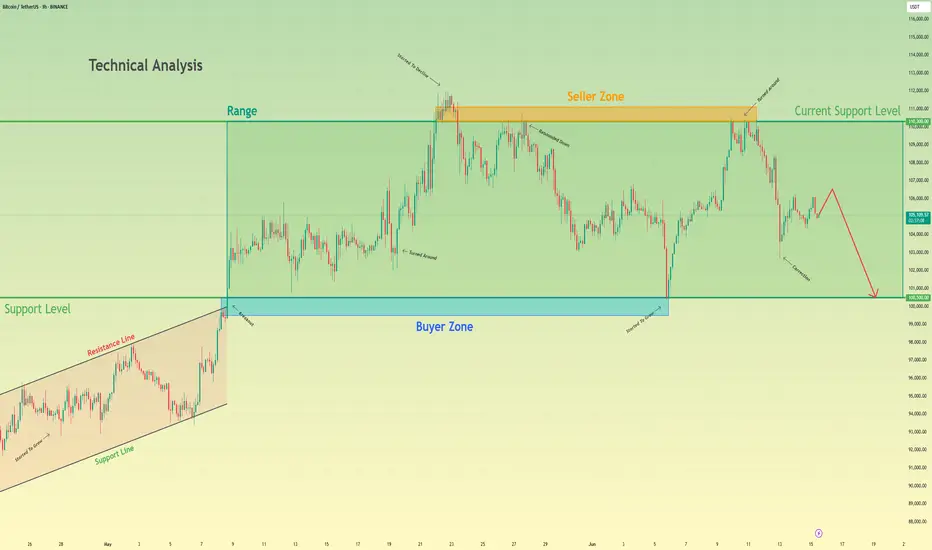
BTCUSDT. Initiative Analysis Market OverviewHey traders and investors!
📍 Context
On the daily and 4H timeframes, the market is in a sideways range (Black lines = range boundaries).
Buyer initiative is active on 4H. The target initiative is 108,952.
However, on the daily timeframe, the seller initiative is in control, and a seller zone has formed. The seller zone is the red rectangle on the chart.
📊 Key actions
The buyer attempted to break out of the range on the daily timeframe twice, but both times the seller pushed the price back inside.
The price is currently interacting with the seller zone. Watching for the reaction.
🎯 Trade Idea
🔸 Long positions — with caution. Only valid if the price holds above 105,336, aiming for the target at 108,952.
🔸 Until that happens, the priority is on further downside, in line with the current seller initiative on the daily. It’s reasonable to look for short setups if the seller defends 105,336.
This analysis is based on the Initiative Analysis concept (IA).
Wishing you profitable trades!

BTC- Can it reach 97Kish?As thing suggests the move can only be done when heavy fall is there, but as suggests lets small scalp things to our best!


Next Volatility Period: Around June 22
Hello, traders.
If you "Follow", you can always get new information quickly.
Have a nice day today.
-------------------------------------
(BTCUSDT 1M chart)
The morning star candle that we often heard about when studying candles appeared.
However, since the candle has not closed yet, the shape of the candle may change.
In stock charts, there were cases where the movement could be predicted with the shape of these candles, but in the coin market, it is impossible to predict.
The reason is that trading is possible 24 hours a day.
Most candle shapes occur with gaps, allowing for a comprehensive interpretation, but in the coin market, gaps are not likely to occur, so I think there is nothing that can be known from the shape of the candles.
Therefore, it is recommended not to try to analyze the chart with the actual shape or pattern of the candles.
However, you need to study to be able to read the arrangement of the candles in order to set support and resistance points.
Even this is not difficult to indicate support and resistance points because there are indicators that indicate support and resistance points.
-
(1W chart)
The 104463.99 point is the DOM (60) indicator point, which corresponds to the end of the high point.
Also, the 99705.62 point is the HA-High indicator point, which corresponds to the middle of the high points.
Therefore, the 99705.62-104463.99 section can be interpreted as the high point boundary section.
The actual trend is likely to occur while falling from 99705.62.
The importance of the 99705.62 point is increasing because the M-Signal indicator on the 1W chart is rising near the HA-High indicator point.
If it falls below the M-Signal indicator on the 1W chart, it is possible that the trend will be determined again when it meets the M-Signal indicator on the 1M chart.
Also, if it falls from the HA-High indicator, it can meet the HA-Low indicator.
Therefore, if the price starts to fall, you should check whether the HA-Low indicator is generated.
The fact that the HA-Low indicator was created means that it rose from the low range.
That is, just as the HA-High indicator corresponds to the midpoint of the highs, the HA-Low indicator corresponds to the midpoint of the lows.
The end point of the lows corresponds to the DOM(-60) indicator point.
-
(1D chart)
For this reason, it is important to see support around 104463.99-106133.74.
The trend is likely to appear after the next volatility period, around June 22nd (June 21st-23rd).
Therefore, we should consider the 104463.99-106133.74 range as the middle range,
- and see if it falls below 99705.62,
- or rises above 108316.90.
Accordingly, we should create a response strategy and be prepared not to panic when a trend appears.
-
The OBV is currently below the Low Line.
Therefore, if it does not receive support at the 104463.99 point, it is likely to fall again.
Since the OBV oscillator is still below the 0 point, we can see that the selling pressure is strong.
However, looking at the overall movement of the oscillator, we can see that the selling pressure is decreasing.
Therefore, if there is another decline, the key issue is whether there is support near 99705.62.
-
In summary, the area around 104463.99 is playing an important role as support and resistance.
Therefore, after the next volatility period, around June 22, we need to check and respond to the direction in which it deviates from the 99705.62-108316.90 range.
-
Thank you for reading to the end.
I hope you have a successful trade.
--------------------------------------------------
- This is an explanation of the big picture.
(3-year bull market, 1-year bear market pattern)
I will explain more details when the bear market starts.
------------------------------------------------------

Bitcoin Short-Term 4H Timeframe, Still Bullish But...Bitcoin continues bullish on the 4H timeframe and we have some positive signals coming out of the most recent swing and shakeout.
» The action went below 0.618 but is back above this level.
» The higher low did not reach 0.786 Fib. retracement support, which is a signal of strength.
» Trading volume continues to rise and as the action happens above $100,000, this signal works in favor of the bulls.
Short-term, Bitcoin continues green with the bulls in full control of the chart. When in doubt, zoom out; Crypto is going up.
This is obviously a consolidation pattern because we have higher lows but also lower highs. The revealing signal of course comes from the altcoins, look at Bitcoin Cash and you can get a good example.
The market will resolve bullish once the consolidation ends.
I say this based on market data and the charts.
If you agree leave a comment.
Thank you for reading.
Namaste.

Bitcoin Mid-Term, 4H Timeframe, Bullish ($119,165 Next Target)On the 4H timeframe we have a consolidation pattern with a bullish bias. Bitcoin is aiming higher after a close above EMA8 & 13 with higher lows.
The drop 13-June found support perfectly at 0.786 Fib. retracement on a wick. The session closed above 0.618. The action turned bullish immediately and we are seeing slow but steady growth.
The recent drop was a market reaction due to a geopolitical situation. As soon as the event is priced in, the market seeks balance and goes back to its previous trend.
Bitcoin's bullish bias is not only supported by strong prices, $105,600 is very strong, but also by the altcoins and the cyclical nature of the market.
While Bitcoin already produced several new all-time highs this year the altcoins are yet to do the same. A bull market happens every four years or the year after the halving. For Bitcoin this is already true but this is a marketwide event and the altcoins are yet to go there and this is a bullish factor and soon this will be obvious on the chart.
We are 5-6 days away only from very strong bullish action. Notice that this isn't a long time, it is less than a week. The altcoins will reveal this bullish bias much sooner than Bitcoin but Bitcoin will also grow and hit a new all-time high soon. This new all-time high will be the catalyst for everything to boom.
» Ignore the short-term it is all noise—crypto is going up.
The next target is $107,558, followed by $109,508 on this timeframe. The latter being a mild resistance.
The main target here is $119,165 and this is a good resistance zone. It can be rounded up to $120,000. If this level gets hit it will only confirm additional growth. The target that follows is $130,000 and the minimum for this cycle is $160,000 but we are aiming higher.
Feel free to follow for more.
I will continue to detail Bitcoin on all the timeframes as well as many of the top, mid- and small altcoins.
Thank you for your support.
It is appreciated.
Namaste.

BTC Trend Analysis and Trading Recommendations for TodayThe BTC market continues its sideways-down trend, with notably insufficient rebound momentum during the session. Although there were brief signs of stabilization in the early trading, bearish forces continued to exert pressure during the European session, and the index showed a staircase decline.
From the 4-hour chart analysis, the price once fell to touch the middle Bollinger Band support during the Asian session, followed by a technical rebound. However, the rebound strength was obviously weak, encountering strong resistance near the middle band. The current candlestick pattern presents a typical Dark Cloud Cover, the MACD indicator continues to release volume below the zero axis, with fast and slow lines in bearish alignment.
Technically, the price remains significantly pressured near the middle band, and the US session is likely to extend the existing downtrend. Investors are advised to maintain a bearish stance. If the price effectively breaks below the middle band support, the next target is targeted at the lower Bollinger Band. Strategically, fading rallies remains the preferred approach.
BTCUSD
sell@106500-106000
tp:105000-104000

Test the crucial round-number threshold of $100,000.Affected by sudden news factors, the Bitcoin market has seen sharp fluctuations. The price started a significant downward trend from the $108,900 level and has dropped to around $104,000 as of now. This decline has caused Bitcoin to break through multiple key support levels.
On the daily timeframe, the originally important support range of $106,000 - $107,000 was easily breached, with market bearish forces gaining absolute dominance. Bitcoin is facing significant downward risks and is highly likely to continue falling to test the crucial psychological level of $100,000.
you are currently struggling with losses,or are unsure which of the numerous trading strategies to follow,You have the option to join our VIP program. I will assist you and provide you with accurate trading signals, enabling you to navigate the financial markets with greater confidence and potentially achieve optimal trading results.
Trading Strategy:
sell@104000-104500
TP:102000-1025000

Bitcoin will make a small upward move and then continue to fallHello traders, I want share with you my opinion about Bitcoin. Earlier, the price was confidently growing inside an Upward Wedge, showing a series of higher highs and higher lows. This rising structure was supported by consistent momentum until BTC reached the seller zone between 110300 and 111100, where the growth slowed down and started to fade. From there, the price rejected this resistance and shifted into a Range, bounded by 100500 and 110300. BTC has been fluctuating inside this horizontal structure for some time, unable to break above the seller zone or below the buyer support. Now BTC is showing signs of weakness, forming a minor correction and struggling to reclaim previous highs. Given this structure and rejection from the seller zone, I expect BTC to make a small upward move and then start a decline toward the support level at 100500, which also coincides with the bottom of the range and acts as a strong psychological level. For this reason, I set my TP at 100500 points. Please share this idea with your friends and click Boost 🚀
HelenP. I Bitcoin will continue to move up inside triangleHi folks today I'm prepared for you Bitcoin analytics. After rebounding from the support level, the price initially showed strength and moved upward. However, the bullish momentum was short-lived, and the price began a downward correction, forming a well-defined descending channel. During this decline, the price dropped below the support zone, confirming short-term bearish dominance. Despite this breakdown, bulls regained control, and the price started forming a series of higher lows, resulting in the development of a symmetrical triangle. This structure signals compression and potential preparation for a breakout. The current price action confirms that BTC is now recovering within this triangle, supported by the upward trend line drawn from the recent lows. Given the strength of this recovery and the stabilization above the support zone, I expect the price to make a small correction and then continue climbing toward the resistance level at 110000. That’s why my current goal remains focused on this level, representing both a psychological and technical barrier aligned with previous local highs. If you like my analytics you may support me with your like/comment ❤️
Disclaimer: As part of ThinkMarkets’ Influencer Program, I am sponsored to share and publish their charts in my analysis.

BTCUSDTHi . after a crash market because of war , we can get big gain of this chance , MA 100 in 1h can hold and Reverse move to 110300$ . #BTC LONG Limit buy : 105800$ , Lev : 100x , SL : 105500$ , Target : 110300$

BTC/USDTHello friends, I hope you are doing well. This analysis came to my mind for Bitcoin. On the 4-hour time frame, if Bitcoin crosses the areas I specified, it will move towards its targets. It could be bullish because gold and oil were bearish yesterday. What do you think, friend?

Safello Group AB - Bullish Outlook - Small Cap Crypto Firm Safello is starting to show signs of a breakout from its weekly triangle. If Bitcoin or altcoins start to show life, I believe this stock could outperform most crypto stocks. The company is constantly innovating its offerings and is regulated under Swedish law.
I have been DCA’ing into this stock for quite a while now and will continue to do so until the consolidation is over.
Current market cap is about 10 Million USD.
Nothing here should be considered financial advice. Always do your own research and make your own decisions.
OMXSTO:SFL
CRYPTOCAP:OTHERS
CRYPTOCAP:TOTAL
COINBASE:BTCUSD
NASDAQ:COIN
COINBASE:ETHUSD

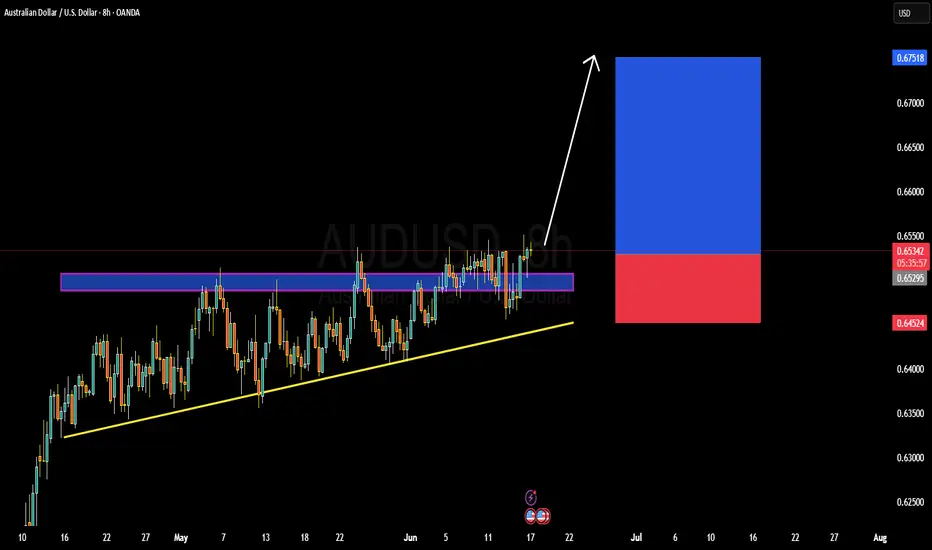
AUDUSD TECHNICALS AND FUNDAMENTALS DETAILED ANALYSISAUDUSD has officially broken out of a multi-week ascending triangle structure, and momentum is now building for a bullish continuation. The price is currently trading around 0.6533 after a strong breakout above the 0.6520 resistance zone. This consolidation was forming higher lows, signaling accumulation and bullish intent. The clean breakout above the horizontal resistance confirms buyers are in control. With this pattern validated, my short-term target is 0.6700–0.6750, aligning with the measured move projection.
From a macro perspective, AUD is gaining strength due to a divergence in monetary policy outlooks. The Reserve Bank of Australia remains hawkish, supported by sticky inflation data and a tight labor market, while the Federal Reserve has recently hinted at a dovish turn, acknowledging signs of economic slowdown. Additionally, a weaker U.S. dollar index (DXY) and rising commodity prices—especially iron ore and copper—are tailwinds for the Australian dollar. These fundamental shifts are reinforcing the bullish technical breakout.
On the 8H chart, the ascending triangle is a clear signal of bullish pressure. The zone around 0.6450–0.6520 acted as strong demand during the consolidation phase. A successful breakout retest of this zone could offer secondary entry opportunities. The risk-reward ratio is attractive, with a defined invalidation below the trendline and a target extending toward yearly highs near 0.6750.
This setup stands out as high-probability. With bullish price action, supportive fundamentals, and risk-on sentiment returning across FX majors, AUDUSD is primed for further upside. I’m holding long with conviction, expecting continuation toward the projected breakout target. This trade aligns with current market structure, trend strength, and macro drivers—perfect timing in a trending market environment.
$CYBERUSDT 6H chart Setup$CYBER/USDT Trade Setup
Breakout Retest on 6H chart
Entry: $1.362–$1.384
SL: $1.275
TP 1:- $1.753
TP 2:- $1.995
Hold above $1.362 for bullish continuation.
Watch for confirmation before entry.
DYRO, NFA

BTC ANALYSIS (4H)Last week, Bitcoin made a sharp bullish move upward, aiming for retail liquidity, which made the forecast path more difficult.
The green zone is a support area where Bitcoin might react.
To collect the ATH liquidity, Bitcoin needs to break through the red zone.
Let’s see what happens | when the market direction isn’t clear, there’s no need to take unnecessary risks.
For risk management, please don't forget stop loss and capital management
Comment if you have any questions
Thank You

Bitcoin Strategic Interval, CME Dislocation and Macro Friction.⊢
𝟙⟠ - BTC/USDT - Binance - (CHART: 1W) - (June 17, 2025).
⟐ Analysis Price: $106,851.31.
⊢
I. ⨀ Temporal Axis – Strategic Interval - (1W):
▦ EMA21 – ($96,818.00):
∴ The current candle closes +10.3% above the EMA21, maintaining bullish dominance over the mid-term dynamic average;
∴ This is the 17th consecutive weekly candle closing above the EMA21 since its reclaim in February 2025, forming a structurally intact uptrend;
∴ No violation or wick-close below the EMA21 has occurred since April, and the distance from price to EMA21 remains within a standard deviation of mid-trend movement.
✴ Conclusion: The trend is active and preserved. EMA21 acts as dynamic support and bullish pressure zone. A reversion would only be expected if weekly closes return below $98K with volume confirmation.
⊢
▦ SMA200 – ($48,969.73):
∴ The 200-week simple moving average remains untouched since early 2023, never tested during the current cycle;
∴ The slope of the SMA200 is positive and gradually increasing, indicating a long-term structural trend recovery;
∴ Price stands +118% above the SMA200, a level historically associated with mid-cycle rallies or overheated continuation phases.
✴ Conclusion: The SMA200 confirms long-term bullish structure. Its current distance from price makes it irrelevant for immediate action but critical as the absolute invalidation level of the macro trend.
⊢
▦ Ichimoku – Kumo | Tenkan | Kijun:
∴ Price is above the Kumo cloud, with Span A ($107,172.16) and Span B ($98,562.38) creating a bullish tunnel of support;
∴ The Kijun-sen rests at $95,903.19, slightly below EMA21, and aligns with the last strong horizontal range;
∴ Chikou Span is free from historical candles, confirming trend continuity under Ichimoku principles.
✴ Conclusion: All Ichimoku components are aligned bullish. Pullbacks to the Kijun around $96K would be healthy within a macro-uptrend, and only sub-cloud closes would question this formation.
⊢
▦ Fibonacci - (Swing Low $49,000 – High $111,980):
∴ Bitcoin remains between the (0.236 Fibo - $97,116.72) and local top at $111,980, showing respect for fib-based resistance;
∴ The (0.5 Fibo - $80,490.00) has not been retested since March, confirming the range compression toward upper quadrants;
∴ Weekly price is consolidating under fib extension with decreasing body size, suggesting strength with pause.
✴ Conclusion: The Fibonacci structure confirms bullish extension phase. If $97K breaks, retracement to (0.382 Fibo - $87,921.64) is expected. Otherwise, the breakout above $112K enters full projection territory.
⊢
▦ MACD – (Values: 1,077.98 | 5,963.81 | 4,885.82):
∴ MACD line remains above signal line for the third consecutive week, recovering from a prior bearish cross in April;
∴ The histogram has printed higher bars for four weeks, but the slope of growth is decelerating;
∴ Positive cross occurred just below the zero-line, which often results in delayed reactions or failures unless reinforced by volume.
✴ Conclusion: MACD signals a weak but persistent momentum recovery. Reaffirmation depends on histogram expansion above 1,500+ and signal spread widening.
⊢
▦ RSI – (Close: 64.37 | MA: 57.56):
∴ The RSI is in the bullish upper quadrant, but without overbought extension, suggesting active buying without euphoria;
∴ The RSI has been above its moving average since mid-May, maintaining a healthy angle;
∴ Momentum is not diverging from price yet, but is approaching the 70 zone, historically a point of hesitation.
✴ Conclusion: RSI confirms controlled strength. Further advance without consolidation may trigger premature profit-taking. Above 70, caution increases without being bearish.
⊢
▦ Volume - (16.97K BTC):
∴ Weekly volume is slightly above the 20-week average, marking a minor recovery in participation;
∴ There is no volume spike to validate a breakout, which is common in compressive ranges near resistance;
∴ Volume has been declining since mid-May, forming a local divergence with price highs.
✴ Conclusion: Volume profile supports current levels but does not confirm breakout potential. A rejection with strong volume will mark local exhaustion.
⊢
II. ∆ CME Technical Dislocation – BTC1! Futures:
▦ CME GAP – BTC1! – ($107,445.00):
∴ The CME Futures opened this week at $105,060.00 and closed the previous session at $107,445.00;
∴ A clear unfilled gap persists between $105,060.00 and $107,900.00, with price action hovering just above the top edge;
∴ Bitcoin has a consistent historical behavior of returning to close such gaps within a short- to mid-term range.
✴ Conclusion: The unfilled CME gap acts as a gravitational technical force. As long as price remains below $109K without volume expansion, the probability of revisiting the $105K area remains elevated.
⊢
III. ∫ On-Chain Intelligence – (Source: CryptoQuant):
▦ Exchange Inflow Total - (All Exchanges):
∴ Current inflow volume remains below the 1,000 Bitcoin daily threshold, indicating no panic selling or institutional exits;
∴ This inflow level corresponds to accumulation or holding phases, rather than distribution;
∴ The pattern matches a neutral-to-positive mid-cycle environment.
✴ Conclusion: There is no structural on-chain pressure. As long as inflows remain low, risk of capitulation or distribution is minimal.
⊢
▦ Spot Taker CVD - (Cumulative Volume Delta, 90-day) – (All Exchanges):
∴ The 90-day CVD shows continued dominance of taker buys over sells, reflecting ongoing demand strength in spot markets;
∴ However, the curve is flattening, suggesting buyers are meeting resistance or fading interest;
∴ No sharp reversal in the CVD curve is detected — only saturation.
✴ Conclusion: Demand remains dominant, but the pace is decelerating. Without renewed volume, this curve may revert or plateau.
⊢
▦ Exchange Inflow Mean - (MA7) – (All Exchanges):
∴ The 7-day moving average of exchange inflow continues to decline steadily;
∴ This metric often precedes calm phases or pre-breakout plateaus;
∴ Historical patterns show similar inflow behavior before prior volatility expansions.
✴ Conclusion: A period of silence is unfolding. Reduced mean inflow suggests price is awaiting external catalysts for movement.
⊢
▦ Funding Rates – (Binance):
∴ Current funding rates are neutral, with slight positive bias, suggesting balanced long-short sentiment;
∴ No extreme spikes indicate absence of excessive leverage;
∴ This equilibrium typically precedes significant directional moves.
✴ Conclusion: Market is leveled. Funding neutrality reflects hesitation and prepares ground for upcoming directional choice.
⊢
IV. ⚖️ Macro–Geopolitical Axis – (Powell, Middle East & BTC/XAU):
▦ MACRO CONTEXT:
∴ Jerome Powell is scheduled to speak on Wednesday (June 19), with markets anticipating remarks on rate stability or future hikes;
∴ Ongoing tensions in the Middle East (Israel–Iran) elevate risk-off behavior in traditional markets;
∴ Bitcoin has triggered a rare Golden Cross vs. Gold, as noted by U.Today, signaling digital strength over legacy value.
✴ Conclusion: Macro remains the primary external catalyst. Powell’s statement will determine short-term volatility. Until then, Bitcoin floats between its technical support and CME magnetism, with gold dynamics providing long-term bullish backdrop.
⊢
⚜️ 𝟙⟠ Magister Arcanvm – Vox Primordialis!
⚖️ Wisdom begins in silence. Precision unfolds in strategy.
⊢
