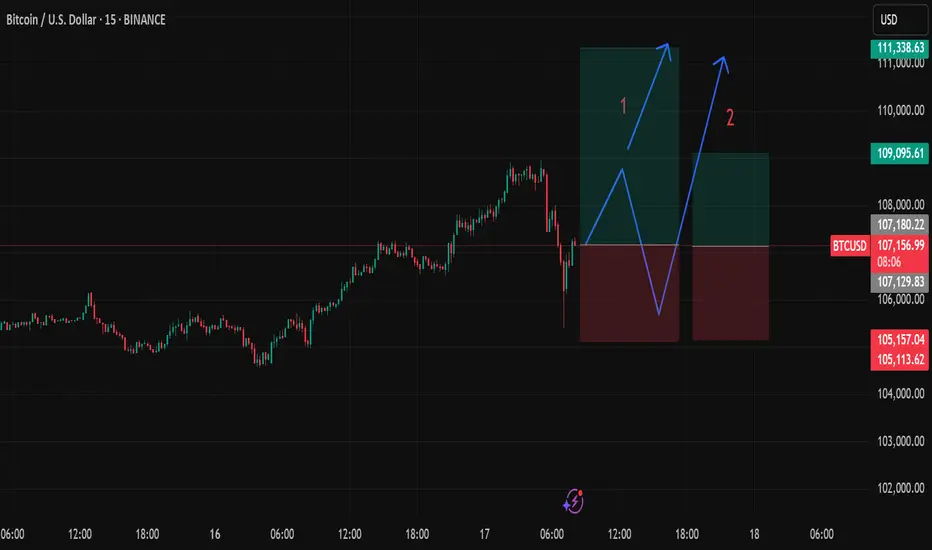
Clean Shot Short-Term buy BTCScenerio 1: go new high risk/reward very good.
Scenerio 2: go to top and go down one more time and then up to new high.
BTCUSDT
That wasn’t a breakout. That was the stop runBTC swept the high into 107,991 — precision tap of the premium fib. Now the delivery shifts. Price has already done its job: take liquidity, trigger late longs, and set up the real move.
Here’s the execution breakdown:
Price tagged the 0 level of the fib extension — 107,991 — and rejected
A clean 4H FVG sits just below around 106,195.9 (0.5), aligned with 0.382 and 0.618 fib levels (106,619.8 to 105,772.1)
This is the re-entry zone for Smart Money — not the top chasers
Expectations from here:
→ Rebalance into the 106.6–105.7k region
→ If that zone holds and price shifts structure bullish again, we retest 107.1 → 107.9 → break higher
→ If we lose 105.7 cleanly, I’m watching 104,399.9 — the deeper inefficiency magnet
This isn’t about confirmation. It’s about preparation.
More trades like this — clean, controlled, conviction-based — live in the profile description.

Bitcoin Market Analysis and Future Trend ForecastThe Bitcoin market has once again become the focus of investors. The price of Bitcoin has shown a significant upward trend, successfully breaking through the key resistance level of $106,000 per coin with an intraday increase of over 2%, demonstrating the strong vitality of the market. This price movement not only reflects the warming of positive sentiment in the cryptocurrency market but also indicates the gradual recovery of investor confidence, which has become the core driving force behind Bitcoin's current rally.
Currently, the Bitcoin price is at a critical juncture. From a daily chart perspective, after reaching an intraday high of $107,265, Bitcoin failed to effectively break through the key resistance level of $108,000 and has since retracted to fluctuate around $106,940. On the 4-hour timeframe, the MACD indicator shows that the histogram remains in positive territory, but the rate of increase has slowed, suggesting a short-term weakening of bullish momentum. Meanwhile, the RSI indicator stands at around 65, approaching the overbought zone, indicating that the market faces short-term correction pressure.
you are currently struggling with losses,or are unsure which of the numerous trading strategies to follow,You have the option to join our VIP program. I will assist you and provide you with accurate trading signals, enabling you to navigate the financial markets with greater confidence and potentially achieve optimal trading results.
Trading Strategy:
sell@107500-108000
TP:106000-106500


Bitcoin, Good News & Good News —Bullish Confirmed (Retrace Over)First, the good news is that we have a higher low and a strong recovery in place. The current candle has a long lower wick and is already trading green, at the top of the session.
The second good news is how far down the retrace went. Last time Bitcoin bottomed around $100,300, this time the bottom happened at $102,660. This is an early signal of course because the week is not yet over. It can happen that prices move higher today and tomorrow they move back down, crash on Sunday and we get a bearish close. But, looking at short-term price action and other altcoins, also the volume—notice the volume—we can say that the retrace is over and we are set to experience immediately additional growth.
The volume is the most revealing signal right now.
The drop had no volume compared to today. Today's session has more volume than the last three red-days combined.
Another signal to consider is the amount of over-leveraged gamblers that were liquidated, a total of 1 billion dollars. When this much greed is removed from the market, there is no need for lower prices.
I will call it early, the retrace is over. Time to go bullish again.
Thanks a lot for your continued support.
I will show you several more altcoins that are also looking ready to grow.
Namaste.
$NMR Breakout 240% Upside Ahead$NMR/USDT has broken out of its long-term downtrend, bouncing from a key support zone around $7.20–$7.50.
The breakout signals a potential trend reversal. If this level holds, price could target $26.50, offering a 240% upside.
DYRO, NFA

Check for support near 104463.99-106133.74
Hello, traders.
Please "Follow" to get the latest information quickly.
Have a nice day today.
-------------------------------------
(BTCUSDT 1D chart)
The next volatility period we should pay attention to is around June 22nd (June 21-23).
Currently, the HA-High indicator of the 1D chart is formed at 108316.90, so the key is whether it can rise above that point and maintain the price.
If not, there is a possibility that it will touch the M-Signal indicator of the 1W chart.
In other words, we need to check whether there is support near 99705.62.
However, we need to check whether there is support near 104463.99-106133.74.
-
If we look at the auxiliary indicator OBV, the High Line is showing a downward trend.
This means that the high point is getting lower.
Therefore, if it rises above 108316.90 this time, we need to check whether the OBV can rise above the High Line and maintain it.
-
DOM(60), DOM(-60) indicators are displayed by the Close value.
HA-Low, HA-High indicators are displayed by the (Open + High + Low + Close) / 4 value.
Therefore, HA-Low and HA-High indicators represent the middle value, and DOM(60) and DOM(-60) represent the end point value.
This makes it difficult to trade when DOM(60) and DOM(-60) indicators are generated.
To make this clearer, I added an arrow signal.
DOM(60) indicator and HA-High indicator are indicators that represent high points.
In other words, the generation of DOM(60) indicator and HA-High indicator means that there has been a decline in the high point range.
However, as I mentioned earlier, the DOM(60) indicator is not easy to respond to because it indicates the end point, but the HA-High indicator indicates the middle value, so there is time to check whether there is support near the HA-High indicator and respond accordingly.
Therefore, you should check whether there is support in the section between the HA-High indicator and the DOM(60) indicator and respond accordingly.
On the contrary, the DOM(-60) indicator and the HA-Low indicator are indicators that indicate the low point.
You can think of it as the opposite of what I explained above.
-
By not indicating the support and resistance points according to the arrangement of the candles, but using the indicator points as the support and resistance points, anyone can see how the support and resistance points were created.
This will provide important objective information for trading.
-
Thank you for reading to the end.
I wish you successful trading.
--------------------------------------------------
- This is an explanation of the big picture.
(3-year bull market, 1-year bear market pattern)
I will explain more details when the bear market starts.
------------------------------------------------------

Market Overview
WHAT HAPPENED?
Strong sales resumed last week after a short period of growth. This was provoked by the escalation of the conflict in the Middle East.
After testing and fixing the $105,800-$104,500 zone (accumulated volumes), strong volume deviations appeared, which should be perceived as protection on the part of the buyer.
WHAT WILL HAPPEN: OR NOT?
At the moment, an attempt is being made to position the volumes accumulated in the range of $105,600-$104,700 in the direction of growth. Strong support has already been formed in the area of $104,000-$102,900 (abnormal volumes).
When the four-hour candle closes above the $106,400 mark, it’ll be possible to additionally consider the zone of accumulated volumes for buys (if there is a reaction from it).
The main scenario is a long position with targets up to the nearest resistance. In case of easing of geopolitical tensions, there remains the possibility of updating the ATH.
Alternative scenario: correction to the support zone of $101,600-$100,000 (volume anomalies). With this development, a prolonged rebound is possible.
Sell Zones:
$109,000–$110,000 (accumulated volume)
Buy Zones:
$105,600–$104,700 (accumulated volume)
$104,000–$102,900 (volume anomalies)
$101,600–$100,000 (significant volume anomalies)
$98,000–$97,200 (local support)
Level at $93,000
$91,500–$90,000 (strong buying imbalance)
IMPORTANT DATES
Macroeconomic developments this week:
• Tuesday, June 17, 03:00 (UTC) — publication of the Japanese interest rate decision;
• Tuesday, June 17, 12:30 (UTC) — publication of the core retail sales index for May in the United States, the volume of retail sales for May in the United States;
• Wednesday, June 18, 06:00 (UTC) — publication of the UK consumer price index compared to May last year;
• Wednesday, June 18, 9:00 (UTC) — publication of the consumer price index in the Eurozone compared to May last year;
• Wednesday, June 18, 12:30 (UTC) — publication of the number of initial applications for US unemployment benefits;
• Wednesday, June 18, 18:00 (UTC) — publication of FOMC economic forecasts, FOMC statement, US Federal Reserve interest rate decision;
• Wednesday, June 18, 18:30 (UTC) — US FOMC Press Conference;
• Thursday, June 19, 7:30 (UTC) — publication of the Q2 interest rate decision in Switzerland;
• Thursday, June 19, 8:00 (UTC) — press conference of the National Bank of Switzerland;
• Thursday, June 19, 11:00 (UTC) — publication of the June interest rate decision in the UK;
• Thursday, June 19, 12:30 (UTC) — publication of the number of initial applications for unemployment benefits in the United States;
• Friday, June 20, 12:30 (UTC) — publication of the Philadelphia Federal Reserve's index of manufacturing activity for June in the United States.
*This post is not a financial recommendation. Make decisions based on your own experience.
#analytics

NZDJPY TECHNICALS AND FUNDAMENTALS DETAILED ANALYSISNZDJPY is currently trading around the 87.00 handle and has just bounced strongly from a well-respected support zone. The pair is now showing clear signs of recovery after a brief corrective dip, and price action on the 8H chart confirms a bullish reversal structure. The support held firmly, and we’ve already seen a solid rejection wick forming the foundation of this new impulsive leg up. With this momentum in play, I’m targeting the 90.00 zone in the coming sessions.
On the macro front, the New Zealand dollar is benefiting from a relatively hawkish RBNZ stance. Inflation pressures remain sticky in New Zealand, and the central bank has reiterated its cautious approach toward rate cuts. Meanwhile, the Japanese yen remains under persistent selling pressure due to the Bank of Japan's ultra-loose policy and intervention uncertainty. These diverging central bank outlooks are fueling continued upside in NZDJPY as carry trade flows remain in favor of the kiwi.
From a technical perspective, the market structure remains bullish. After retesting a previous higher low, price is climbing within a clean channel and has broken minor resistance levels convincingly. This aligns well with a swing continuation pattern toward the 90.00 mark. Momentum is supported by increasing bullish volume, and as long as we remain above 86.00, the bulls are firmly in control.
In my analysis, this is a textbook setup. We’re seeing higher lows, strong trend continuation, and a macro-backed directional bias. I’m long from 87.00 with a bullish outlook into 90.00. I’ll reassess price action as we approach major resistance levels, but until then, I remain confidently positioned with a clear technical and fundamental confluence.

MARKET TECHNICAL BREAK DOWN FOR 16TH TO 20TH JUNE📊 Market Technical Breakdown – EURUSD, AUDUSD, XAUUSD & BTCUSDT 🔍
Traders,
Get ready for this week’s precision-driven analysis across four major markets:
✅ EURUSD – Is the euro gaining strength or facing more downside?
✅ AUDUSD – Key zones to watch as the Aussie reacts to USD data.
✅ XAUUSD (Gold) – Will gold hold strong or give in to bearish pressure?
✅ BTCUSDT – Bitcoin’s momentum shift: Are bulls still in control?
This breakdown covers:
🔹 Clean chart analysis
🔹 Key levels (support & resistance)
🔹 Trade ideas with potential entries & exits
🔹 My personal trading insight for each pair
🎯 Whether you're a beginner or a seasoned trader, this breakdown will help sharpen your bias and build confidence in your trades.
👉 Watch the video till the end to catch all setups, confirmations, and bonus tips for the week.
Drop a comment if you found it helpful or want to see a pair included in the next breakdown!

BTC road map (4h)The BTC chart shows a bullish flag pattern, approaching a resistance level at 109k. A breakout above this level could confirm the next bullish target, but watch out for a potential reversal!
Best regards CobraVanguard.💚

BTCUSDT - UniverseMetta - Signal#BTCUSDT - UniverseMetta - Signal
D1 - Retest of the trend line + formation of a potential 3rd wave in continuation of the uptrend. Stop behind the minimum of the 2nd wave.
Entry: 106342.27
TP: 112508.54 - 116913.01 - 123639.84 - 130847.16
Stop: 102578.45

Bitcoin - Inverse Head & Shoulders on 4h (Neckline broken)Looking forward to a new ATH shortly IF the neckline holds.
BITSTAMP:BTCUSD
BINANCE:BTCUSD
COINBASE:BTCUSD
CRYPTOCAP:TOTAL
CRYPTOCAP:OTHERS
BINANCE:ETHUSD
COINBASE:ETHUSD
BINANCE:SOLUSD
OANDA:XAUUSD
FX_IDC:XAUUSD

Bitcoin Attepmpts a Comeback with the Break of 106350Bitcoin is break above the key 106350 resistance and continues to rise. As long as BTC stays above this level, short-term bullish outlook remains intact.
The biggest risk for crypto right now is its correlation with the stock market. With the July 9 tariff deadline approaching and the Israel–Iran conflict raising broader market and oil price risks, a potential selloff in equities could weigh on crypto as well.
The good news for crypto is Ethereum's strength. In the last bull cycle, when BTC neared the cycle top, ETH began to lead, pulling altcoins up with it. While the market doesn’t appear to be at that stage just yet, recent inflows into Ether ETFs suggest that BTC could be nearing its final leg higher.
In the short term, 108350 is the first level to watch.

BitcoinEntry Point:
Entry Level: 106,300 USDT
Price is currently slightly below entry (106,254.67), so the trade setup is still valid and could trigger soon.
Stop-Loss (SL):
Stop Level: 104,250 USDT
Defined just below the lower FVG zone, indicating where invalidation would occur.
Take-Profit Targets (TP):
TP1: 109,000 USDT (near minor resistance)
TP2: 113,250 USDT (major target)
The Risk-to-Reward Ratio (RRR) looks favorable — possibly over 3:1, which is strong.
Shift stop to entry after reaching TP1

Bitcoin Short-Term, 1H Timeframe, Bullish ($115,482 Next Target)Bitcoin completed its retrace 13-June 01:00 AM with a higher low at $102,663. Price action and trading volume indicates that the bearish move is over. Bitcoin is trading above support in the form of 0.618 Fib. retracement.
Bitcoin is turning bullish moving above EMA34, EMA21, EMA13 and EMA8 all in this current active session.
Immediate support stands between $105,293 and $105,314.
Next support is $104,533 and main support $104,282 matching the 0.618 Fib. retracement level.
Next target easy hit is $106,625, followed by $107,559. The second being a mild resistance.
Bitcoin can easily continue higher short-term aiming next at $108,989 followed by the last high at $110,586. Depending on how this level is handle we can update the short-term view.
The 1H timeframe is bullish now based on price action, candlestick patterns, higher lows, moving averages and the oscillators.
Namaste.

Bitcoin 100K Support Intact, The Bulls Win!Lately we've seen many cries about volume. Where is the volume? There is no volume! Etc. I tend to agree. My excuse in favor of a bullish Bitcoin was to say that low volume as prices moved higher worked as a continuation signal, things change.
We are now looking at BTCUSDT on the Daily timeframe and what I can notice is trading volume being relatively high. The days with high bull (green-buy) volume, are sometimes two to three times higher than the days with bearish (red) volume. This signal seals the deals. The bulls win.
This is a chart drawing that I used in the past. We have the low 7-April low and a higher low 5-June. Very strong bullish action for two months straight; very little retrace, weak bearish action for several weeks, the bulls win again.
The consolidation zone, the accumulation range, is defined here with blue and green, we know the price to be $100,000 and $110,000, Bitcoin trades at the exact middle, above $105,000. Giving the bulls another win.
Yesterday the action produced a higher low compared to 5-June. Even with very bad geopolitical conditions, a surprise war, Bitcoin remains strong. If not even war can break 100K as support, this simply means that Bitcoin isn't going any lower, Bitcoin is going up.
The most revealing part is the fact that Bitcoin didn't even reach 100K. Not in 5-June, not yesterday. 5-June the low was hit at 100,386. Yesterday, the low was 102,656.
There is lots of demand, supply is limited.
People are buying the dip. Whales are buying, institutions are buying; the world wants Bitcoin. Price action says Bitcoin is going up.
We can extract supporting signals from the Altcoins, Ethereum, XRP and Dogecoin are good examples, all the big projects are strong now when we consider the fact they are trading above MA200 daily and weekly, and this confirms a bullish bias with long-term growth.
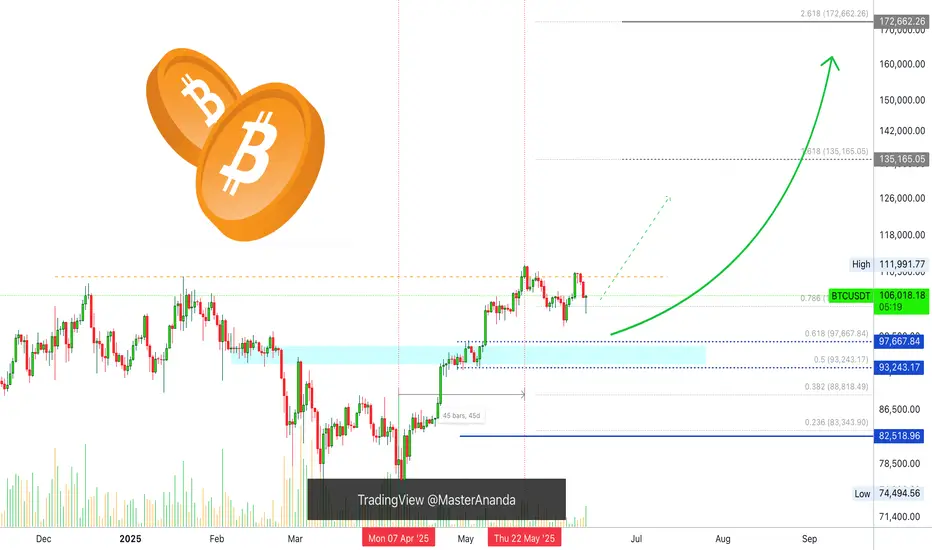
$150,000 is not the top, Bitcoin is likely to go higher by the end of the next bullish wave. We can consider prices such as $180,000 and $200,000. This is because nobody is selling. Since people are not willing to sell, prices are sure to increase. Many altcoins are now extremely bullish, small and big.
All market conditions are fully aligned, it is only a matter of time.
Patience is key. Prices will rise.
Namaste.

Middle East Tensions Drive Capital Shift: BTC May Test 100K SupCurrently, we can clearly see that BTC is in a downward trend 🔻. Due to the tense situation in the Middle East 😰, a large amount of capital has flowed into gold and crude oil markets. BTCUSD is likely to continue its downward movement on Monday ⬇️. Let's focus on the support level at 100,000. If it breaks below 100,000, it may continue to decline ⚠️.
⚡️⚡️⚡️ BTCUSD ⚡️⚡️⚡️
🚀 Sell@ 106500 - 105500
🚀 TP 102000 - 101000
Accurate signals are updated every day 📈 If you encounter any problems during trading, these signals can serve as your reliable guide 🧭 Feel free to refer to them! I sincerely hope they'll be of great help to you 🌟 👇

USDT.D Consolidation Near Breakout Zone – Eyes on the Next MoveHello traders, here is the USDT.D update:
The chart is currently hovering near a major resistance zone, one that historically plays a key role in triggering altseason.
After a period of consolidation inside the mid-range S/R zone, price is now testing the downtrend line from above. A clear rejection here could spark renewed confidence in altcoins, giving them space to rally.
On the flip side, a breakout above this level may delay altseason momentum, as capital remains parked in stablecoins.
For now, this zone is the make-or-break area for altcoin sentiment. Keep it on your radar, the next move could set the tone for the coming weeks.

$BTC - Weekend LTF OutlookBINANCE:BTCUSDT | 4H
We've got a swing point retest here on the 4-hour timeframe.
Immediate resistance at 106k, but I'm eyeing the internal liquidity — the wicks on both sides.
Most likely it’ll fill the upper wick first (107.3k–107.8k). If we reject there again, we could sweep the lower wick around 103.5k–103k.

$ZROUSDT Descending channel 4h chart.$ZRO/USDT is trading near the bottom of a descending channel on the 4H chart.
If support holds, a bounce toward the upper channel could offer a 26.96% upside.
Watch for confirmation, but a breakdown below the channel may signal further downside.
DYRO, NFA

BTC/USDT Bullish Reversal Zone AnalysisSupport Zone:
The horizontal purple box (~104,000 USDT area) has acted as a strong support/resistance flip zone multiple times.
Falling Wedge Breakout:
The price action broke out of a falling wedge pattern earlier, confirming bullish momentum.
Flag Formation (Current):
A smaller bullish flag/pennant appears to be forming, and a breakout above could trigger a strong upward move.
Projected Move:
The black arrow indicates a potential bounce from this support zone, with the price targeting the 111,000–112,000 USDT zone (highlighted in the top purple box).
Volume Spike:
Notable volume spike near the bottom supports the idea of accumulation and possible reversal.
📈 Conclusion:
If the support zone holds and price breaks above the minor flag, a bullish continuation is likely toward the 111,000–112,000 resistance area. Traders should watch for confirmation of a breakout and volume increase for validation.

BTCUSDT Trend Analysis and Trading RecommendationsToday's overall BTC market rebounded after hitting a low of 102,614 in the early trading session, with Bitcoin's price maintaining a slow upward trend throughout the day. The intraday high reached 105,912 but encountered resistance. As the weekend approaches, historical market data shows limited volatility during weekends, so range-bound fluctuations are expected for the weekend.
From the current overall market rhythm, the price has rebounded slightly today after the previous decline. The hourly chart shows consecutive upward candles, though the price movement remains relatively slow. As time progresses, the price is expected to sustain an upward trend after pullbacks, and breaking through the short-term resistance level is only a matter of time. In terms of short-term structure and pattern, despite slight resistance and minor pullbacks, the downward momentum has weakened. We can still focus on long positions at lower levels, paying attention to the 106,000 resistance level.
BTCUSD
buy@104000-104500
tp:106000-107000
Investment itself is not the source of risk; it is only when investment behavior escapes rational control that risks lie in wait. In the trading process, always bear in mind that restraining impulsiveness is the primary criterion for success. I share trading signals daily, and all signals have been accurate without error for a full month. Regardless of your past profits or losses, with my assistance, you have the hope to achieve a breakthrough in your investment.
