ASRUSDT Forming Falling WedgeASRUSDT is gaining strong bullish traction after a successful breakout from a falling wedge pattern. This setup is widely recognized in technical analysis as a bullish reversal structure, and the breakout here is backed by consistent price action above the key resistance zone highlighted in red. ASR has now flipped this zone into support, and the trendline structure suggests a continuation move is underway.
The recent candles are forming a clear uptrend, and the momentum is being supported by healthy volume flow, indicating that accumulation might be happening behind the scenes. With the breakout fully confirmed, a potential 40% to 50% upside move is projected based on the measured target approach, aligning with price ranges between $2.5 and above. Traders should watch for continuation patterns or bull flags as the uptrend evolves.
The ASR token is part of a growing fan-token economy that has started to attract fresh attention in 2025. As investor interest increases, demand for utility-driven and fan-based tokens could fuel further upside. This positions ASR as a strong candidate for both speculative and long-term plays. If the broader altcoin market continues to move positively, ASR could outperform thanks to both technical strength and thematic interest.
With its current setup, ASRUSDT looks set to rally further and may present a compelling opportunity for traders who position early. Keep an eye on pullbacks to key support levels as potential re-entry zones if missed on the initial breakout.
✅ Show your support by hitting the like button and
✅ Leaving a comment below! (What is You opinion about this Coin)
Your feedback and engagement keep me inspired to share more insightful market analysis with you!
BTCUSDT

$BTC - Possible CME Gap FillBINANCE:BTCUSDT | 4h
Watching 106.2k-106k for a potential bounce taking those singleprints/imbalances.
However, if 108.3k rejects, CME gap below likely gets filled around 104k to 102k zone (pink squiggly)


BTC is reviving for a new bull runBTCUSD is correcting to 108000 as it hits the sell zone at 101200. At 108000 it is quite clear to set up BUY signals. Another area to watch for BUY is 106500. BUY SL points are not above 700 price for BTC. Currently the uptrend is still going to continue so any pullback to support is considered a buying opportunity.

EURUSD BULLISH OR BARISH DETAILED ANALYSISEURUSD is showing strong bullish momentum after a clean bounce from the key support zone around 1.12. Price structure confirms higher lows and strong bullish candle formations on the daily chart, suggesting the bulls are in control. This recent move is backed by a textbook retest and rejection from the previous resistance-turned-support zone, giving confidence in a potential continuation toward the 1.19 level. With the current price trading near 1.15 and pushing higher, the market is positioned for a strong bullish wave in the coming sessions.
From a fundamental perspective, the Euro has gained fresh support after the ECB’s decision last week to proceed with a measured and data-dependent rate cut cycle. While the ECB delivered its first cut, the tone was cautious and far less dovish than anticipated, which kept EUR strength intact. On the USD side, traders are pricing in a more dovish outlook for the Federal Reserve, especially with recent CPI and PPI data pointing toward cooling inflation. This divergence in policy outlook continues to favor EURUSD upside in the medium term.
Technical indicators are also confirming the bullish bias. The pair is riding an ascending trendline, and momentum indicators like RSI remain in bullish territory without yet being overbought. A daily close above the 1.1550 area strengthens the case for a continuation move. The price is aiming for the next major resistance around 1.1770–1.19, where bulls are likely to take profit or scale out. Until then, dips are likely to be bought aggressively, as long as the 1.12 support remains intact.
This setup presents a high-probability opportunity in a trending market backed by both fundamentals and technical confluence. As long as the bullish structure holds, I remain long-biased on EURUSD with eyes on the 1.19 zone as the next key level. With increasing market interest, low volatility on the downside, and strong trend-following signals, this pair is set for a continued rally.

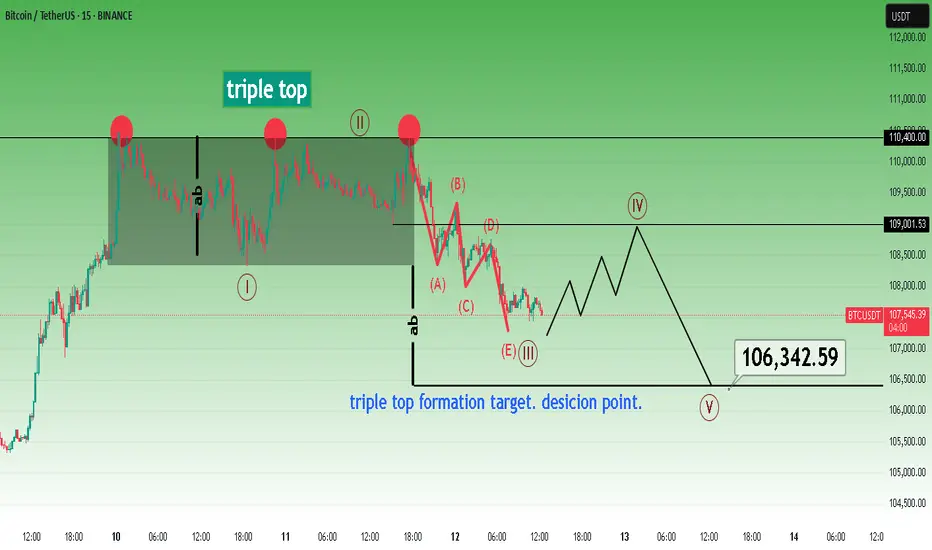
Bitcoin short term triple top pattern target.The most likely scenario in my opinion.
* The purpose of my graphic drawings is purely educational.
* What i write here is not an investment advice. Please do your own research before investing in any asset.
* Never take my personal opinions as investment advice, you may lose your money.
$BTC/USDT MAJOR PUMP? or MAJOR DUMP?BTC, the worlds biggest and fastest growing coin. With a market cap in the Trillions, we are facing a major moment.
Will price dump? or will it pump and go above and beyond.
Lets find out in this analysis!
1. Trend Overview
HTF Bullish:
Price remains above the long-term bullish trendline, showing strong macro support.
Recent price action is consolidating within a major supply zone and liquidity cluster — signaling indecision before a breakout or breakdown.
📈 2. OBV (On-Balance Volume) Analysis
OBV is coiling in a symmetrical triangle, indicating a volume squeeze.
This tightening range typically precedes a major breakout or breakdown, matching the price consolidation near resistance.
🔄 Market Structure
Price has formed a potential top just under the supply/liquidity zone (~$110,000–$112,000).
Swing High is defined just below $112K.
Key structure zones are:
Resistance zone at current levels.
Support zones:
1D FVG ($97K) and Weekly FVG ($87K–$93K)
🟪 Supply & Demand Zones
Supply Zone: $100k - $112k — multiple rejections here indicate this is a key short-term ceiling.
Demand Zone: Deep support between $50-$57K, aligns with trendline and historical value area.
🔵 Fair Value Gaps (FVGs)
1D FVG: $97K area — may act as magnet if price breaks below resistance.
1W FVG: $87K–$93K — stronger structural level to watch.
If both are filled, price may meet the bullish trendline around $90K.
🧠 Liquidity Zones
Above current price: ~$112K is marked as a liquidity grab area — stop hunts may occur before major reversal.
Below: FVG zones could trigger a liquidity sweep downwards before reversal.
🔴 Volume Profile
Strong high-volume node (HVN) around $80K–$97K: acceptance zone, likely to act as magnetic support.
Above $110K is a low-volume node (LVN): if broken cleanly, price may accelerate quickly toward $120K+.
✅ Bullish Scenario
Break above $112K → sweep liquidity → continuation toward $120K–$125K. (Price Discovery)
OBV breakout upwards would confirm.
Hold above FVG 1D if retested = healthy bullish continuation structure.
❌ Bearish Scenario
Rejection at supply → drop to FVG 1D ($97K), then potentially Weekly FVG (~$93K).
If OBV breaks downward, it confirms bearish volume divergence.
Breakdown below trendline could target deeper into demand zone (~$70K+).
📌 Summary
Bias: Neutral-bullish short term, bullish macro (above trendline).
Key Breakout Level: $112K.
Critical Support: $91K–$97K (FVG cluster).
Confirmation: OBV breakout + clean structure break.
Invalidation: Weekly close below long-term trendline and FVG zones.

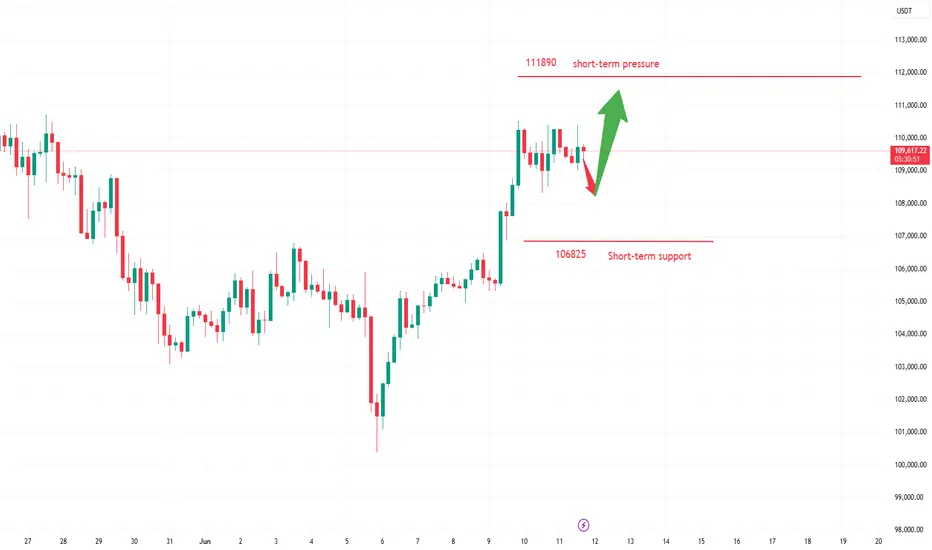
Evening BTC Trend Analysis and Trading RecommendationsDuring the morning session, the Bitcoin price continued its upward momentum from the previous night, surging to an intraday high of 110,653. Subsequently, as bullish momentum gradually waned, the price entered a volatile downward channel. Consecutive bearish candles triggered a significant retracement of earlier gains. In the afternoon, supported by the hourly moving average, Bitcoin saw a brief rebound, climbing to 109,852 as U.S. stocks opened. However, bears quickly regained control, pushing the price down to 108,282 before stabilizing, after which it entered horizontal consolidation. The current price remains around 109,000. Notably, our previous short strategy at 109,800 precisely aligned with the trend, successfully realizing the expected profit.
Current trading advice: Consider light short positions within 109,400–109,700, targeting around 108,500. If the price effectively holds support and stabilizes at 108,500, you may attempt light long positions to speculate on a rebound.
BTCUSD
sell@109400-109700
tp:108500-107500

BTC/USD Technical Outlook – Potential Bearish Continuation BelowBTC/USD Technical Outlook – Potential Bearish Continuation Below Resistance 📉🧊
Chart Overview:
The chart illustrates a clear bearish rejection from a major resistance zone (⚠️ 110,000–111,000 USD), followed by the emergence of a bearish engulfing candle 🔻 marked in orange. This move suggests selling pressure has returned after a short-term bullish rally.
Key Zones & Levels:
🔵 Resistance Zone: 110,000–111,000 USD
Price was rejected from this region with a strong bearish reaction.
🟣 Mid-level Support: 105,531 USD
Currently acting as an interim level — if broken, it may lead to deeper declines.
🔵 Support Zone: 100,500–101,500 USD
This is the next strong demand area — price previously rebounded strongly from here.
Technical Signals:
✅ Double Top Structure formation at the resistance zone, indicating trend exhaustion.
❌ Bearish Engulfing Candle near resistance, confirming reversal strength.
📉 Downward Momentum Arrow suggests possible continuation toward support.
🔻 Lower Highs Formation reinforces bearish sentiment after failed breakout attempts.
Projection 🎯:
If the price closes below 105,531, a bearish continuation is likely, targeting the support zone at 101,000–100,500.
Conversely, a strong bounce above this level could delay the drop, but upside is capped below 110,000 unless a breakout occurs.
Summary:
🧭 Bias: Bearish below 105,531
📍 Targets:
Immediate: 105,531 (key level)
Bearish Target: 101,000
Invalidated if: price reclaims and closes above 110,000 with strength
📊 Trader's Note: Look for confirmation of breakdown with volume or candle close before short entry. Set tight risk management due to volatility.

BTC to new ATH - 115K? When? OWing to the MP and TPO's
The current market profile indicates that Bitcoin has recently experienced a sharp move up, forming a double distribution structure with value areas clearly separated. Price attempted to hold above the upper distribution’s value area high but failed and is now back inside the lower distribution, suggesting rejection at higher prices. This opens up a potential short opportunity if price retests the 109650 to 110000 zone and shows weakness, with a possible target near 107300 to 107000 where the previous low-volume node and value area low are located. On the other hand, the area around 106600 to 106800 has acted as a strong support zone during the earlier rally. If the price moves down and shows signs of absorption or support near this zone, it may offer a favorable long opportunity back toward 108300 to 108500, where the previous value area high lies. The market is currently in a responsive phase, and directional bias should depend on how price reacts around these key zones.
What i see is what i learned, and i do expect a straight fall down but cant forget the small OB which can pull things up! Sideways momentum to NEW ATH

BTCUSDT – Bearish signs emerge below resistanceAfter a strong bullish run, BTCUSDT is now showing clear signs of weakness near the resistance zone around 109,600–112,000. Price action has formed a cluster of rejection candles at the top, failing to break above this key level – signaling that selling pressure is gaining control.
The current structure suggests a potential trend reversal, especially as the latest bearish candle came with rising volume, confirming selling interest from the supply zone. If the price breaks below the 101,500 support, BTC may continue dropping toward the 93,500–84,500 range – a high-liquidity area on the volume profile.
The previous bullish momentum appears to have lost strength, and this pullback may be confirming a shift after reaching its upper limit. As long as BTC remains below the 112,000 resistance, the bearish bias remains dominant.

Layout TestHello World
HTF - 1h timeframe on left
LTF - 10s timeframe on right
FVG zones and Volume Profile
Key Levels

"Accumulation Phase for Breakout"Bitcoin underwent high-level consolidation on June 11, with intraday volatility ranging from $108,800 to $110,200. It failed to effectively break through the previous high of $111,980. The 24-hour global liquidations amounted to $210 million (half of the previous day), with short positions accounting for 62%, indicating that bears still dominate short-term sentiment.
The Sino-US high-level talks in London originally scheduled for June 11 have been postponed to June 15, and the details of tariff reductions remain unclear, leading to a decline in risk asset appetite. The US Dollar Index rebounded by 0.8%, suppressing Bitcoin's breakthrough momentum. Bitcoin is currently in a accumulation phase for breaking through all-time highs, with policy regularization and institutional increasing holdings forming long-term support.
Humans need to breathe, and perfect trading is like breathing—maintaining flexibility without needing to trade every market swing. The secret to profitable trading lies in implementing simple rules: repeating simple tasks consistently and enforcing them strictly over the long term.
Trading Strategy:
buy@108000-108500
TP:110500-111000
BTCUSDT – Strategy and Trend Probabilities for 2025In my opinion, Bitcoin (BTC) has become less interesting — there isn’t much room left for significant movement, and most of the “cream” has already been skimmed off. However, since it's essentially the index of the crypto market, I’m sharing this trading idea for context - to show where we currently are and what scenarios might unfold.
The price is globally moving within an ascending channel.
A secondary triangle pattern is forming.
Within this triangle, we can see the outlines of an inverse head and shoulders pattern - or possibly a cup and handle - both aligning with the channel’s resistance.
Potential scenarios:
a) Price breaks out of the triangle.
b) Price moves toward the triangle’s support, forming another wave inside it.
c) Price moves to retest the main ascending channel’s support.
d) Price fluctuates within the central range of the channel.
There aren't many options, and none of them would break the primary trend. Altcoin movements will largely depend on BTC’s behavior.
Therefore, it’s crucial to build a trading strategy that considers both the likely and less likely (but possible) outcomes.
Looking at the broader picture:
The previous minor altseason (winter 2024) was short and weak, except for a few coins.
There was no real secondary altseason in spring 2025.
Statistically, summer tends to be quiet - due to holidays and so on.
The first two points contradicted the expectations of most traders - so we’ll see how things play out with the third. If there's no altseason in summer either, then logically, winter might turn out to be quite aggressive.

LINK Structure Shaping Up for Potential BreakoutvChainlink is now approaching a key resistance trendline after showing a strong bounce from the recent demand zone.
Price is pushing into this trendline with good momentum. If we see a clear breakout and daily close above it, this could open the door for a continuation move toward the next target area around seventeen point seven dollars.
However, this is still an important level to watch. If the trendline holds and price gets rejected, a pullback toward the demand zone near fourteen dollars is possible.
At this stage, the chart is showing a constructive setup. It’s worth keeping an eye on how price behaves here in the coming sessions.
Thanks for reading

Chart Pattern Overview - bullish 🧠 1. Chart Pattern Overview:
The chart depicts a massive symmetrical triangle or contracting wedge formation stretching from early 2021 till now (mid-2025). This is a long-term consolidation pattern, suggesting a major breakout is likely imminent.
Elliott Wave Count (ABCDE Structure):
It follows a classic ABCDE triangle correction pattern:
A: Start of the bearish correction
B: Retracement rally
C: Capitulation dip (2022/2023 bottom)
D: Current push toward resistance (~$2,800)
E (potential): Expected minor pullback before a major breakout
💹 2. Key Levels (Support/Resistance):
Level Type Comment
$2,448 MA Support 200-week MA (in green)
$2,696 MA Resistance Price near golden cross zone
$2,814 Current Price Testing top of wedge (wave D)
$4,868 Historical High 2021 ATH zone
$4,981.93 Key Resistance Breakout target zone
$6,618–7,535 Target Zone Final measured move post-breakout
📐 Technical Indicators:
RSI (Relative Strength Index):
Weekly RSI at ~57: Trending upward, nearing breakout momentum.
Massive descending RSI trendline (since 2021) has been broken, suggesting long-term momentum shift to the upside.
RSI bullish divergence visible between waves C and E.
Volume:
Noticeable volume compression, common before explosive moves.
Watching for volume breakout confirmation (preferably on a weekly close above $3,000).
🔁 Scenario Analysis:
✅ Bullish Scenario (High Probability):
ETH breaks above wave D resistance (~$2,800–3,000).
Post-E breakout toward $4,900, followed by continuation toward $6,600–$7,500.
RSI breakout + triangle resolution = massive upside momentum.
Volume breakout will likely confirm the move.
⚠️ Neutral/Bearish Scenario:
ETH fails to break above wave D (~$2,800–3,000), rolls down toward wave E, which may retest $2,200–$2,400 support.
This forms the final leg (E) of the triangle before real breakout.
📏 Measured Move (Triangle Breakout Target):
Height of triangle: ~$3,500 (from ~$4,800 to ~$1,300)
Breakout target from apex: $6,500–$7,500, aligning with red horizontal resistance lines.
🎯 Conclusion & Strategy:
⚠️ Currently in a high-risk, high-reward zone. ETH is testing the triangle resistance and may either:
Break out above $3,000 → Strong long opportunity with target $4,900 → $6,600+
Reject and retrace to $2,200–$2,400 (wave E) → Final buying opportunity before breakout
📊 Actionable Summary:
Signal Status
Triangle Pattern Forming end of Wave D
RSI Bullish momentum
Volume Compression phase
MA Cross Bullish golden cross
Breakout Confirmation Weekly close > $3,000
Entry Zone $2,600–2,800 (partial)
Safer Entry On retest post-breakout
Long-term Target $6,600 – $7,535
free join my new community

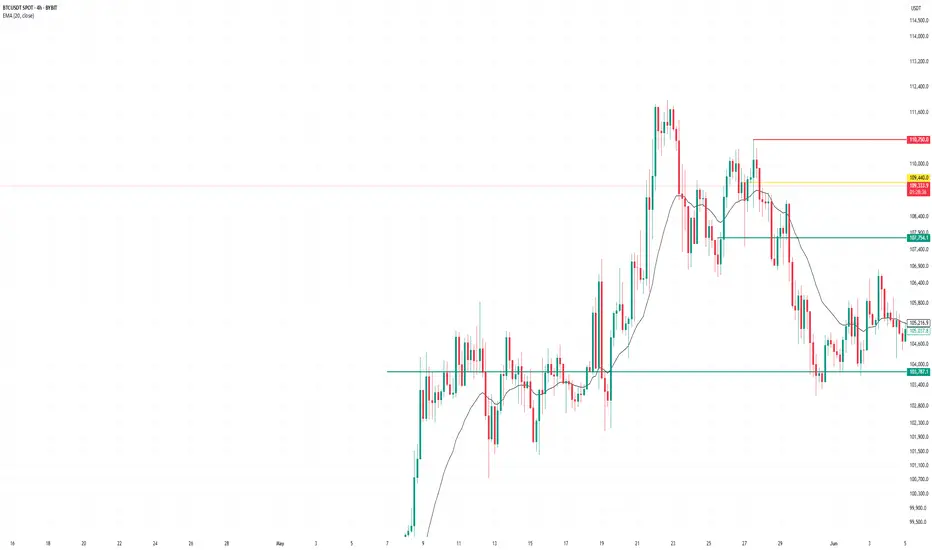
Bitcoin will rise from support level and exit from wedgeHello traders, I want share with you my opinion about Bitcoin. This chart shows how the price rebounded from the current support level and then turned around and rebounded up. Price broke the 109000 level, coinciding with a support area, and then traded near this level for some time. Later price turned around and started to decline inside a downward channel, where it soon broke the 109000 level, reached the resistance line, and continued to fall next. Bitcoin fell to the support line of the channel, which coincided with the 103000 support level and buyer zone, after which it rebounded up. Then BTC exited from channel and later entered to upward wedge, where it at once made a correction movement from the resistance line to the support line, breaking the 103000 level. But soon, price made an impulse up, breaking the support level one more time. Next, it rose to the current support level, broke it too, and now trades inside the support area. In my mind, BTC can rebound from the support level and rise to the resistance line of the wedge. Then it can break this line, thereby exiting from the wedge and continuing to move up; therefore, I set my TP at 112000 points. Please share this idea with your friends and click Boost 🚀


btc updateentry price 109416
stop loss 110500
take profit
107800
103800
result 1 target and risk free
Bitcoin to $130,000Bitcoin broke out of the important yellow trendline and back tested that ( @$100k ) now its rising again. the main target now is $130,000 trendline

GBPCHF BULLISH OR BEARISH DETAILED ANALYSISGBPCHF is currently forming a clean bullish flag pattern on the daily timeframe, signaling a potential continuation of the recent impulsive move. After a strong rally from the April lows, price has entered a controlled consolidation just below the 1.12 resistance zone. This structure is typical of a market that’s building momentum before the next leg higher. With key support around 1.10 holding firm, this area becomes a crucial demand zone, and we are now looking for a breakout from this flag formation toward the 1.15 target.
From a fundamental perspective, the British Pound is gaining traction ahead of the UK general elections, with markets pricing in more political stability and fiscal clarity. On the other side, the Swiss Franc has weakened slightly due to the Swiss National Bank's relatively dovish tone and recent interventions aimed at softening CHF strength to support exports. This divergence in policy outlook adds momentum to the bullish GBPCHF narrative. Additionally, with UK wage growth remaining sticky and inflation still above target, the Bank of England is expected to delay aggressive rate cuts, further underpinning GBP strength.
Technical conditions align perfectly with the macro backdrop. The price is respecting the bullish structure, with higher lows forming consistently. The flag resistance around 1.1150 is being tested multiple times, indicating pressure is building for a breakout. Once that resistance is breached with volume confirmation, the bullish wave could accelerate rapidly toward the previous high near 1.15. RSI and MACD also support the continuation bias, both showing signs of renewed upside momentum.
As we head into the second half of June, GBPCHF is setting up beautifully for a trend continuation move. The flag pattern provides a high-probability technical setup with a favorable risk-to-reward ratio. As long as the 1.10 support holds, bulls remain firmly in control. Watch for a confirmed breakout over the 1.1150–1.12 range, which would likely trigger a sharp rally toward the 1.15 target and possibly beyond in the coming weeks.

Will Bitcoin move toward its ATH?This analysis is an update of the analysis you see in the "Related publications" section
In the previous analysis, we mentioned that the red zone marked on the chart could potentially be broken.
From the point where we placed the green arrow on the chart, Bitcoin’s diametric pattern has completed, and it has entered a corrective phase.
It now appears that we are in wave B of a running flat, and wave B could complete around the all-time high or slightly above it.
Let’s see whether this move will play out or not.
For risk management, please don't forget stop loss and capital management
Comment if you have any questions
Thank You

BTC/USDT 1DAY CHART UPDATE !!Bitcoin displays a classic “cup and handle” structure on the daily timeframe – a historically bullish continuation pattern. The price has successfully broken above the neckline (~$107,000), indicating that bullish momentum is underway.
Thanks for your support!
DYOR. NFA
