BTCUSD VIP Analysis – Clean Breakout Toward 109K + Target🧠 Full Technical Breakdown for TradingView & Minds
🗓 Date: June 9, 2025 | Asset: Bitcoin (BTC/USD) | Chart: 2H Timeframe
Bitcoin is currently staging a strong breakout rally after consolidating within a bullish structure. This move appears to be fueled by smart money accumulation and could lead us directly into a high-probability reversal zone just below 109K.
Let’s dive into the full structure and what traders should look out for next.
🔍 1. Previous Market Behavior (Left Side of Chart):
Before the breakout, BTC had been trading inside a bearish channel, experiencing sharp rejections and forming lower highs. This downtrend climaxed at the Previous Reversal Zone, where strong buyer interest kicked in — this is a textbook example of a liquidity grab followed by buyer absorption.
📈 2. The Reversal & Blue Ray:
From the Previous Reversal Zone, BTC formed a solid impulsive move upward — this is where the Blue Ray trendline was drawn. This level acted as the initial support for the new bullish structure.
The move from this point formed a new trend, indicating that buyers had successfully reclaimed short-term control of the market.
🟩 3. Central Zone – Bullish Reaccumulation Area:
As BTC progressed, it entered a green bullish channel, which we’ve labeled the Central Zone. This zone shows consolidation within a rising wedge, typically a continuation pattern if volume remains steady.
Notice how price respected both boundaries of the channel multiple times before exploding upwards. This is a sign of smart money reaccumulation, where institutions are quietly preparing for the next leg.
🚀 4. Breakout to the Upside:
BTC has now broken out cleanly from the Central Zone with an aggressive bullish candle, pushing price above 106,000. This breakout suggests a mid-move continuation, and current price action is heading straight for the Next Reversal Zone between 108,800–109,200.
Also note the clean cross above the 50% Fibonacci zone, which further supports the bullish thesis.
🔹 5. Next Reversal Zone (Target Area):
This is the most critical zone on the chart. Price may:
Reject sharply from this area (short opportunity),
Consolidate before continuation,
Or sweep liquidity above it and reverse hard.
This zone could act as a smart money sell zone, where large players unload positions, especially if retail traders jump in late.
🧮 6. Possible Scenarios Ahead:
Scenario A – Bullish Continuation:
Price breaks 109K cleanly with volume.
Next target: 111K–112K (extension level).
Scenario B – Rejection from Reversal Zone:
Price stalls near 109K.
Bearish engulfing candle forms.
Short opportunity back toward 106K–104K.
Scenario C – Fakeout Above 109K:
Price sweeps highs (liquidity trap).
Fast reversal back into Central Zone.
🎯 Trade Setups:
🚨 Breakout Buy (Already Triggered):
Entry: 105,500–106,000
Target 1: 107,500
Target 2: 108,800
SL: 104,800
🛑 Reversal Short (Pending):
Entry: 108,900–109,100 (with confirmation)
Target: 106,000
SL: 109,600
⚠️ Fundamental Awareness:
Multiple U.S. economic events this week (see calendar icons below the chart).
Increased volatility expected — use smaller positions or wider stops near data release times.
📌 Final Thoughts:
This is a classic example of smart money behavior — liquidity grab, controlled reaccumulation, then a breakout toward a magnet zone (reversal supply). If you're already in the move, manage your positions. If not, wait for price action confirmation near the key zone.
BTCUSDT

Bitcoin Weekly Outlook – June 9, 2025Bitcoin ( BINANCE:BTCUSDT ) continues to maintain its bullish structure, now trading around $106.6K. While price action looks strong, the market is approaching a key resistance zone between $110K–$120K, with technical signals hinting at a possible short-term rejection before further upside.
🔍 Technical Overview
Current Price: $106,654
Resistance Zone: $110K – $120K
Support Zone for Pullback: $98K – $100K
200 EMA & 100 EMA: Still trending up and providing strong base support
The chart suggests a potential "rejection-retest-rally" structure forming, where BTC may temporarily pull back before making a fresh push toward new highs.
📊 Momentum & Indicators
Stochastic RSI on the daily timeframe recently bottomed and is starting to curl back up — a potential bullish shift in momentum
Volume remains stable — no signs of aggressive distribution or FOMO activity yet
💬 Sentiment & Structure
The current structure remains healthy, with HH-HL (higher high - higher low) formation intact. Market sentiment is optimistic but not yet euphoric, which is ideal for continued accumulation.
Short-term traders may look for a pullback opportunity near the $98K–$100K zone before re-entering.
🎯 Mid-Term Outlook
If BTC holds the $98K–$100K range during a pullback, it could act as a springboard toward the $120K target in the coming weeks.
✅ Summary
🔵 Bullish trend intact
📉 Possible short-term pullback before breakout
📈 Mid-term target remains: $120K
🚫 Avoid chasing breakouts — position wisely at key supports
Let the price come to you. Patience pays more than FOMO.

GBPUSD BULLISH OR BEARISH DETAILED ANALYSISGBPUSD is showing strong bullish momentum after successfully bouncing off the key support zone around 1.34300. This level, which previously acted as a major resistance, has now flipped into solid support, confirming a classic breakout-retest structure. With the daily chart printing higher highs and higher lows, the market is clearly building a bullish continuation structure. Price action above this level signals that the bulls are gaining confidence, and we are now setting up for a clean run toward the 1.38000 target in the coming sessions.
Fundamentally, the British pound is currently benefitting from improved economic sentiment in the UK. With services PMI holding firm and inflation slowly coming under control, there’s growing speculation that the Bank of England could maintain a more hawkish stance compared to the Fed. Meanwhile, the US dollar is facing pressure due to softer labor data and increased expectations for a potential rate cut later this year. This divergence between the BoE and Fed is creating a favorable environment for GBP strength against USD.
From a technical perspective, the bounce off support is being validated with strong bullish candlesticks and momentum continuation. The market structure remains intact with a bullish trendline, and Fibonacci confluence levels are lining up perfectly to support higher price objectives. The nearest resistance sits just under 1.36000, and a break above that would likely trigger accelerated buying pressure toward the 1.38000 handle. Traders watching for trend continuation setups will find this level highly attractive.
GBPUSD is preparing for another bullish wave, and this structure remains one of the cleaner technical patterns in the majors right now. As long as the pair holds above 1.34300, the bias remains bullish with potential for extended gains. Monitor DXY and Fed rate sentiment closely, but with current fundamentals aligning with technicals, this setup is shaping up to be a high-probability bullish continuation.

Bitcoin above the supportBitcoin back tested the important yellow resistance on weekly and closed a hammer candle above the pivot.
I wont be surprise to see $130k in couple of weeks.

BTC: Decision Time Ahead! A Quick Update!!Hey Traders!
If you’re finding value in this analysis, smash that 👍 and hit Follow for high-accuracy trade setups that actually deliver!
Bitcoin is once again testing the descending trendline resistance on the 4H chart.
We're currently at a make-or-break level:
A clear breakout above the trendline could trigger a bullish move toward $110K+
A rejection here might push BTC back to the $100K–$98K support zone
📍The green zone remains key — last time, it held as strong support.
But without a breakout above $106.5K, bulls are on the defensive.
Watch price action closely here — the next big move could start from this very point.
What’s your take? Bullish breakout or another dump loading?

SUSDTAnalysis is the same analysis, it just seems like the type of pattern is different... we have another low and then a high...

Bitcoin (BTCUSD) - Daily Price Consolidation Under ResistanceBitcoin (BTCUSD) price has been in a short-term downtrend since June 2025.
Price is currently consolidating under $106,000 resistance.
Watching to see if an evening star candle pattern prints on the daily chart, for a very-short-term pullback.
Support targets: $105,000, $104,000, $101,000, $100,000.
Resistance targets: $107,000, $109,000, $110,000, $112,000.
Bitcoin has been correlating with the USA stock market, tech stocks, consumer sentiment, and breaking news.

#BTC/USD Close Fight but bulls win! $117K Still in sight!CRYPTOCAP:BTC Weekly Update:
BTC closed the week up by just 0.08%, leaving behind a long wick and a tiny body, forming a Dragonfly Doji, one of the strongest candlestick patterns, signalling a fierce battle between bulls and bears.
✅ This time, the bulls won by a small margin, but a win is a win.
✅ BTC successfully held its key support.
✅ The CC is green, which is a positive sign.
The price action remains choppy, but the trend is still pushing upward from here.
Invalidation:- Weekly Close below $100k
What do you think?
Do let me know in the comments section. And please hit the like button.
Thank you
#PEACE

Bitcoin, Fast & Easy. $100,000 Support Holds +AltcoinsThe main support is not $100,000 but $102,000, so we make this a range. Yesterday, for the first time this range was tested and it holds easily... We are strongly bullish above $102,000 and Bitcoin is already trading above 103K.
This is really good news but we are not fully in the green yet. Bitcoin can continue sideways, consolidation, and only after closing above $106,000 we are looking for higher prices. Once $110,000 gets conquered, we can start talking about new all-time highs and sustained bullish growth. Meanwhile, the altcoins grow.
So we are not there yet but this is the best ever. For Cryptocurrency to thrive we need a strong Bitcoin and Bitcoin right now is very strong. Are you trading any altcoin? If you are, feel free to accumulate, load-up, buy and hold.
As for Bitcoin, here is a very easy trading approach:
While above $100,000, ALL-IN bullish confirmed.
If it goes below $100,000, stay out and wait to see what the market does. As soon as there is a support level created, we go LONG. If it goes below $100,000 just to recover the next day, we are again ALL-IN as soon as Bitcoin starts trading above 100K.
This process can be repeated many times but once Bitcoin takes off, buying below $110,000 is a major win because soon Bitcoin will be trading above $150,000. We have targets around $180,000 and even beyond $200,000 is possible this same year. Never forget the bigger picture.
The bigger picture is bullish for Bitcoin and the altcoins, the short-term can create confusion because the chart, market conditions, can change within hours.
But there can be a drop, a retrace or a market flush, but knowing that Bitcoin will be trading above $150,000 soon turns such an event into a non-event, it makes it into a simple hold.
The action on the side of the altcoins confirms that Bitcoin will continue to grow. Short, mid and long-term.
There is no retrace, there is no correction, only a small consolidation phase in anticipation of the next bullish wave. You already know this. If you didn't, now you know.
In 2025, Bitcoin will continue to grow. Just as it grew in 2023 and 2024.
We are entering bull market season. Bullish momentum will only start to gain force.
Namaste.

Uncontrolled Greed: Save Your Portfolio by these strategies Think fear is the only emotion causing big losses? Think again — this time, it’s all about greed .
🤯 That feeling when you don’t close a profitable position because you think it still has room .
📉 Let’s dive into the chart and see how even pro traders fall into the greed trap .
Hello✌
Spend 3 minutes ⏰ reading this educational material.
🎯 Analytical Insight on Bitcoin:
Bitcoin is currently testing a major monthly trendline alongside a key daily support zone, both aligning with Fibonacci retracement levels.📐 This confluence suggests a potential upside move of at least 9%, with a primary target projected near the $116,000 mark .📈 Market participants should watch this level closely as it may serve as a pivot for mid-term price action.
Now , let's dive into the educational section,
🧠 The Psychology of Greed in Trading
Greed speaks quietly but hits hard. It whispers: “Just a bit more. Let it run.”
But that’s the same voice that turns green into deep red. Markets don’t care about your dreams.
When a small win turns into a big loss — that’s greed in action.
No one knows the top. Trying to predict it out of emotion is how portfolios get wrecked.
Greed often spikes after multiple winning trades — when overconfidence kicks in.
That’s when you need data, not dopamine.
📊 TradingView Tools That Help Tame Greed
TradingView isn’t just a charting platform — if used right, it can be your emotional assistant too.
Start with RSI . When it crosses above 70, it signals overbought zones — prime time for greedy entries.
Volume Profile shows you where the smart money moves. If you see high volume at price peaks, it’s often too late to jump in.
Set up Alerts to get notified when your indicators hit key levels — avoid reacting in real-time chaos.
Use Replay Mode to rewatch old setups and identify where greed affected your past decisions.
Customize Chart Layouts per market type. Having a focused view helps you act based on logic, not emotion.
🛡 Strategies to Defeat Greed
Pre-define your take-profit and stop-loss before you enter. Non-negotiable.
Create a Psych Checklist: “Am I trading based on a missed move? Or a solid signal?”
After every trade, reflect on what drove your decisions — fear, logic, or greed?
Take a trading break after a streak of wins. That’s when greed loves to sneak in.
Withdraw a portion of your profits to reinforce the habit of securing gains.
Practice on demo during volatile days to build emotional discipline.
Never try to win back all losses in one trade — that’s greed’s playground.
If you're sizing up every position just because "the market is hot", pause.
Focus on surviving, not conquering. Long-term traders are calm, not greedy.
✅ Wrap-Up
In crypto's wild swings, greed destroys faster than any technical mistake.
Enter with a plan. Exit with purpose. Greed-based trades usually end with regret.
Emotional control equals long-term survival. Trade smart — not just hungry
📜 Please remember to do your own research before making any investment decisions. Also, don’t forget to check the disclaimer at the bottom of each post for more details.
✨ Need a little love!
We put so much love and time into bringing you useful content & your support truly keeps us going. don’t be shy—drop a comment below. We’d love to hear from you! 💛
Big thanks ,
Mad Whale 🐋

Bitcoin Trading Strategy for Monday's OpeningThe Bitcoin market as a whole showed a volatile trend this week. The price opened near $105,000 at the beginning of the week, and then fluctuated up and down under the combined influence of news and market sentiment. The highest touched $107,000, and the lowest fell to $101,000. From a daily chart perspective, the price hovered near key levels multiple times, indicating a fierce game between bulls and bears in the market. In terms of trading volume, it decreased compared to last week, suggesting that market participants have a certain wait-and-see attitude at the current price level.
Comprehensive analysis shows that the Bitcoin market will continue to maintain a pattern of multi-empty games next week. If macroeconomic data is positive, there are no major negative news on the policy front, and market sentiment remains stable, the Bitcoin price is expected to break through the short-term resistance level of $105,500 and challenge the resistance level of $107,000 or even higher.
Humans need to breathe, and perfect trading is like breathing—maintaining flexibility without needing to trade every market swing. The secret to profitable trading lies in implementing simple rules: repeating simple tasks consistently and enforcing them strictly over the long term.

QNT Accumulating Under Resistance — Big Move Ahead?QNT is showing strength, but a key test lies ahead.
After breaking out of its previous downtrend (red line), QNT has formed a strong rising structure supported by the blue trendline.
The price is currently consolidating just below the key resistance zone, attempting to gather momentum. This is a classic sign of healthy price action — retesting higher levels while maintaining support.
As long as QNT holds the strong rising support line and the lower support zone, the bullish structure remains intact. A clear breakout above the resistance zone could trigger the next leg higher.
However, if price breaks below the rising support, we could see a pullback toward the lower zone for re-accumulation.
For now — it’s a wait and watch at the resistance. Bulls need to prove their strength.
DYOR, NFA

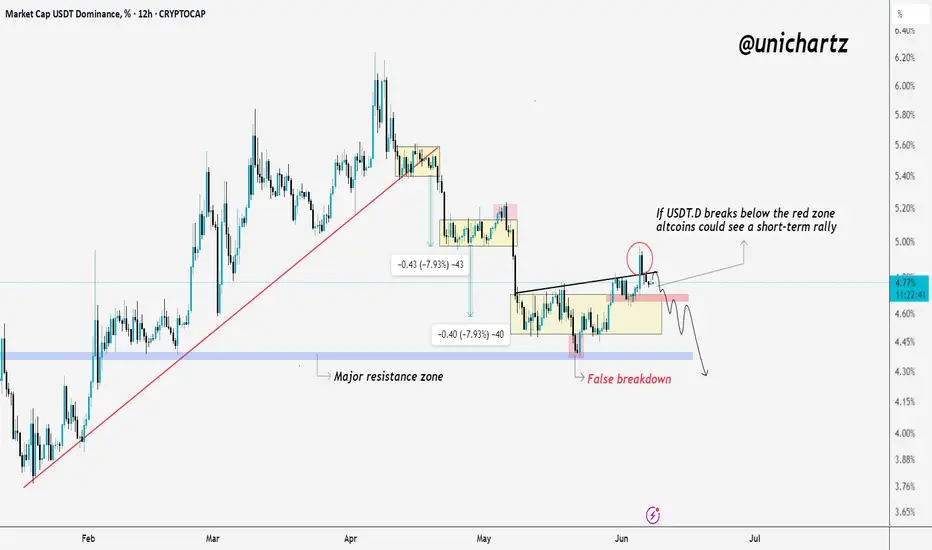
Eyes on USDT.D — Potential Altcoin Rotation SetupUSDT Dominance Update (USDT.D)
USDT.D is currently sitting just above the key red zone (support).
This level has acted as an important pivot for the last few weeks.
If we see a breakdown below this zone, it could trigger a short-term rally in altcoins — as capital rotates out of stablecoins into risk assets.
However, if USDT.D holds and bounces from this level again, it may put short-term pressure on alts.
Key Level to Watch:
The red zone — a clean break below it could open the door for a fresh altcoin run.
For now, patience is key. Let the chart confirm.
BTC at Resistance, Correction or Breakout to 109K?Yo traders! 😎 Here's a clean smart money breakdown of BTC/USDT on the 30-min chart. Be ready—this could be the calm before the pump or the trap before the dump 🧠⚡
🧠 Key Observations:
1. BTC is currently at a resistance zone, reacting near 107K, which is the Previous Daily High (PDH) 🧱 → Be cautious here—a rejection could trigger a correction.
2. If price successfully breaks above 107K, the next liquidity magnet is at 109K, right at a Strong High level. That’s where price might get drawn to 🚀
3. In case of rejection or correction, we’re watching the equilibrium zone (EQ) as a high-probability scaling-in area 🎯 → It gives a better risk-reward and aligns with the overall bullish structure.
4. Look how the discount zone aligns beautifully with a liquidity void 🤝 → Smart money loves these confluences. That’s where they often step in.
5. Previous structure shows a Lower Low (LL) followed by a strong displacement upward, indicating a potential Change of Character (ChOCH) ➡️ Bullish Bias 🔄🐂
6. We also got a clean sweep of sell-side liquidity before price pumped. This confirms accumulation by smart money below the EQ area 📉💰
⚡ Summary:
🔺 Above 107K = Breakout Potential → 109K Target
🔻 Rejection at 107K = Watch EQ zone for re-entry
⚠️ Don't rush in at resistance—wait for confirmation (BOS, retest, or signs of strength)
💬 What’s your take? Are you waiting for the breakout or prepping to buy the dip? Let’s chat below 👇
And make sure to follow for more clean, structured BTC updates like this 🔥📊

Bitcoin’s Reversal from Supports — Is the Correction Over? Bitcoin ( BINANCE:BTCUSDT ) moved as I expected in the previous idea , and it also reversed the decline I intended and started to rise from the Support zone($102,000-$107,120) , Support lines , and 50_SMA(Daily) .
Bitcoin is trading near the Resistance zone($104,380-$103,670) , Cumulative Short Liquidation Leverage($105,500-$105,265) , and Resistance lines .
In terms of Elliott Wave theory , it seems that Bitcoin has managed to complete the main wave Y . The main corrective structure was the Double Three Correction(WXY) . If the Resistance lines are broken , we can confirm the end of the main wave Y .
I expect Bitcoin to start rising after a re-correction from Cumulative Long Liquidations Leverage and reach the targets I have specified on the chart.
Cumulative Long Liquidation Leverage: $102,883-$102,181
Cumulative Long Liquidation Leverage: $101,318-$100,748
Note: If Bitcoin falls below $100,200(Worst Stop Loss(SL)), we should expect further declines.
Note: $105,500 is an important price for Bitcoin, and if Bitcoin can close the 4-hour candle above it, we can expect a break of the Heavy Resistance zone($104,380-$103,670)
Please respect each other's ideas and express them politely if you agree or disagree.
Bitcoin Analyze (BTCUSDT), 1-hour time frame.
Be sure to follow the updated ideas.
Do not forget to put a Stop loss for your positions (For every position you want to open).
Please follow your strategy and updates; this is just my Idea, and I will gladly see your ideas in this post.
Please do not forget the ✅' like '✅ button 🙏😊 & Share it with your friends; thanks, and Trade safe.

Bitcoin will continue to fall to support level in channelHello traders, I want share with you my opinion about Bitcoin. This chart shows how the price rebounded from the support line and started to grow. In a short time, it rose to the support level, which coincided with the buyer zone, and it even soon broke this level. Next, the price rose a little and then continued to move up, but later corrected the support line. After this, BTC rebounded and rose to the seller zone, breaking the 108800 resistance level. Then it rose a little more and turned around, and started to decline inside the downward channel. In the channel, price soon broke the 108800 level and continued to fall next. Later, Bitcoin broke the support line and fell almost to the support line of the channel, after which it turned around and made an upward movement. After this movement, Bitcoin dropped to the 100300 support level, after which it turned around and, in a short time, rose to almost the resistance line of the channel. Price didn't reach this line, turned around, and continued to fall in the channel. In my mind, Bitcoin can continue to move down top support level inside the downward channel. That's why my TP is 100300 level. Please share this idea with your friends and click Boost 🚀

FUNUSDT Forming Falling WedgeFUNUSDT is currently forming a classic falling wedge pattern, which is widely recognized in technical analysis as a bullish reversal signal. As the price continues to compress within the wedge while holding higher volume on green candles, it suggests growing accumulation by investors. A breakout from this pattern could signal a significant price reversal, with an anticipated gain of 140% to 150%+ based on historical wedge breakout projections. The setup is becoming increasingly favorable for swing traders and mid-term holders.
FUNToken is drawing renewed investor attention due to its integration in blockchain gaming and online entertainment sectors. As demand for decentralized platforms and provably fair gaming continues to grow, FUNToken offers a well-positioned use case. The token has a history of sharp rallies following prolonged consolidation, and the current chart formation indicates that another major move may be imminent. Moreover, sentiment across social and community platforms around FUNToken is turning positive, boosting its speculative momentum.
The technical structure of the chart aligns with increasing trading volume and consistent support holding at key levels, signaling strong underlying demand. The falling wedge is narrowing, suggesting a potential imminent breakout. Once the upper resistance of the wedge is breached with strong volume, price could accelerate rapidly toward upper Fibonacci extension levels, aligning well with the projected 140% to 150% upside potential.
Given these factors, FUNUSDT stands out as a promising opportunity in the altcoin market. Traders and investors watching for strong technical breakouts with real use-case utility will likely find FUN appealing at current levels. Keep an eye on volume spikes and confirmation closes above the wedge for potential entry points.
✅ Show your support by hitting the like button and
✅ Leaving a comment below! (What is You opinion about this Coin)
Your feedback and engagement keep me inspired to share more insightful market analysis with you!

AXLUSDT Forming Descending Wedge bullishAXLUSDT is currently showing strong bullish signals after consolidating at a significant support level, with a notable uptick in trading volume. This renewed volume interest often precedes a breakout move, and the technical structure is shaping up for a potential surge. With momentum building and price action tightening, a projected gain of 60% to 70% is realistically within reach in the short to mid-term. This aligns well with historical price behavior and upcoming support-to-resistance flips.
Axelar (AXL) continues to attract investor interest due to its foundational role in cross-chain communication and interoperability. As more blockchains develop in silos, the need for protocols like Axelar grows. Its ability to facilitate seamless transfers across multiple chains makes it a strong contender in the next wave of infrastructure-focused crypto projects. Market participants are increasingly positioning themselves in utility-driven tokens like AXL that solve real scalability and connectivity problems in DeFi and the broader crypto ecosystem.
From a technical perspective, AXLUSDT is forming a bullish continuation pattern, suggesting that the recent consolidation is simply a pause before another impulsive leg to the upside. The presence of strong support zones, combined with increased volume and investor sentiment, makes this a high-probability setup for breakout traders and swing investors alike. If bullish momentum continues, the upside targets fall well within the 60% to 70% projected gain range.
Traders should keep a close watch on breakout confirmation signals and volume spikes, which could mark the start of a sustained bullish rally. As adoption and attention around cross-chain solutions grow, AXL is likely to see further market traction and price appreciation.
✅ Show your support by hitting the like button and
✅ Leaving a comment below! (What is You opinion about this Coin)
Your feedback and engagement keep me inspired to share more insightful market analysis with you!

$BTC - LTF OutlookCRYPTOCAP:BTC | 2h
We got that push toward 105.8k retesting ltf immediate supply.
There's local demand around 104.2k–103.8k — if it holds, altcoins should run.
Otherwise, there's still a possibility we fill some imbalances below at 102k area

Volatility period has begun.
Hello, traders.
Please "Follow" to get the latest information quickly.
Have a nice day today.
-------------------------------------
We need to see if the price can hold above OBV Low.
We need to see if the price can hold above OBV High or HA-High.
It is showing a downward trend while failing to rise above OBV Low.
If this continues to decline further, we should check if the HA-Low indicator is newly created.
This volatility period is expected to start around June 6 (June 5-7) and continue until around June 13 (June 12-14).
If the auxiliary indicator OBV falls below the Low Line, there is a possibility of another large decline.
At this time, the key is whether it can receive support and rise near 99705.62.
If not, it is expected to select the trend again when it meets the M-Signal indicator on the 1W chart.
The basic trading strategy is to buy at the HA-Low indicator and sell at the HA-High indicator.
If you apply this basic principle, you buy when it rises above 102049.52 and shows support, and sell near 104938.72.
For this basic principle to be applied normally, OBV is rising and the StochRSI indicator is rising.
However, it is better if the StochRSI indicator has not entered the overbought zone if possible.
However, if it is resisted and falls at the HA-Low indicator, it is likely to show a stepwise downtrend, and if it is supported and rises at the HA-High indicator, it is likely to show a stepwise uptrend.
Therefore, when testing support near the HA-Low indicator, if the OBV shows a downward trend and the StochRSI indicator shows a downward trend (if possible, a downward trend in the overbought area), the possibility of a stepwise downtrend increases.
The end of the stepwise uptrend that occurs after meeting the HA-Low or HA-High indicator is a downtrend, and the end of the stepwise downtrend is an uptrend.
Therefore, the trading method should be a fractional trading method.
I think the important thing in spot trading is how much you increase the number of coins (tokens).
Of course, depending on the situation, it may be better to make cash profits.
Since the coin market allows trading in decimal units, it is a useful investment market for increasing the number of coins (tokens).
Therefore, we can increase the number of coins (tokens) corresponding to profits while conducting trading according to the basic trading strategy.
That is, when the price rises by the purchase amount for each purchase price, sell it and leave the number of coins (tokens) corresponding to the profit.
At this time, you should be careful to include the transaction fee in the purchase amount and sell it.
The coins that are good for increasing the number of coins (tokens) corresponding to the profit rather than cash profit are BTC or ETH.
Additionally, BNB is also possible.
I think it is better to obtain cash profit if possible for the rest of the altcoins.
However, if there is a coin (token) that you think you want to increase in the medium to long term, you can increase the number of coins (tokens) corresponding to the profit by increasing the number of coins (tokens).
-
Thank you for reading to the end.
I hope you have a successful transaction.
--------------------------------------------------
- This is an explanation of the big picture.
(3-year bull market, 1-year bear market pattern)
I will explain more details when the bear market starts.
------------------------------------------------------

$ASTRUSDT Breakout Setup$ASTRU is attempting a breakout from its downtrend on the 6H chart.
Price is pushing above the descending trendline, supported by a bullish MACD crossover.
If the breakout holds, the next target is around $0.035061, with a stop below $0.025490.
Momentum looks promising for further upside.

HelenP. I Bitcoin may grow to resistance zone from trend lineHi folks today I'm prepared for you Bitcoin analytics. This chart shows how the price declined to the trend line and then made an impulse up to the support level, which coincided with the support zone. Also, price started to trades inside a pennant, where it soon broke the support level and then traded some time near it. Later, it continued to grow and in a short time rose to the resistance level, which coincided with the resistance zone and broke this level as well. Then BTC reached the resistance line of the pennant, turned around, and dropped below the 108000 level, after which a few moments traded between this level. After this, price continued to fall and after it broke 108000 leve one more time, it dropped to the trend line, which is a support line of the pennant too. Price has traded near this line and recently BTC rebounded up. So, I expect that BTCUSDT will correct to the trend line and then rise to the resistance level. After this, I think the price may break it and enter to resistance zone. That's why I set my goal at 108800 points. If you like my analytics you may support me with your like/comment ❤️

Bitfinex closed $BTC longs — local top?This Bitfinex Bitcoin long positioning is worth monitoring.
Each marked price top aligns closely with a local peak or plateau in Bitfinex longs, followed by distribution or a pullback.
Currently, Bitfinex longs have again plateaued or declined, just as BTC is forming a potential local top.
