The Unraveling of an Empire: How Bitcoin Could Break the DollarFor decades, the U.S. dollar has reigned supreme, an undisputed king in the global financial arena. It is the world's primary reserve currency, the bedrock of international trade, and the safe-haven asset investors flock to in times of turmoil. This dominance has afforded the United States what has been called an "exorbitant privilege," allowing it to borrow cheaply and exert significant influence over the world economy. But the ground beneath this financial empire is beginning to shift. A confluence of mounting debt, shifting geopolitical sands, and the rise of a revolutionary technology is creating the conditions for a challenger to emerge. That challenger is Bitcoin.
Born from the ashes of the 2008 financial crisis, Bitcoin represents a radical departure from the centrally controlled monetary systems that have governed economies for centuries. It is a decentralized, digital currency, free from the whims of governments and central banks. While initially dismissed as a niche interest for tech enthusiasts and a tool for illicit activities, Bitcoin has steadily gained traction, evolving into a trillion-dollar asset class that is now capturing the attention of institutional investors, corporations, and even nation-states. The question is no longer whether Bitcoin is a fleeting fad, but whether it possesses the power to fundamentally disrupt, and perhaps even break, the long-standing hegemony of the U.S. dollar.
A Hedge Against a Failing System
One of the most compelling arguments for Bitcoin's ascendancy lies in its inherent properties as a store of value, particularly in an era of unprecedented monetary expansion and soaring national debt. Unlike the U.S. dollar, which can be printed at will by the Federal Reserve, Bitcoin has a finite supply capped at 21 million coins. This predictable scarcity is a powerful antidote to the inflationary pressures that erode the purchasing power of fiat currencies. As governments around the world, and particularly the United States, continue to accumulate staggering levels of debt, the temptation to devalue their currencies through inflation grows. The U.S. national debt, now standing at tens of trillions of dollars, raises serious questions about the long-term sustainability of the dollar's value. In this environment, Bitcoin's unalterable monetary policy makes it an increasingly attractive safe haven for those seeking to preserve their wealth.
The trend of "de-dollarization" is already underway, with several countries actively seeking to reduce their reliance on the U.S. dollar in international trade and reserves. Geopolitical rivals like China and Russia have been at the forefront of this movement, but even traditional allies are beginning to explore alternatives. The weaponization of the dollar through sanctions has further accelerated this trend, prompting nations to seek financial systems that are not subject to the political whims of a single country. Bitcoin, being a politically neutral and borderless currency, offers a compelling solution. It allows for direct, peer-to-peer transactions across the globe without the need for intermediaries, thereby circumventing the traditional, dollar-dominated financial system.
The Rise of a New Reserve Asset
The ultimate test of a global currency is its acceptance as a reserve asset by central banks. While this may have seemed like a far-fetched idea just a few years ago, it is now a topic of serious discussion in financial circles. A handful of nations have already taken the pioneering step of adding Bitcoin to their reserves, signaling a potential paradigm shift in how countries manage their sovereign wealth. For central banks, the appeal of Bitcoin lies in its potential for diversification. By holding an asset that is not correlated with traditional stocks and bonds, they can better hedge against various economic and geopolitical risks. As more central banks begin to explore this option, even a small allocation to Bitcoin could have a significant impact on its price and legitimacy.
The development of a robust financial ecosystem around Bitcoin is also paving the way for its broader adoption. The emergence of regulated exchanges, custody solutions, and investment products has made it easier for institutions to gain exposure to the asset class. This growing infrastructure is crucial for building the trust and liquidity necessary for Bitcoin to function on a global scale.
The Hurdles on the Path to Dominance
Despite its disruptive potential, Bitcoin faces a number of significant challenges that could hinder its ability to supplant the dollar. The most frequently cited concern is its price volatility. Wild swings in value make it a difficult medium of exchange for everyday transactions and a risky asset for conservative central banks to hold in large quantities. While volatility may decrease as the market matures, it remains a major obstacle to widespread adoption.
Scalability is another critical issue. The Bitcoin network can currently only process a limited number of transactions per second, making it unsuitable for the high volume of payments required of a global currency. While second-layer solutions are being developed to address this, they have yet to be proven at a massive scale.
Furthermore, the regulatory landscape for cryptocurrencies is still in its infancy. Governments around the world are grappling with how to approach this new technology, and the lack of clear and consistent regulations creates uncertainty for investors and businesses. The U.S. government, in particular, is unlikely to cede its monetary authority without a fight, and could impose stringent regulations that stifle Bitcoin's growth.
Finally, no currency in history has achieved global dominance without the backing of a major economic and military power. The U.S. dollar's reign is underpinned by the strength of the American economy and its military might. Bitcoin, by its very nature, is decentralized and lacks the support of any single nation-state. This could be both a strength and a weakness. While it provides neutrality, it also means that there is no central authority to backstop the currency in times of crisis.
A New Financial Order
The notion that Bitcoin could completely break the U.S. dollar and become the sole global reserve currency in the near future remains a speculative one. The dollar's incumbency advantages are formidable, and the challenges facing Bitcoin are substantial. However, to dismiss the potential for a seismic shift in the global financial order would be to ignore the powerful forces at play.
What is more likely than a complete replacement is a gradual transition to a more multipolar currency world, where Bitcoin coexists alongside the dollar, the euro, and other major currencies. In this scenario, Bitcoin could serve as a neutral reserve asset, a check on the inflationary tendencies of fiat currencies, and a parallel financial system for those who are excluded from or wish to opt out of the traditional one.
The rise of Bitcoin is a clear signal that the world is yearning for a more resilient, equitable, and decentralized financial system. Whether it ultimately breaks the dollar or simply forces it to become more disciplined, one thing is certain: the future of money will look very different from its past. The quiet revolution that began with a single whitepaper is now a global movement, and the foundations of the old financial empire are beginning to tremble.
BTCUSDT

False Breakdown? BTC Eyes Rebound From Demand Zone!Bitcoin has broken below its strong rising trendline, but this move could well turn out to be a classic seller’s trap. Despite the breakdown, BTC is currently holding above the key breakout zone, which has historically triggered strong rebounds.
The price is also sitting right inside a previous "accumulated & explode" demand zone — an area where buyers have consistently stepped in. If BTC manages to hold this zone, a sharp rebound could follow, trapping late sellers and driving price higher.
However, if the support zone fails, we could see deeper downside. For now, this is a critical pivot — watch price action closely to see if bulls defend this level or if sellers gain control.
If you liked it, do comment and follow us for regular market updates.
THANK YOU

USDT.D Breakout Fading — Relief Rally Ahead for Crypto?Yesterday’s spike in USDT.D during the volatility shook the market hard — but look closer 👀
This breakout above the range could be a seller’s trap. We saw a breakout attempt with strong wicks and rejection right after, hinting that buyers might regain control soon.
The false breakdown earlier and quick reclaim of the range further supports this bias.
If USDT.D starts falling again, it could fuel a recovery in risk assets (BTC + alts). For now — watching for confirmation, but cautioning against chasing fear here.
Stay sharp

BTC NEW UPDATE (4H)After dropping toward the 100K zone and sweeping the liquidity pool, Bitcoin has made a strong rebound to the upside, putting high-leverage short positions at risk. However, it is now approaching a supply zone that could potentially push the price back down toward the 98K area.
If the market maker intends to drive the price lower and trigger a bearish scenario, this is the zone to do it from. Let’s see what happens.
A daily candle close above the invalidation level ($107,000) would invalidate this analysis.
Let’s see how Bitcoin reacts to the red box.
For risk management, please don't forget stop loss and capital management
When we reach the first target, save some profit and then change the stop to entry
Comment if you have any questions
Thank You

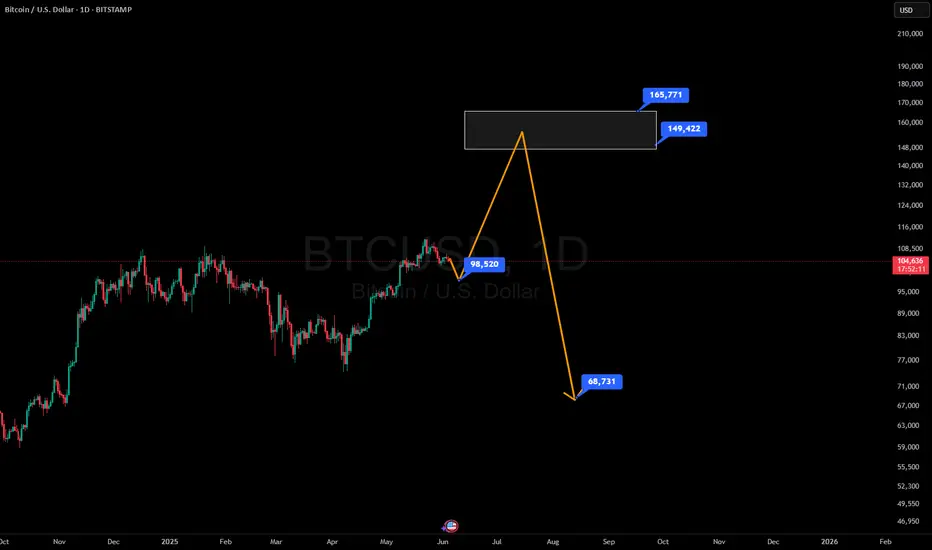
BITCOIN - Price can reach resistance area and then dropHi guys, this is my overview for BTCUSDT, feel free to check it and write your feedback in comments👊
Recently, the price bounced from the $104500 level and rose to the $110400 level, breaking this level and rising a little more.
But then price turned around and started to decline inside a falling channel, where it fell below $110400 level.
Price tried to back up, but failed and when it touched $110400 level, it in a short time declined to support line of channel.
Then price rose above $104500 level and some time traded near this level, but not long time ago it dropped.
BTC broke $104500 level and even fell further and exited from falling channel, after which it started to grow.
Now, I expect that Bitcoin can enter to resistance area and then drop to $100900 from this area.
If this post is useful to you, you can support me with like/boost and advice in comments❤️

Bitcoin's Structure Breaks — PRZ May Trigger a BounceBitcoin ( BINANCE:BTCUSDT ) has finally continued its downward trend , as I expected in my previous idea .
Do you think this downward trend will continue or not?
Bitcoin has now managed to break the Support zone($104,180-$103,670) and the lower line of the Ascending Broadening Wedge Pattern .
In terms of Elliott Wave theory , Bitcoin appears to be completing microwave C of the main wave Y of the Double Three Correction(WXY) .
I expect Bitcoin to continue to decline to the Support zone($102,000-$107,120) and the Potential Reversal Zone(PRZ) and then start to rise again.
I choose to label this idea as ''Long''.
Note: If Bitcoin falls below $100,200, we should expect further declines.
Please respect each other's ideas and express them politely if you agree or disagree.
Bitcoin Analyze (BTCUSDT), 1-hour time frame.
Be sure to follow the updated ideas.
Do not forget to put a Stop loss for your positions (For every position you want to open).
Please follow your strategy and updates; this is just my Idea, and I will gladly see your ideas in this post.
Please do not forget the ✅' like '✅ button 🙏😊 & Share it with your friends; thanks, and Trade safe.

BTCUSD at Decision Point – Rejection or Breakout Ahead? (4H)Bitcoin is currently trading around $103,500, and the price action is presenting a textbook technical scenario with multiple confluences. This chart is rich in structure — from rejection zones and trendlines to channel breakdowns and historical support retests — making it a critical area for traders to observe.
🔍 1. Previous Reversal Zone
The chart shows that Bitcoin previously faced a strong rejection near the $110,500–111,000 level. This created the first lower high, signaling the end of bullish momentum and the start of a trend shift. Every subsequent touch of that zone resulted in rejection, confirming it as a major supply zone.
📉 2. Descending Trendline – Dynamic Resistance
After multiple failed attempts to break above, price has formed a clean descending trendline that is acting as dynamic resistance. Each touch along this trendline has led to a short-term selloff, and price is now approaching this line again, near the Next Reversal Zone.
📌 This confluence increases the probability of another rejection unless there's a strong bullish breakout with volume.
📊 3. Bearish Channel & Breakdown
Before the recent fall, Bitcoin was trading inside a small bearish channel. This type of consolidation often results in continuation — which we saw with the downside breakout. This breakdown also increased bearish momentum and pushed BTC into the major support area.
🧊 4. Major Support Zone – The Battle Ground
Marked around the $101,000–102,000 range, this zone has acted as a strong demand area multiple times. The most recent bounce suggests that buyers are still active here. This could be the last defense for bulls in the short term.
🧠 If this zone breaks, we could see price falling toward the psychological level of $100,000 or even lower.
🌀 5. Ellipse Zone – Accumulation Structure
Early on the chart, an ellipse highlights a horizontal accumulation zone where price moved sideways before breaking out upward. This shows how smart money often enters during quiet phases before explosive moves. Watching for similar signs can provide strong trade setups.
🔄 6. Next Reversal Zone – Watch Closely
Price is now approaching the Next Reversal Zone near $104,500–105,000, which aligns perfectly with the descending trendline. This is a high-probability rejection zone where traders should be watching for bearish confirmations like wicks, pin bars, or bearish engulfing candles.
📌 Two Possible Scenarios
🟥 Bearish Scenario (High Probability):
Price touches the Next Reversal Zone and gets rejected.
We could see a drop back to the Major Support Zone.
If support breaks, expect a move toward $100K–99K in the coming sessions.
🟩 Bullish Scenario (Low Probability Without Volume):
Price breaks and closes above the trendline with strong bullish candles and increased volume.
In that case, BTC could rally toward the $107K–108K resistance and potentially flip the trend bullish.
💡 Trading Insight:
Fridays usually have low volume, leading to unexpected wicks and false breakouts. That’s why it’s important to:
Use small lot sizes
Wait for confirmations
Avoid overtrading before weekend closes
🧠 Final Thoughts:
This is a classic setup — consolidation after trend, rejection zones, trendline resistance, and strong support areas all in one chart. Whether you’re a price action trader or a structure-based analyst, this chart offers a powerful decision point.
Stay patient. Let the market reveal its hand. The next few candles around this trendline will likely dictate the next 1–3 day direction for BTC.

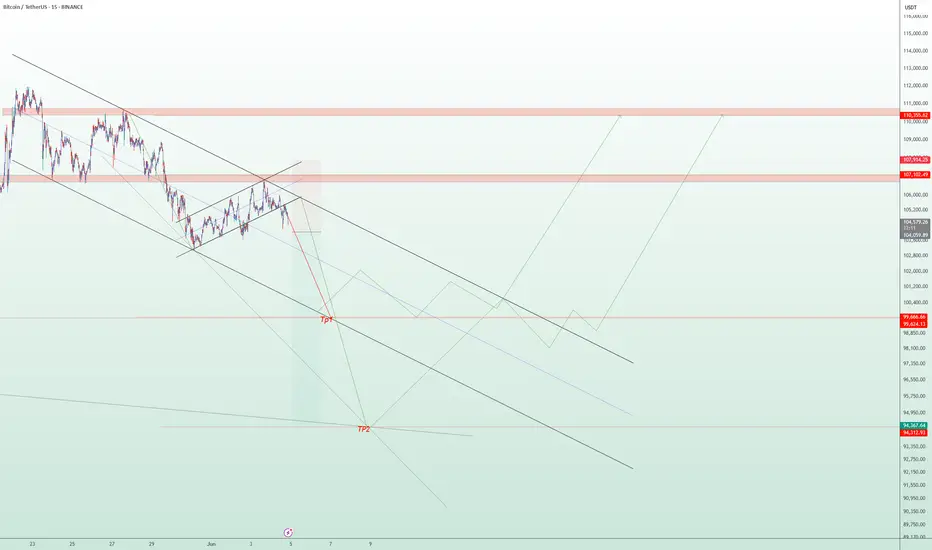
BTC/USDT Technical Analysis – 15-Min Chart | Short-Term Bearish The current price action of Bitcoin (BTC/USDT) shows a sustained bearish trend within a well-defined descending channel. Following a temporary bullish correction in the form of a rising channel, the price faced strong resistance around the $107,000–$110,500 supply zone and is now showing signs of a bearish breakout.
📉 Key Technical Observations:
A clear rejection from the upper resistance zone has led to a breakdown below the rising correction channel.
Immediate support zones are identified around $99,600 (TP1) and $94,300 (TP2), where price may potentially stabilize or bounce.
The bearish momentum remains dominant unless a strong reversal above $107,000 occurs.
📌 Scenarios to Watch:
Bearish Scenario: Price could continue falling toward TP1 and possibly TP2 if momentum holds and no strong reversal signals appear.
Bullish Reversal Scenario: A bounce from support levels with higher lows and a break above $107,000 could signal the beginning of a new bullish phase.
🔔 Disclaimer:
This analysis is intended for educational and informational purposes only. It is not financial advice. Please conduct your own research and risk assessment before making any trading decisions.
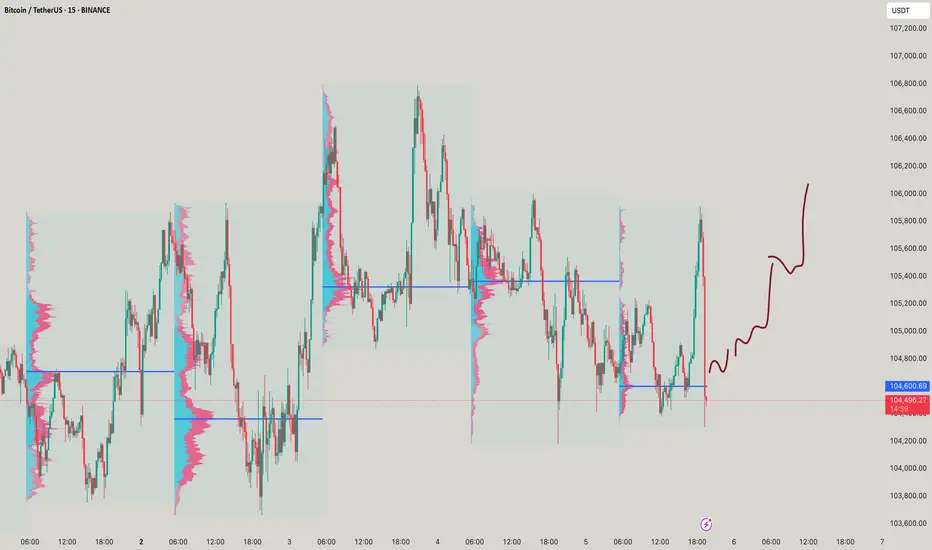
Bitcoin Analysis – Possible Scenarios🟠 Price is consolidating around 104,500, sitting right on the short-term ascending trendline. No clear breakout yet.
🔴 Supply Zones:
1️⃣ OB 1H:📍 107,800 – 108,600📌 Strong rejection zone that led to the current decline.
2️⃣ OB 4H:📍 106,100 – 107,500📌 Key resistance zone – a valid break above may trigger bullish continuation.
3️⃣ Upper OB 1H:📍 110,700 – 111,400📌 Higher resistance to watch in case of strong breakout.
🟢 Demand Zones:
1️⃣ FVG 1H:📍 103,900 – 104,300📌 Price is nearing this imbalance zone – bullish reaction expected if support holds.
2️⃣ Lower FVG 1H:📍 99,900 – 100,700📌 If current support fails, this is the next strong liquidity zone.
📊 Possible Scenarios:
1️⃣ Bounce from current trendline & FVG → move toward OB 4H (buy setup with confirmation)
2️⃣ Break below trendline → deeper pullback into 100K zone
3️⃣ Breakout above OB 4H → target next resistance at 108,600 and above
‼️ Wait for confirmation before jumping in – price action is at a decision point.
🔍 Insight by ProfitaminFX
If this outlook aligns with your bias, or if you see it differently, feel free to share your perspective in the comments. Let’s grow together 📈

EURCAD BULLISH OR BEARISH DETAILED ANALYSISEURCAD is currently consolidating within a clean symmetrical triangle formation on the 8H chart, tightening between dynamic support and resistance. Price is hovering around 1.56200 and coiling at the apex of the triangle, suggesting a breakout is imminent. With this structure developing over several weeks, this setup is primed for a high-probability directional move. The overall technical picture is showing compression, and the bullish bias becomes more likely if price breaks and closes above 1.56900.
From a fundamental perspective, the euro is gaining moderate strength as the ECB is maintaining a cautiously hawkish tone while assessing economic recovery and inflation persistence. Meanwhile, the Canadian dollar is facing downward pressure following the Bank of Canada's recent interest rate cut — a shift that surprised many traders and sparked risk-on flows away from the loonie. Crude oil prices, which often support CAD, have also turned volatile with no sustained bullish momentum, weakening CAD’s support base.
This triangle pattern reflects indecision but also the perfect setup for breakout traders waiting for volatility expansion. A confirmed bullish breakout would likely target 1.59200, with short-term resistance levels offering minor friction around 1.57800. The breakout aligns with a well-balanced risk-reward setup, with a stop area potentially below 1.56000. Price action has respected this structure consistently, adding further confluence for a clean technical move.
As EURCAD inches toward a decision point, traders should be on high alert for breakout confirmation and follow-through momentum. This is a textbook volatility squeeze pattern — when it resolves, it tends to run fast and far. With favorable macro fundamentals, this setup has the potential to deliver a solid trend continuation wave in the coming sessions.

BTCUSDTHello Traders! 👋
What are your thoughts on BITCOIN?
Bitcoin entered a corrective phase after a liquidity hunt above the recent highs and is currently in a short-term pullback.
We expect this correction to extend toward the identified support levels, after which a new bullish wave may begin, potentially leading to fresh all-time highs.
The broader trend remains bullish, and the current correction could offer a buy-the-dip opportunity in line with the ongoing uptrend.
Don’t forget to like and share your thoughts in the comments! ❤️

Bitcoin Crashes To $81,346.77? Good News & Bad NewsBitcoin is crashing... ? Not really, Bitcoin continues really strong above $100K.
We have good news and bad news.
Bad news. The very ultra-strong, long-term unbreakable support zone is being challenged. This is the $100,000 - $102,000 price range.
God news. It holds. This support zone is being challenged but so far it holds.
So far there is nothing unexpected here we know the market can shake, the market is bound to produce swings. If 100K breaks though this would be a completely different story. If it breaks, Bitcoin continues bullish producing a retrace only to end as a higher low followed by additional growth.
Will support break or hold, is there a way to know?
Bitcoin's retrace after the all-time high so far amounts to -10%. A standard retrace can easily push prices between 0.382 and 0.5 Fib. retracement. Anything lower and this would be a correction rather than a retrace.
Will it break?
It is possible but so far 100K is a very strong support. We have EMA55 here as well as several Fib. levels but if Bitcoin remains below $102,000 then it can definitely break.
The next major support below 100K sits at MA200 or $95,000. This is in-between 0.382-0.5 Fib. retracement. This can be used as the higher low zone and re-entry zone. But, Bitcoin is really strong and demand is big, so we have to wait for the weekly close.
Remember, Bitcoin will continue slightly bearish, consolidating, until the Fed decision. After the event, it is very likely to go full blown bullish. The altcoins will grow as well.
Watch the market shake just to recover the next day.
Are you a weak hand or a strong hand?
Do you have a trading plan?
If you do, nothing changes, simply short-term noise.
If you don't have a plan, right now you might be thinking that the world is close to its end. It isn't, Bitcoin will continue to grow, it takes time for the bulls to recharge before the next wave of growth.
Focus on the long-term.
Thanks a lot for your continued support.
Namaste.

TOTAL Crypto Market. Games with the 800-Pound Gorilla. Series IIOver the 4 months since Donald Trump’s inauguration in January 2025, his administration’s policies have had a complex and in many ways negative impact on cryptocurrency markets, despite the overall pro-crypto agenda.
Short-Term Market Volatility Due to Tariff Policy
One of the most significant negative impacts has been caused by Trump’s aggressive tariff policy. The announcement and subsequent implementation of new tariffs sent shock waves through global financial markets, including cryptocurrencies.
The immediate effect has been increased volatility, with Bitcoin down a third from its highs, Ethereum and many other major coins also falling by more than half, and crypto futures seeing liquidations of over $450 million in a single day.
This turbulence was not isolated — experts noted that broader “risk aversion,” in which investors flee volatile assets for safer havens like gold, led to sharp declines in both the stock and crypto markets.
Uncertainty around tariffs — particularly reciprocal tariffs affecting up to 25 countries — created short-term headwinds for cryptocurrencies. As institutional and foreign investors pulled billions out of U.S. stocks, the resulting market volatility spilled over to cryptocurrency, which remains closely tied to tech indexes like the NASDAQ. This risk aversion delayed potential rallies and led to a volatile, unpredictable trading environment.
Regulatory Rollbacks and Market Integrity Concerns
The Trump administration has aggressively rolled back regulatory oversight in an attempt to create a more crypto-friendly environment. Key steps include disbanding the Justice Department’s National Cryptocurrency Enforcement Team (NCET), appointing pro-crypto officials to regulatory bodies, and directing agencies to streamline or repeal existing crypto regulations. While these actions have reduced the compliance burden on crypto businesses and spurred innovation, they have also raised serious concerns about the integrity of the market.
Critics argue that loosening oversight increases the risks of money laundering, fraud, and illegal transactions, which could undermine investor protections and the overall reputation of U.S. crypto markets.
Consumer advocacy groups warn that rapid deregulation could encourage abuse and undermine trust, especially since the Trump administration has also banned the development of a U.S. central bank digital currency (CBDC), setting the U.S. apart from other major economies pursuing digital currency initiatives.
Conflicts of Interest and Ethical Controversies
Another negative impact has been the perception — if not the reality — of conflicts of interest and ethical dilemmas. The Trump family’s direct involvement in crypto projects, including the launch of a stablecoin and investments in mining, has fueled suspicions of market manipulation and blurred the lines between personal and presidential interests.
Such controversies have further undermined investor confidence and contributed to a sense of unpredictability in regulatory and market outcomes.
Summary Table: Key Negative Impacts
Policy/Action =>> Negative impact on crypto markets
Rising Tariffs and Trade Uncertainty =>> Increased volatility, risk aversion, falling prices.
Regulatory Rollbacks/NCET Dissolution =>> Weakened oversight, higher risk of fraud and abuse.
CBDC Development Ban =>> US Lagging Global Digital Currency Innovation
Trump Family’s Direct Involvement in Crypto =>> Alleged Conflicts of Interest, Market Manipulation Concerns.
Technical Challenge
The technical picture in the main crypto market cap chart CRYPTOCAP:TOTAL points to the end of the recovery period, reaching a key resistance near the $3.5 trillion mark.
Conclusion
While the Trump administration has promoted a more liberal environment for crypto innovation, the last four months have seen significant negative effects: increased market volatility due to tariff policy, increased risk due to deregulation, and growing concerns about conflicts of interest.
These factors have combined to create an atmosphere of uncertainty and skepticism, which is undermining the stability and trust in the US crypto markets in the short term.
--
Best wishes,
@PandorraResearch Team 😎

BTCUSDT - at CUT n REVERSE AREA ? Holds or not??#BTCUSDT.. market just reached near to his ultimate aea that is around 104300
keep close that area because should holds above that if there is further buying scnerios.
otherwise below that not at all.
good luck
trade wisely

BTC falling ... thanks orange swanBTC dumping through the volume gap. Oversold conditions will give you the best opportunities.
Full TA: Link in the BIO

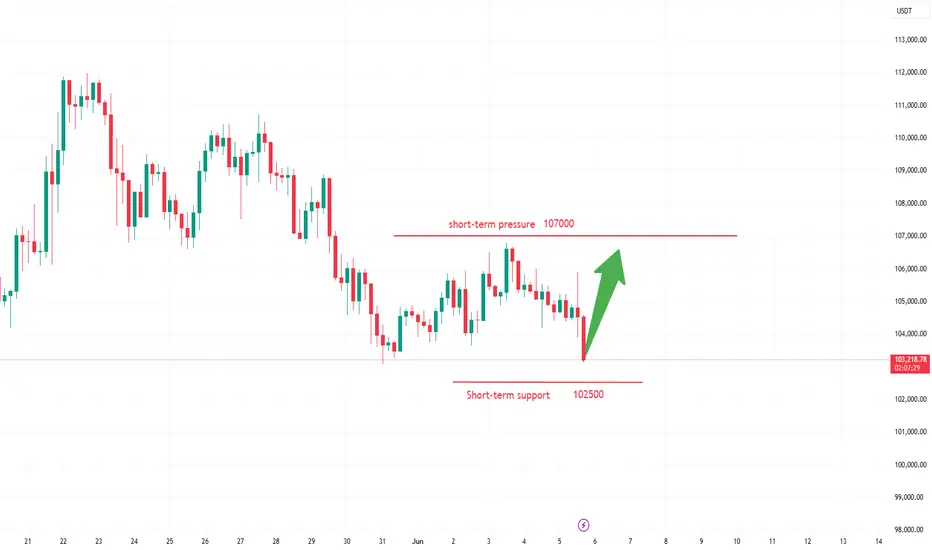
"Caught the Dip – Next Stop: Resistance Zone 1. Current Price Action:
The asset has bounced off the demand zone around 101,500 – 102,000 USDT.
It is now trading at 102,204.56 USDT, indicating early signs of the expected bullish move.
A white curved arrow suggests a rounded bottom pattern, often signaling a bullish reversal.
2. Demand Zone (Support):
Remains the same as the previous chart: 101,500 – 102,500 USDT.
Price reacted exactly at this zone and is starting to move upward.
3. Supply Zone (Target Area):
Clearly marked at 104,800 – 105,500 USDT.
This is where the expected bullish move could face resistance or where traders might look to take profit (TP).
4. Visual Reinforcement:
The large blue arrow indicates strong bullish momentum is anticipated.
The meme (Leonardo DiCaprio pointing) emphasizes that the reversal is happening as previously predicted — likely for motivational or engagement purposes in a VIP group.
---
🧠 Technical Sentiment:
Bullish Bias confirmed: Price bounced exactly from the demand zone.
Momentum Shift is underway, as indicated by the reversal pattern.
A potential "Buy Confirmation" is in play with room to ride up to the 105K resistance zone.
---
🎯 VIP Trade Setup Recap:
Parameter Value
Entry Zone 101,500 – 102,000 USDT
Current Price 102,204.56 USDT
Target (TP) 105,000 – 105,500 USDT
Stop Loss (SL) Below 101,000 USDT
Bias Bullish / Reversal
---
📌 Suggested Title:
"Reversal In Motion – Ride to 105K 🎯🚀"

#BTC/USDT: Head & Shoulders Breakdown – $95K Incoming?Hey Traders!
If you’re finding value in this analysis, smash that 👍 and hit Follow for high-accuracy trade setups that actually deliver!
Bitcoin just broke below the neckline of a clear Head & Shoulders pattern on the 4H timeframe — a classic bearish signal.
As long as price stays below the neckline and fails to reclaim the $106.5K zone, we could be heading for a deeper correction toward the $95K–$98K support range.
Key Levels:
Breakdown Zone: ~$103.9K
Downside Target: $95K–$98K
Invalidation: Reclaim above $106.5K
Market is showing consistent weakness — small bounces are quickly sold off.
Let the pattern play out and manage your risk accordingly.
What do you think — short-term dip or deeper breakdown loading?

"A volatile pattern of seesawing between bulls and bears"The recent inflows into spot Bitcoin ETFs have slowed down, but institutions such as Standard Chartered still remain bullish on the long-term trend, with price targets potentially raised above $120,000. Meanwhile, institutions like Japanese listed company Metaplanet continue to increase their holdings of Bitcoin, demonstrating institutional recognition of Bitcoin's long-term value. However, it is worth noting that large wallets and old wallets showed synchronized selling in May, indicating some profit-taking pressure in the market. From the perspective of market sentiment indicators, the current market sentiment is rather complex, with both bulls and bears seeking direction and no strong unilateral tendency.
Humans need to breathe, and perfect trading is like breathing—maintaining flexibility without needing to trade every market swing. The secret to profitable trading lies in implementing simple rules: repeating simple tasks consistently and enforcing them strictly over the long term.
BTCUSDT - UniverseMetta - Signal#BTCUSDT - UniverseMetta - Signal
H4 - Formation of a 3-wave structure + exit from the channel. It is better to reduce risks. Stop behind the maximum of the 1st wave.
Entry: 104023.59
TP: 100872.54 - 99472.07 - 97196.31 - 93409.75
Stop: 106977.70

BTC _ Ultra mega quick scalpsAs said , quick scalps at cmp sl 104,000 targets of smooth 106,100 and 106,750! Enjoy it
Bitcoin may break resistance level and continue to move upHello traders, I want share with you my opinion about Bitcoin. If we look at the chart, we can see how the price entered an upward channel and declined to the support line. Then it started to grow and soon reached the 93500 support level, after which it broke this level and then some time traded near. After this, the price rebounded and continued to move up inside an upward channel, where it later reached a resistance level, which coincided with the seller zone. When BTC reached this level, it broke it too and even rose to the resistance line of the channel, but soon it turned around and dropped to the seller zone. In this area, the price long time traded and later tried to grow, but failed and continued to decline. Soon, BTC broke the 106500 level and fell below the resistance level. But recently, price turned around and grew to this level again, and now trades very close. In my opinion, Bitcoin can decline a little and then break the resistance level one more time. After this movement, I expect that the price will continue to move up inside the upward channel, so I set my TP at 112000 points. Please share this idea with your friends and click Boost 🚀

BTC/USD: The Big Player’s Pullback Strategy – Steal Profits!🚨 BITCOIN HEIST ALERT! 🚨 The Ultimate Bullish Raid on BTC/USD (Master Plan Inside)
🌟 Hola! Bonjour! Hallo! Marhaba! Money Makers & Market Robbers! 🤑💸🔥
Based on the 🔥Thief Trading Style🔥 (technical + fundamental analysis), we’re plotting the GREAT BTC/USD HEIST! Time to LONG & escape near the Red Zone—where bears lurk & traps snap shut! Overbought? Risky? Perfect for a slick exit. 🎯 Take profits & treat yourself—you’ve earned it! 💰🏆
🔑 Heist Blueprint:
🎯 Entry: "The raid begins!"
Buy MA Pullback near Big Players’ Zone (102,000)
OR Buy above pullback—bullish momentum = green light! 📈
🛑 Stop Loss:
Thief’s SL = Nearest swing low (or under wick) → 4H candle rules!
Adjust based on risk, lot size & multiple orders.
🏴☠️ Target: 115,000 (Cha-ching! 💵)
⚡ Scalpers’ Quick Strike:
LONG ONLY!
Rich? Strike hard. Not? Join swing robbers!
Trailing SL = Your money’s bodyguard. 🔒
💥 Why BTC/USD?
Bullish fuel pumping! Fundamentals + Macro + COT + On-Chain Data = 📈🚀
👉 Full analysis? Check our bio links! 🔗
⚠️ WARNING: News = Market Chaos!
Avoid new trades during news.
Trailing SL = Profit protector!
💖 Support the Heist!
💥 BOOST THIS IDEA! 💥 Help us steal more profits & grow stronger!
🚀 Daily market heists = Easy money. Stay tuned—next raid coming soon! 🤑🐱👤