Bitcoin: $333,333 New ATH? The Bears Are Gone!Let's start with a question: How can Bitcoin be bearish while trading above $100,000? Please answer. How is that even possible?
How can Bitcoin be bearish when the price is $105,000+ at any point in time. How? It makes absolutely no sense. Think about it.
What is it that defines Bitcoin as either bearish or bullish? It's price.
What is Bitcoin's current price?
If you were ready to sell Bitcoin at $105,000 does that mean that the bull market is over for Bitcoin? Or does it mean that you expect for Bitcoin to recover after a correction or retrace?
If it is going to recover, then how long would such an imagined correction last?
How far down would that correction go?
You know the problem with answering all those questions don't you?
The problem is that they are all in your head, based on imagination, because Bitcoin is not going down instead it has been going up now for almost two months. Straight up.
The fact that Bitcoin remains trading above 100K, safely, opens the doors for 200K. 200K means 100% growth left in the coming months and this is guaranteed based on the state of the altcoins market. We are all one.
Before you give up on Bitcoin remember the easiest of all cycles, the halving. Bull market year happens the year after the halving. Bitcoin's block reward is cut in half. Less Bitcoins, increasing demand = higher price.
It is going up. There is still so much room left for growth that you would be surprised to know, this is only the start.
Bitcoin might be preparing for the bull market of its life, 10 years growing straight up non-stop.
There is no bear-market. There is no correction. There is no retrace, there is no pause.
The data is already in, the bears are gone.
Namaste.
BTCUSDT

Bitcoin Turns Bullish, What To Expect—$200,000 New All-Time HighWe have good news here. Bitcoin continues trading above $100,000-$102,000, in fact, this range hasn't been tested as support so far and this is a bullish development. Not moving below 100K can lead to a new all-time high in the coming months.
What to expect short-term.
The action is bullish now and we see some rising volume. Very little volume but still rising with two green candles. We have multiple levels to consider.
1) The $106,000-$107,000 price range. This is the zone labeled "local resistance" on the chart. If Bitcoin manages to move and close above this level on a daily basis, we can say the bulls are back in. While Bitcoin trades below this level, market conditions remain bearish and you can expect lower prices. Right now it is still bearish.
2) Once this local resistance is broken the next resistance to consider sits around $110,000. As soon as Bitcoin breaks this level it is hyper-bullish and we can aim for 200K.
Let's visit the all-time high potential in late 2025.
» If Bitcoin crashes below 100K and reaches the low 90Ks or lower, then the 200K target for a new ath later this year becomes less likely.
» If Bitcoin never moves below 100K then 200K becomes a high probability target, makes sense?
Right now conditions are still bearish because Bitcoin trades below "local resistance." The small green candles are not enough and it is still too early to say. Market conditions remain the same.
A good scenario would be consolidation, sideways, before additional growth. This would produce the best possible conditions for the altcoins market to thrive and grow.
Namaste.

Bitcoin (BTCUSDT) - Price Testing 26EMA and 12EMA - Daily ChartBitcoin (BTCUSDT) price is currently testing the 26EMA and 12EMA price levels on the Daily chart.
Bitcoin price has been in a medium-term uptrend since April and May 2025.
However, a short-term downtrend pullback has occurred and the price recently bounced up from the 26EMA zone ($104,000).
A morning star candle price pattern printed above the 26 EMA support line.
Large buyer volume could confirm the price candle pattern and Bitcoin price could rally up above 12EMA resistance ($106,000).
If price continues to reject and fall below $106,000 the downtrend would likely continue into June 2025.
Breaking news and stock market correlations could affect the price of Bitcoin and cryptocurrencies.
Tariff news and trade deals are supposed to occur throughout June and July 2025.

Explanation of indicators indicating high points
Hello, traders.
If you "Follow", you can always get new information quickly.
Have a nice day today.
-------------------------------------
(BTCUSDT 1D chart)
If it falls below the finger point indicated by the OBV indicator, it can be interpreted that the channel consisting of the High Line ~ Low Line is likely to turn into a downward channel.
And, if it falls to the point indicated by the arrow, it is expected that the channel consisting of the High Line ~ Low Line will turn into a downward channel.
Therefore, if it is maintained above the point indicated by the finger, I think it is likely to show a movement to rise above the High Line.
In this situation, the price is located near the M-Signal indicator on the 1D chart, so its importance increases.
To say that it has turned into a short-term uptrend, the price must be maintained above the M-Signal indicator on the 1D chart.
In that sense, the 106133.74 point is an important support and resistance point.
(1W chart)
The HA-High indicator is showing signs of being created at the 99705.62 point.
The fact that the HA-High indicator has been created means that it has fallen from the high point range.
However, since the HA-High indicator receives the value of the Heikin-Ashi chart, it indicates the middle point.
In other words, the value of Heikin-Ashi's Close = (Open + High + Low + Close) / 4 is received.
Since the HA-High indicator has not been created yet, we will be able to know for sure whether it has been created next week.
In any case, it seems to be about to be created, and if it maintains the downward candle, the HA-High indicator will eventually be created anew.
Therefore, I think it is important to be able to maintain the price by rising above the right Fibonacci ratio 2 (106178.85).
Indicators that indicate high points include DOM (60), StochRSI 80, OBV High, and HA-High indicators.
Indicators that indicate these high points are likely to eventually play the role of resistance points.
Therefore,
1st high point range: 104463.99-104984.57
2nd high point range: 99705.62-100732.01
You should consider a response plan depending on whether there is support near the 1st and 2nd above.
The basic trading strategy is to buy at the HA-Low indicator and sell at the HA-High indicator.
However, if it is supported and rises in the HA-High indicator, it is likely to show a stepwise rise, and if it is resisted and falls in the HA-Low indicator, it is likely to show a stepwise decline.
Therefore, the basic trading method should utilize the split trading method.
Other indicators besides the HA-Low and HA-High indicators are auxiliary indicators.
Therefore, the trading strategy in the big picture should be created around the HA-Low and HA-High indicators, and the detailed response strategy can be carried out by referring to other indicators according to the price movement.
In that sense, if we interpret the current chart, it should be interpreted that it is likely to show a stepwise rise since it has risen above the HA-High indicator.
However, you can choose whether to respond depending on whether there is support from other indicators that indicate the high point.
On the other hand, indicators that indicate the low point include the DOM (-60), StochRSI 20, OBV Low, and HA-Low indicators.
These indicators pointing to lows are likely to eventually serve as support points.
I will explain this again when the point pointing to the lows has fallen.
-
Thank you for reading to the end.
I hope you have a successful trade.
--------------------------------------------------
- Here is an explanation of the big picture.
(3-year bull market, 1-year bear market pattern)
I will explain the details again when the bear market starts.
------------------------------------------------------

earish trand analysis Read The ChaptianSMC trading point update
Technical analysis of (BTC/USDT) based on the 4-hour timeframe. Here’s a detailed breakdown of the analysis and the idea behind it:
---
Key Components of the Analysis:
1. Resistance Zone (FVG - Fair Value Gap):
The yellow zone marked as “fvg resistance level” indicates an area where price previously dropped quickly, suggesting inefficiency or imbalance in the market.
Price is approaching this zone again, which acts as a strong resistance.
2. Trendline & Lower Highs:
A descending trendline (with red arrows) shows consistent lower highs, indicating ongoing bearish pressure.
Each rejection from the trendline reinforces sellers’ dominance.
3. CHOCH (Change of Character):
The label “choch” signifies a market structure break, where bullish structure turned bearish.
This marks the transition to a downtrend.
4. EMA 200 (Exponential Moving Average):
The EMA (currently around 102,753) acts as dynamic support.
Price is currently trading above it, but a rejection from the resistance may push it below.
5. Target Zone:
A yellow box near 100,817.99 is labeled “target point”, indicating a possible short-term bearish target if price gets rejected at resistance.
6. RSI (Relative Strength Index):
RSI is around 47.11, slightly below neutral (50), suggesting bearish momentum could be building.
No clear oversold or overbought conditions yet.
---
Trade Idea Summary:
Bias: Bearish
Scenario:
If price reaches the resistance zone (~106,800–107,500) and fails to break above, a sell-off is expected.
First target: 100,800–101,000 zone
Price may also dip below EMA 200 confirming bearish strength.
Confirmation:
Rejection candle or bearish engulfing pattern near resistance.
RSI staying below 50 and starting to dip.
Invalidation:
Clean breakout and close above the resistance zone and trendline (~108,000+).
Mr SMC Trading point
---
Conclusion:
This chart sets up a high-probability short trade around the resistance area, leveraging both structural and momentum indicators. It suggests waiting for confirmation of rejection before entering, targeting the previous support and imbalance zone below.
Pales support boost 🚀 analysis follow)


XRP Repeating 2024 Setup? Monitor the RangeCRYPTOCAP:XRP is once again in a familiar phase — accumulation. After its previous range-bound phase led to a powerful breakout, we’re now seeing a similar structure forming on the weekly chart.
The price is consolidating within a clear range, showing signs of strength but awaiting a breakout to confirm the next move. History suggests this kind of accumulation can often lead to explosive upside — but patience is key here.
📌 Key takeaway: Until a clean breakout occurs, it’s best to observe, not chase. Keep your eyes on the upper range boundary for confirmation.
Let the market come to you.
DYOR, NFA
Thanks for following along — stay tuned for more updates!

Bitcoin Bullish Bias Becomes Stronger —New All-Time High EasyWith every day that passes and Bitcoin doesn't move below 100K the bullish bias becomes stronger. It is a death sentence for the bears. Bitcoin can't never move lower as long as the $100-$102,000 mega support barrier continues intact. And it hasn't been tested yet.
Good afternoon my fellow Cryptocurrency genius, how are you feeling today?
The market gives, the market also takes.
When looking at Bitcoin with a short-term mindset, everything is possible, it is hard to predict what will happen next but, when we focus on the actual price action, no doubt remains. Let me explain.
It doesn't matter if a candle is big or small...
It doesn't matter if Michael Saylor and the ETFs are buying or selling Bitcoin, what matters most is resistance and support.
Bitcoin's strong long-term mega-support remains intact and that is $102,000. Bitcoin is hyper-bullish above $100,000 and this is obvious. We are near the all-time high and the closer the action happens to resistance, the stronger the market. As Bitcoin moves sideways, consolidation, the altcoins will grow.
The altcoins cannot grow if Bitcoin is going to crash and yet the altcoins are starting to recover and some are looking great. I will continue to share more and the more I share the more convinced you will become that the next major move is up. We are set to experience growth long-term.
Aim higher, we are now-already in the 2025 bull market.
Never short Bitcoin within a bull market.
Namaste.

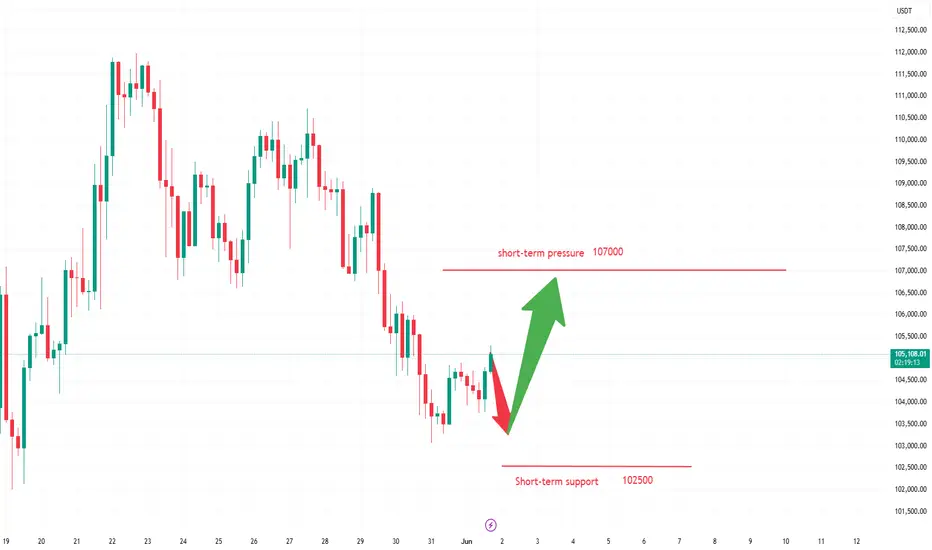
The inflow of funds provides momentum for the rise of Bitcoin.If market bullish sentiment surges and is fueled by new positive catalysts (such as increased institutional capital inflows or positive regulatory policy signals), the price of Bitcoin could break above the resistance level of $106,000. A successful breakout would open up new upside potential, with upward targets potentially reaching $107,500 or even higher.
Humans need to breathe, and perfect trading is like breathing—maintaining flexibility without needing to trade every market swing. The secret to profitable trading lies in implementing simple rules: repeating simple tasks consistently and enforcing them strictly over the long term.

FVG re-entry or fail – this level decides the tone.Bitcoin tapped the 0.618 fib at ~$104,100 and front-ran the 1H demand zone. Now it's hovering at a decision point just beneath the 1H Fair Value Gap.
What to watch:
→ Price is pressing into FVG (104.4k–104.7k), aiming for acceptance.
→ Value area high sits at 104,275 – acting as pivot.
→ Break + hold above 104.7k? Clean path to 105.8k.
Plan:
Entry: 104.1k–104.3k
SL: below 103.6k
TP1: 104.9k
TP2: 105.8k (liquidity sweep)
Invalidation: Rejection from 104.7k = probable retest of 103k
Narrative flip potential:
Buyers are defending the mid-range + FVG. Breakout would shift market structure bullish on the lower timeframes.
"Acceptance above the gap = momentum reclaim."

Short time, target 102.110Following daily chart.
I got a short signal from my power indicator.
TP1 102.110
TP2 99.923
SL close above 105.900 daily candle close.
Thoughts?

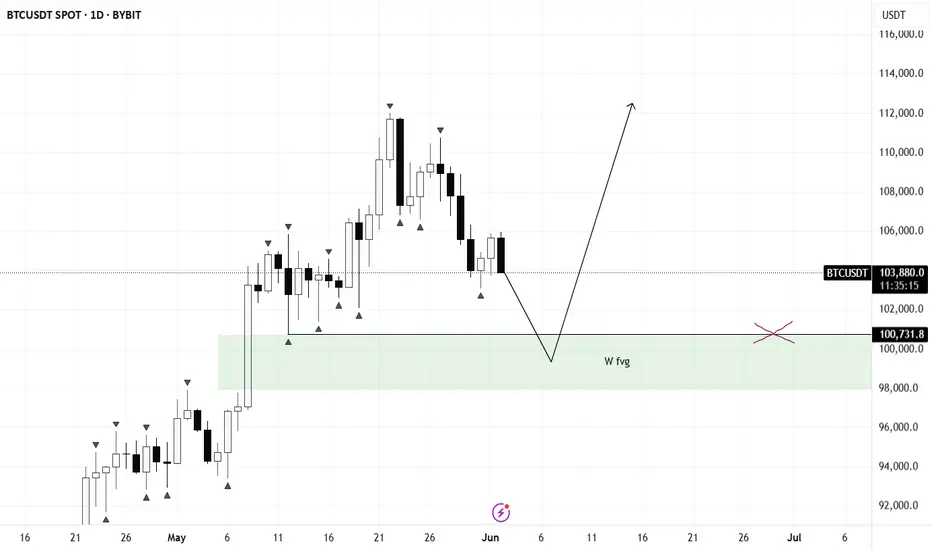
BTC/USDT🔔 New Month Kicks Off — Caution with Futures
I wouldn’t rush into aggressive futures trading right now.
Key long zones to watch:
• Liquidity sweep near 100,700
• Entry into the weekly FVG zone
That’s where I’ll be monitoring closely for potential position building.
🧠 The logic is simple:
For a solid entry point, the market needs to define the monthly and weekly lows.
This reduces the risk of getting chopped in volatility and offers a cleaner market structure.
☀️ Seasonal Context:
Summer is here — market dynamics shift.
Don’t expect explosive volatility; a prolonged sideways phase is on the table.
📉 If BTC sweeps the lows from current levels — we can consider a continuation of the long setup.
Otherwise, it’s best to wait for confirmation before entering.
Bitcoin needs to hold the major support at 104,5 k on 2 WeekBitcoin needs to close above the previous 2 week candles to confirm the next major upside move. A close below would most likely lead to a drop in next week. 9th of June we will know for sure what the future has for us.
BITSTAMP:BTCUSD
COINBASE:BTCUSD
NASDAQ:MSTR
CME:BTC1!
CRYPTOCAP:OTHERS
COINBASE:ETHUSD
BINANCE:SOLUSD

Descending right angle broadening pattern.Descending right angle broadening pattern and ABC correction waves after 5.wave.
* The purpose of my graphic drawings is purely educational.
* What i write here is not an investment advice. Please do your own research before investing in any asset.
* Never take my personal opinions as investment advice, you may lose your money.

Market Overview
WHAT HAPPENED?
Despite the prevailing bullish trend, bitcoin failed to gain a foothold at the lower end of the sideways range. Instead, there was a breakdown downwards, which led to a shift of the accumulated volume in the short direction.
After that, the support zone of $104,200 – $102,300 (accumulated volumes) was tested, which was followed by the first positive reaction from buyers.
WHAT WILL HAPPEN: OR NOT?
It’s too early to talk about a full-fledged reversal and a resumption of the bullish trend. The resumption looks weak, both in terms of volume and momentum.
In the near future, we should expect a repeat test of the formed minimum. In the absence of a buyer's reaction, a rollback to the next area of interest is possible. An alternative scenario is the formation of a new sidewall between key levels:
– $104,200 – $102,300 (current accumulation zone),
– $107,000 – $109,800 (potential upper limit).
Sell zone:
$107,000–$109,800 (accumulated volume)
Buy zones:
$104,200–$102,300 (accumulated volume)
~$100,000 (initiating volume)
$98,000–$97,200 (local support)
Level at $93,000
$91,500–$90,000 (strong buying imbalance)
IMPORTANT DATES
The following macroeconomic events are expected this week:
• Monday, June 2, 13:45 (UTC) — the publication of the index of business activity in the US manufacturing sector for May;
• Monday, June 2, 14:00 (UTC) — publication of the ISM index of business activity in the US manufacturing sector for May;
• Monday, June 2, 17:00 (UTC) — speech by Fed Chairman Jerome Powell;
• Tuesday, June 3, 09:00 (UTC) — publication of the consumer price index for May and in comparison with May 2024 in the Eurozone;
• Tuesday, June 3, 14:00 (UTC) — publication of the number of open vacancies in the labor market (JOLTS) USA for April;
• Wednesday, June 4, 12:15 (UTC) — publication of changes in the number of people employed in the US non—agricultural sector for May from ADP;
• Wednesday, June 4, 13:45 (UTC) - publication of the index of business activity in the service sector (PMI) USA for May, as well as Canada's interest rate decisions;
• Wednesday, June 4, 14:00 (UTC) — publication of the US non—manufacturing purchasing managers' index for May from ISM;
• Thursday, June 5, 12:15 (UTC) - publication of the deposit rate, as well as interest rate decisions in the Eurozone;
• Thursday, June 5, 12:30 (UTC) — publication of the number of initial applications for unemployment benefits in the United States;
• Thursday, June 5, 12:45 (UTC) — press conference of the European Central Bank;
• Friday, June 6, 12:30 (UTC) — publication of the average hourly wage, changes in the number of people employed in the non-agricultural sector and the unemployment rate in the United States in May.
*This post is not a financial recommendation. Make decisions based on your own experience.
#analytics

Bitcoin on JUNE's Pivot, $103kI believe $103,300 ( June's Pivot ) will hold bitcoin, and in few days we see a rally to the upside, and by the end of June, Bitcoin will reach to $121,700 which is the 2nd resistance for the pivot.

Bitcoin Weekly Outlook – June 2, 2025
Bitcoin ( BINANCE:BTCUSDT ) is holding strong above the psychological $100K mark, maintaining its bullish market structure on the weekly timeframe. However, technical indicators are flashing early signs of a possible short-term correction before another leg up.
🔍 Technical Analysis:
Current price: $105.1K
Key support zone: $89K (strong demand area + weekly structure retest)
Resistance to watch: $120K (major weekly supply zone + psychological level)
Stochastic RSI is currently overbought at 94+, which historically tends to trigger a healthy retracement before further upside continuation.
📊 Market Structure:
BTC remains well above the 200-week EMA, keeping bullish momentum intact
Higher Highs and Higher Lows are still in play
Volume is steady, showing no major distribution at the moment
📈 Sentiment Check:
Fear & Greed Index: 64 (Greed)
→ Suggests bullish sentiment is high
→ Greed often precedes short-term pullbacks or consolidation
🧭 Outlook:
A short-term correction toward the $89K–$92K zone is likely, as part of a healthy market cycle.
If support holds, BTC could rally back up with a mid-term target around $120K.
✅ Summary:
🔵 Bullish structure still intact
⚠️ Overbought signal = possible retracement
🎯 Mid-term target: $120K
🧘♂️ Don’t chase — wait for price to breathe, not break
Let the market come to you. Trade smart, not just hopeful.

BTC - Road to 107k through small scalps!!As I mentioned earlier the time i posted the chart, BTC did exactly the move I anticipated, however 104,545 is the point of your buy with short scalps till 105,992, if moves up trail, can throttle to 107,914

Correlation between USDT.D and BTC.D
Hello, traders.
If you "Follow", you can always get new information quickly.
Have a nice day today.
-------------------------------------
(USDT.D 1M chart)
If USDT dominance is maintained below 4.97 or continues to decline, the coin market is likely to be on the rise.
The maximum decline is expected to be around 2.84-3.42.
-
(BTC.D 1M chart)
However, in order for the altcoin bull market to begin, BTC dominance is expected to fall below 55.01 and remain there or show a downward trend.
Therefore, we need to see if it falls below the 55.01-62.47 range.
The maximum rise range is expected to be around 73.63-77.07.
-
In summary of the above, since funds are currently concentrated in BTC, it is likely that BTC will show an upward trend, and altcoins are likely to show a sideways or downward trend as they fail to follow the rise of BTC.
The major bear market in the coin market is expected to begin in 2026.
For the basis, please refer to the explanation of the big picture below.
-
Thank you for reading to the end.
I hope you have a successful transaction.
--------------------------------------------------
- This is an explanation of the big picture.
(3-year bull market, 1-year bear market pattern)
I will explain more details when the bear market starts.
------------------------------------------------------

BTC/USDT – Bitcoin 1 hour timeframe 📊 Technical Overview
🟢 Support Zone:
📌 Around $105,700
🛡 Marked by multiple bounces (white arrows), this zone shows strong buyer interest.
🔁 Historically acts as a springboard for upside moves 📈.
🔴 Resistance Zone:
📌 Range: $109,000 – $111,500
🚫 Every approach has triggered a sharp sell-off (black arrows), confirming this zone as significant supply.
🔄 Price Action & Pattern Insights
📉 Bearish Swings from Resistance:
Several high-wick candles followed by strong rejections ⛔
Downward arrows suggest a distribution phase near the top range
📈 Bullish Reversal Signals:
Price sharply rebounds from support 💥
V-shaped recovery setup in motion with a clean reaction from the demand zone ✅
Arrow projection hints at a potential full range recovery 🌈
📦 Box Range Formation:
Market has been consolidating in horizontal zones
Each zone acts as a base for accumulation or distribution 🧭
🎯 Trade Idea & Forecast
📍 Current Price: $105,793.35
📈 Projected Move: Upside rally toward $111,000+
🧠 Rationale:
Bounce from a major support zone
Prior similar price actions led to parabolic rises 🚀
No lower lows made – signs of a bottom forming 🪙
📌 Action Plan
✅ Long Setup:
Entry: Above $106,000
Target: $109,000 – $111,500
Stop Loss: Below $105,000
📉 Risk/Reward: Favorable (~1:3)
🚫 Bearish Alternative:
Breakdown below $105,000 with volume ❗
Target: $103,000 (next liquidity zone)
📎 Conclusion: Ready for a Bullish Comeback?
Bitcoin (BTC/USDT) is showing signs of a textbook bullish reversal 📘 after defending a key demand level 💪. If the current momentum holds, we could see a swift move back to the top of the range. Ideal for short-term buyers looking to ride the intraday wave 🌊.

CADJPY BULLISH OR BEARISH DETAILED ANALYSISCADJPY has successfully broken out of a well-defined falling wedge pattern, confirming a bullish reversal setup on the daily timeframe. Price action has not only cleared the descending trendline but has also completed a clean retest of the breakout zone near 104.000–104.500. This retest held firmly, showing strong buyer interest, and the pair is now poised for a continuation toward the next key resistance level around 110.000. The technical structure is now favoring bulls, with momentum shifting upward after a prolonged corrective phase.
Fundamentally, the Canadian dollar is gaining strength supported by rising crude oil prices and stronger-than-expected economic data from Canada. The Bank of Canada’s recent tone remains relatively hawkish compared to other central banks, which adds further support to CAD. Meanwhile, the Japanese yen continues to remain under pressure due to the Bank of Japan's ultra-loose monetary policy stance. With Japan’s inflation struggling to sustain above target, the BOJ is showing no urgency to tighten, which keeps JPY weak against higher-yielding currencies like CAD.
The breakout from the falling wedge is also being supported by volume and bullish daily candles, suggesting a solid shift in market sentiment. The pair has formed a higher low and higher high, officially transitioning into a bullish structure. With the retest of the breakout structure now complete, there’s a high probability for continuation toward 108.000 initially and a full extension to 110.000 in the coming weeks.
Traders should closely monitor any dips as potential buying opportunities as long as CADJPY holds above 103.500–104.000 support. The reward-to-risk ratio remains favorable for swing traders aiming for medium-term targets. With strong technical confirmation, supportive fundamentals, and risk appetite returning to markets, CADJPY is setting up for a potentially profitable bullish wave.

Will it break the all-time high again?
Over the past week, the Bitcoin market has seen volatile trends, attracting widespread attention. In terms of price performance, Bitcoin carried forward the upward momentum from the previous week, opening at $103,500 and continuing its upward trend. On May 22nd, Bitcoin reached a high point, breaking through the $110,000 mark and hitting a record high of $112,000. Its market capitalization also surged to over $2.15 trillion, ranking among the top five global asset market capitalizations.
In terms of market capital flows, Bitcoin ETF products saw a total net outflow of up to $616 million on May 30th, with IBIT alone experiencing an outflow of $431 million, ending a consecutive 10-day net inflow trend. However, BlackRock's iShares Bitcoin ETF recorded a total net inflow of over $6.35 billion in May, with assets under management exceeding $71 billion, indicating that institutional investors maintain a long-term optimistic view of Bitcoin, and the short-term outflows are mostly profit-taking.
Humans need to breathe, and perfect trading is like breathing—maintaining flexibility without needing to trade every market swing. The secret to profitable trading lies in implementing simple rules: repeating simple tasks consistently and enforcing them strictly over the long term.
BTC (Daily) Elliot Wave 2 UnderwayBTC appears to have completed a motif wave (1) poking above all time high after printing a triangle for wave 4. Triangles are an ending pattern with a final thrust up afterwards typically breaking all time highs before reversing in wave 2, selling into retail FOMO.
Wave 2 has a $92k target at 0.5 Fibonacci retracement and high volume support node.
Wave 3 should be a powerful move up taking price way into all time high.
Safe trading
