Bitcoin is bearish | stay cautious (1H)This analysis is an update of the analysis you see in the "Related publications" section
We have been warning about a potential Bitcoin correction for some time. It appears that wave G has ended, and key levels have been lost. If the price reaches the red box, it is expected to be rejected downward.
The green zone is a relatively strong support area for Bitcoin, and we should closely watch this level.
A daily candle closing above the invalidation level would invalidate this analysis.
For risk management, please don't forget stop loss and capital management
Comment if you have any questions
Thank You
BTCUSDT

HelenP. I Bitcoin can start to grow from support zone in rangeHi folks today I'm prepared for you Bitcoin analytics. Observing this chart, we can see how the price rebounded from the support zone, which coincided with support level 2, and fell to the trend line. After this moment, BTC started to grow near this line and soon broke support 2. Then it made a correction below the trend line, but soon turned back and continued to grow. Later, Bitcoin reached support 1, which coincided with the support zone too and then some time traded in this area. Price traded between the support area and the trend line, and later finally broke support 1 and entered into a consolidation. In this pattern, BTC rose to the top part of the range and then made a correction to the trend line at once. Soon, Bitcoin broke this line and continued to fall, and at the moment it traded near support 1, which is the bottom part of the consolidation as well. So, I expect that BTCUSDT will correct to the support area and then start to grow. For this case, I set my goal at 109000 points. If you like my analytics you may support me with your like/comment ❤️

$BTC Hits Key Support Will the Bulls Defend?Bitcoin2025 is currently testing a key support zone at $104,800, where the ascending trendline and horizontal support intersect.
This level is crucial, holding here could trigger a bounce back toward the $117K–$121K zone within the rising channel.
However, a breakdown below this support may lead to a drop toward the $101K fair value gap or even lower supports around $97K and $88K.
BTC is at a decision point.
Watch this level closely for the next move.
DYRO, NFA

BTCUSDT on daily support, likely to head to 109kWe have the price revisiting the daily support DS1.
This presents a long opportunity for us.
The price is likely to find support in this zone and bounce from here.
The target of this long trade shall be the daily resistance DR1 marked on the chart. This resistance zone DR1 sits around 109k area.
In case the price reaches there, it is likely to experience some pullback there.
We will reevaluate the price action on DR1 once it reaches there and decide about the next steps.
What do you think about BTC price and this trade setup presented? Share it with me in the comments.

BTCUSDT Hello everyone. I’ve spotted a sell opportunity on BTCUSDT and have already activated the trade. I wanted to share the same setup with you as well.
🔍 Trade Details:
✔️ Timeframe: 15-Minute
✔️ Risk-to-Reward Ratio: 1:1 / 1:1.50
✔️ Trade Direction: Sell
✔️ Entry Price: 106155.39
✔️ Take Profit: 105560.48
✔️ Stop Loss: 106550.09
🔔 Disclaimer: This is not financial advice. I’m simply sharing a trade I’ve taken based on my personal trading system, strictly for educational and illustrative purposes.
📌 Interested in a systematic, data-driven trading approach?
💡 Follow the page and turn on notifications to stay updated on future trade setups and advanced market insights.

BTCUSDT 4H AnalysisBTC ~ 4H Analysis
#BTC On the 4H Time frame Bitcoin is retesting this multi support level. Let's see how far this support can hold.

BTC , 1D BTC has Break Down in 4Hr and Retest the lower Trendline in 1Hr , SO we think that it will Fall in Future , If BTC is Sustaining below its 1,05,600 then we confirm that it will be Fall Drastically
if BTC is falling then remaining coins , which are giving Breakdown of Patterns they will give Very Good Profit
Risk - 3% and Aim for 20 % .
Follow for More Swing Idea Like this

BTC, will it wreck down to 100k?I dont think so as of now! Expect this momentum at the earliest! where if it falls below the black line and closes in 1H it gets denied!

Bitcoin (BTC/USDT) – Daily Chart Analysis. Bitcoin (BTC/USDT) – Daily Chart Analysis
Bitcoin has tested the overhead resistance and is currently retracing towards the $104k–$105k support area.
Moving Average (MA 25):
The price is slightly above the moving average, indicating that the medium-term trend is still bullish but faces resistance.
Pattern Formation:
There is a clear breakout from the inverted “V” pattern, and now the price appears to be retesting the breakout zone.
Scenario:
If BTC maintains support at ~$105k and bounces off again, a potential push towards $112k—$115k can be seen.
If the support fails, a deeper pullback towards $100k or below could occur.
Thanks for your support!
DYOR. NFA

BTCUSDT Analysis: Bullish Intent Building on Higher TimeframesTaking a look at BTCUSDT. My analysis points to this current level as a significant support zone, with my overall target being higher.
While the low timeframe (LTF) action hasn't yet shown a strong influx of buyers, the picture on the higher timeframes is quite compelling. The upward movement we're seeing there is displaying solid support, indicating sustained buying interest at a larger scale.
This divergence between the LTF and HTF suggests a potential build-up of bullish momentum. We might see some consolidation or sideways movement on the lower timeframes as buyers accumulate before a more decisive push upwards.
As always, I'm keeping a close eye on the volume footprint. The sustained buying volume on the higher timeframes lends credence to this bullish outlook. I'll be waiting for the low timeframe to catch up, looking for those clear signs of buyer entry – breakouts above smaller resistances with increasing volume, and successful retests as support. CDV (Cumulative Delta Volume) on both timeframes will also be crucial in confirming this directional bias.
Remember, I focus on coins showing sudden and significant increases in volume, and while the immediate LTF might be quiet, the HTF volume profile is definitely noteworthy here.
My bias for BTCUSDT right now is upwards, given the supportive structure on the higher timeframes. However, as always, I'll be waiting for that low timeframe confirmation before considering any entries. Patience and confirmation are key, even when the higher timeframe picture looks promising. Let's see if the lower timeframes will soon echo the bullish intent we're seeing on the higher ones.
📌I keep my charts clean and simple because I believe clarity leads to better decisions.
📌My approach is built on years of experience and a solid track record. I don’t claim to know it all but I’m confident in my ability to spot high-probability setups.
📌If you would like to learn how to use the heatmap, cumulative volume delta and volume footprint techniques that I use below to determine very accurate demand regions, you can send me a private message. I help anyone who wants it completely free of charge.
🔑I have a long list of my proven technique below:
🎯 ZENUSDT.P: Patience & Profitability | %230 Reaction from the Sniper Entry
🐶 DOGEUSDT.P: Next Move
🎨 RENDERUSDT.P: Opportunity of the Month
💎 ETHUSDT.P: Where to Retrace
🟢 BNBUSDT.P: Potential Surge
📊 BTC Dominance: Reaction Zone
🌊 WAVESUSDT.P: Demand Zone Potential
🟣 UNIUSDT.P: Long-Term Trade
🔵 XRPUSDT.P: Entry Zones
🔗 LINKUSDT.P: Follow The River
📈 BTCUSDT.P: Two Key Demand Zones
🟩 POLUSDT: Bullish Momentum
🌟 PENDLEUSDT.P: Where Opportunity Meets Precision
🔥 BTCUSDT.P: Liquidation of Highly Leveraged Longs
🌊 SOLUSDT.P: SOL's Dip - Your Opportunity
🐸 1000PEPEUSDT.P: Prime Bounce Zone Unlocked
🚀 ETHUSDT.P: Set to Explode - Don't Miss This Game Changer
🤖 IQUSDT: Smart Plan
⚡️ PONDUSDT: A Trade Not Taken Is Better Than a Losing One
💼 STMXUSDT: 2 Buying Areas
🐢 TURBOUSDT: Buy Zones and Buyer Presence
🌍 ICPUSDT.P: Massive Upside Potential | Check the Trade Update For Seeing Results
🟠 IDEXUSDT: Spot Buy Area | %26 Profit if You Trade with MSB
📌 USUALUSDT: Buyers Are Active + %70 Profit in Total
🌟 FORTHUSDT: Sniper Entry +%26 Reaction
🐳 QKCUSDT: Sniper Entry +%57 Reaction
📊 BTC.D: Retest of Key Area Highly Likely
📊 XNOUSDT %80 Reaction with a Simple Blue Box!
📊 BELUSDT Amazing %120 Reaction!
📊 Simple Red Box, Extraordinary Results
📊 TIAUSDT | Still No Buyers—Maintaining a Bearish Outlook
📊 OGNUSDT | One of Today’s Highest Volume Gainers – +32.44%
📊 TRXUSDT - I Do My Thing Again
I stopped adding to the list because it's kinda tiring to add 5-10 charts in every move but you can check my profile and see that it goes on..

Bitcoin Weekly, Why $20,000 Is Not Necessary!After closing 7 consecutive weeks green, Bitcoin turned red for the first time. Is this situation bullish or bearish? Will Bitcoin test $20,000 as support before hitting $200,000? Boost & follow to continue reading below.
The fact that Bitcoin found resistance is a non-event. After a very strong rise with 50% growth, it is normal to see a retrace or correction, it is as normal as it gets. Think back to August 2024. Bitcoin crashed and started to recover. The recovery didn't produce one long single up-wave, after some bullish action there was a retrace, this retrace ended in a higher low followed by additional growth. Exactly what I told you would happen if a drop develops. Yes, prices move lower but always end in a higher low. The higher low means that the bullish structure remains intact. An intact bullish structure means that market conditions do not change. This is only negative for those that bought at the top, short-term traders and over-leveraged traders, and those without a plan.
The rest of the market is sound and safe and will continue to profit long-term. Now, how far down will Bitcoin go? Will support be found around $100,000, $90,000, $80,000 or $76,000?
Remember, even if Bitcoin hits $76,000 on a flash crash this is still a higher low compared to $74,500 and thus bullish. We are bullish long-term. So, regardless of the short-term, noise, Bitcoin will continue to grow.
Prepare for the crash.
Buy and hold.
Namaste.

Bearish Bitcoin Confirmed —$20,000 Is Not Possible, Much Higher!After a lower high, Bitcoin is now on three days red. There is nothing bullish about this chart setup.
Think of it this way: Would you trust me to buy Bitcoin when it was trading below 80K? Now, Bitcoin moves from a low point of $74,500 to a high of $112,000 in less than two months. Isn't it normal for the market to look for some relief, a retrace or correction?
Please, do not be offended by me sharing a simple chart, reading a chart. It is very normal and I always mention that the market never moves straight down, nor straight up. Bitcoin doesn't need to crash, but after a rise of 50%, I wouldn't be surprising to see the development of a higher low.
If you are going crazy right now, maybe you didn't do your homework but it is definitely not my fault. The market moves up and down, up and down... It was going up, now, down we go.
Adapt to market conditions rather than fight.
If you are fighting, then you are not prepared.
If you have to write insults in the comments section, then it means you are not doing your homework.
It is your money. Be smart.
Don't be stupid.
You can do this.
P.S. If you can easily see the market fluctuating and this type of post doesn't create a mental breakdown, then all is good. You are great and you will continue to enjoy huge profits in this 2025 bull market.
Prepare for the crash.
Namaste.

#BTCUSDT #4h (Bitget Futures) Ascending trendline breakdownCRYPTOCAP:BTC lost 50MA that may act as resistance now, retracement down to 200MA support seems next.
⚡️⚡️ #BTC/USDT ⚡️⚡️
Exchanges: Bitget Futures
Signal Type: Regular (Short)
Leverage: Isolated (19.0X)
Amount: 5.0%
Current Price:
107480.5
Entry Zone:
108234.7 - 109274.5
Take-Profit Targets:
1) 106010.9
2) 103944.6
3) 101878.3
Stop Targets:
1) 111050.5
Published By: @Zblaba
CRYPTOCAP:BTC BITGET:BTCUSDT.P #4h #Bitcoin #PoW bitcoin.org
Risk/Reward= 1:1.2 | 1:2.1 | 1:3.0
Expected Profit= +47.9% | +84.0% | +120.1%
Possible Loss= -40.1%
Estimated Gaintime= 1-2 weeks

Bitcoin to $115k or pullback to $91kGood Evening Traders,
First I would like to say, congratulations to all of you who have been in the game for the last 3 bitcoin halving cycles. Through all of the "You buy fake internet money" comments or the never ending explaining of the Tokenomics of different cryptocurrencies, I have to say KUDOS to all of us who saw the vision, stuck to your guns and intricately added to your bags over the years! We are finally here on the cusp of full regulation and a final hush of the naysayers!
Ok, now down to brass tax! On the chart I have Highlighted a few important details. Something I did not point out on the chart is the massive printing of USDT that has been happening over the past few days. It seems to me that we are on the cusp of a massive influx of capital into the alt coin markets. But, for now lets focus on Bitcoin! As stated, you can see multiple points that I have highlighted... These being mostly bearish for the big dog of market cap and the grandfather coins of crypto Bitcoin. The first few things to notice is the bearish divergence on the MACD histogram, the bearish down cross of the MACD line over the signal line on the MACD indicator. You can also note the overbought area on the RSI right above that. In addition to this we do have some gaps on CME:BTC1! Which generally get filled sooner than later on most charts.
With this in mind, it is possible that we could have some good news amongst the movers and shakers down at the Bitcoin conference this week. Yet, we could get some sell the news type events that could ease the price downward to fill in these gaps that we have below. In my experience at the beginning of each alt coin season Bitcoin generally leads the rally and can trade sideways to down during the upward movement of the majority of the altcoin market.
My personal thoughts on the chart currently is shown at the top of the chart. if we close the daily candle underneath the hyperlocal resistance shown on the red line at the top of the chart, then we will most likely start pulling back to fill the first gap that is shown on the chart below in yellow. Albeit, the MACD is a lagging indicator, we can gain a lot of insight using it and my favorite sign on the MACD is using the histogram to point out bearish and bullish divergences. This shows a lack in momentum in the current trend that is shown through the price action of the assets trend. Especially, after a straight run up like we have just experienced as of late.
In conclusion, you can make the assumption that if we close the current day under the red line above it is very possible that we begin what could turn out to be an ABC correction leading us down to fill in the gaps on BTC1! to the downside. If we hold the first support, BTC may show us a little more juice potentially reaching for just under $115k. This in my opinion would likely be a bull trap for the time being. Summers are not the best when it comes to crypto growth and it always seems like we are waiting for the Ground Hog to see its shadow to find out if we are to the moon or back to McDonalds with our friends!
I hope that this analysis has helped you gain some insight in your research. I have added supports to the chart to show you where we may turn around and start heading back into price discovery.
Stay Profitable,
Savvy

Bitcoin will fall to support line of channel and then rebound upHello traders, I want share with you my opinion about Bitcoin. Bitcoin spent a considerable period trading within a horizontal range, bounded by the buyer zone around 92000 - 93000 points and the upper boundary just below 103000 points. Throughout this phase, the price respected both limits, bouncing between support and resistance, forming a stable consolidation base. Eventually, BTC broke out of this range with a strong bullish impulse, entering a clearly defined upward channel. Since then, price action has been guided by the structure of this rising channel, consistently forming higher highs and lows. Multiple clean retests of the support line confirm the integrity of the trend, and recent movement shows BTC pulling back from mid-channel after a short-term correction. Now the price is approaching the support area between 102000 - 103000, which aligns with the channel’s lower boundary. Given the pattern’s consistency and strength in previous rebounds, I think BTC can correct to the support line and continue to grow. For this case, I set my TP at 113000 points, near the resistance of the upward channel. Please share this idea with your friends and click Boost 🚀

$EIGEN/USDT Trade SetupPrice broke above key resistance and is now retesting the zone.
- Entry: CMP
- Stop Loss: $1.5972
- Targets: $2.0211 / $2.2899
Holding the trendline demand flip strong bullish bias.
Breakout traders, keep it on your radar.
DYRO, NFA

BTCUSDT – Risk of trend break, bearish signs emergingBTCUSDT is trading right at the lower boundary of its ascending channel, around the 108,800 mark. After several bounces from this trendline, price action now appears to be stalling—indicating that buying pressure is weakening. If the price breaks below the 107,500–106,500 support zone (marked by the 34 EMA and recent swing low), the short-term uptrend could be invalidated.
A confirmed break below 106,500 could trigger a further correction toward the 89 EMA around 102,800.
On the news front: Latest data shows Bitcoin’s dominance is slightly decreasing as capital rotates back into altcoins. Additionally, market uncertainty surrounding the Fed's monetary policy outlook is making investors more cautious about riskier assets like crypto.

BTCUSD UPDATE 29 5 2025This chart is a 30-minute candlestick chart for Bitcoin/USDT (BTC/USDT) on Binance, published by Mr_Zakrii. Here's a detailed breakdown:
---
Chart Details and Analysis
1. Asset & Timeframe:
Asset: Bitcoin (BTC) / Tether (USDT)
Exchange: Binance
Timeframe: 30-minute candles
2. Current Price:
Price at snapshot: ~108,420.51 USDT
The price is shown moving upwards toward a resistance area.
3. Key Zones:
Resistance Zone (Top Yellow Box): ~108,900 – 108,950 USDT
Minor Resistance Zone (Middle Yellow Box): ~108,400 – 108,500 USDT
Support Zone (Bottom Yellow Box): ~106,900 – 107,000 USDT
4. Trading Setup (Illustrated by Blue Arrows):
A short (sell) position is being suggested:
Entry: Around 108,420.51 USDT
Stop-loss: ~108,902.64 – 108,953.21 USDT
Take-profit: ~106,930.77 USDT
The setup aims to capitalize on a reversal from the resistance zone, expecting the price to reject and drop toward the previous support.
5. Risk-Reward Visualization:
Red Box: Represents the stop-loss zone (risk)
Green Box: Represents the take-profit zone (reward)
This indicates a favorable risk-to-reward ratio, assuming price respects resistance.
6. Market Sentiment:
The price has recently surged with strong green candles and volume.
The chart suggests potential exhaustion or resistance at current levels.
7. Additional Indicators:
News/Economic Event Marker (Purple Icon): Indicates a possible upcoming event which could add volatility.
Volume: Noticeable increase in buying volume during the upward move, which may suggest momentum, but also a potential blow-off if rejected.
---
Conclusion:
The chart anticipates a short-term bearish reversal from the 108,400–108,900 resistance area down to the 106,900 support zone. The trade setup is based on price action and zone rejection. It's a technical sell setup, likely based on supply zones and momentum exhaustion.
Would you like help evaluating the risk/reward further, or how this setup aligns with broader Bitcoin market trends or news?

BTCUSD Analysis – Mirror Market Concepts (MMC) Action + Target🧭 Mirror Market Concepts (MMC) Explained
Mirror Market Concepts analyze repeating emotional and structural patterns in the market—like looking at a price “mirror” that reflects past movements into the present. Core tools include:
Mind Curve Resistance/Support
CHoCH (Change of Character)
BOS (Break of Structure)
Price Reflection Zones
These tools let us understand not just what price is doing—but why it's reacting at specific levels.
📊 Technical Breakdown of the Chart
🔹 1. Black Mind Curve Support & Resistance
The chart is framed between a rising support curve and a descending resistance curve, forming a psychological squeeze zone.
These mind curves represent subconscious institutional memory—where reactions often repeat based on historical liquidity and risk-off/on behavior.
🔹 2. Major CHoCH (Change of Character)
Price broke below a previous minor higher low, shifting sentiment from bullish to neutral/bearish.
This CHoCH happened within the mind curve boundary, signaling that we’re transitioning into a decision phase.
🔹 3. Major BOS (Break of Structure)
The BOS occurred during the recent drop, confirming sellers took temporary control.
However, price respected the lower mind curve support, which may still hold as the "mirror zone."
🔹 4. Key Compression Pattern (MMC Symmetry)
Price is forming a symmetrical wedge between the two curves, often seen in MMC just before a major explosive move.
The pattern resembles past behavior where price compressed before breaking out in either direction.
🎯 Potential Scenarios (Plotted on Chart)
📈 Bullish Path:
If BTC breaks above the descending curve + confirms above 109,000, we may see:
✅ Target 1: 111,000 (BOS retest)
✅ Target 2: 112,500–113,000 zone (previous emotional high + liquidity sweep)
📉 Bearish Path:
A breakdown below 107,000 and curve support suggests sellers regain control:
⚠️ Target 1: 105,000 (local demand zone)
⚠️ Target 2: 102,500–103,000 (full MMC retrace)
⚠️ Watchlist Considerations:
Two key economic news events (highlighted on chart) could serve as catalysts.
Wait for confirmation and volume breakout before committing to either side.
This is a textbook MMC compression pattern, and patience is key before reacting.
🧠 What Makes This an MMC Setup?
🔄 Mirror Reflection of past rallies and drops forming current wedge
🧩 Mind Curve Boundaries acting like subconscious trend guides
🔁 CHoCH + BOS sequencing for momentum shift detection
💡 Psychological memory zones holding strong reactions
📌 Summary
BTC is caught in a psychological squeeze between mind curve support and resistance.
Structure favors a coming breakout or breakdown, but confirmation is critical.
MMC tools show a high-probability setup—either toward 112K or 103K based on where the breakout happens.
📣 Community CTA (Call-to-Action):
📊 How are you trading this BTC curve compression?
💬 Share your charts, setups, or alternate views below. Let’s decode the market mirror together.

BTC/USDT 1DAY CHART UPDATE !!BTC/USDT Chart Analysis
The price has broken above a key resistance area (~$104,000–$105,000) and is now retesting it as support.
The 50-day (red) and 200-day (green) moving averages slope upward, indicating bullish momentum.
Price activity consolidates just above the key resistance-to-support area, indicating accumulation ahead of a potential breakout.
If the price sustains above $104,000, we could see continuation towards $120,000–$125,000.
A break below $104,000 could see the price retest lower support areas near $100,000 or even $97,000–$98,000.
Conclusion:
Bullish bias above $104,000.
If support fails, a bearish move is possible, but momentum is in the bulls’ favor right now.
Stay tuned for updates and key levels to watch!
Thanks for your support!
DYOR. NFA

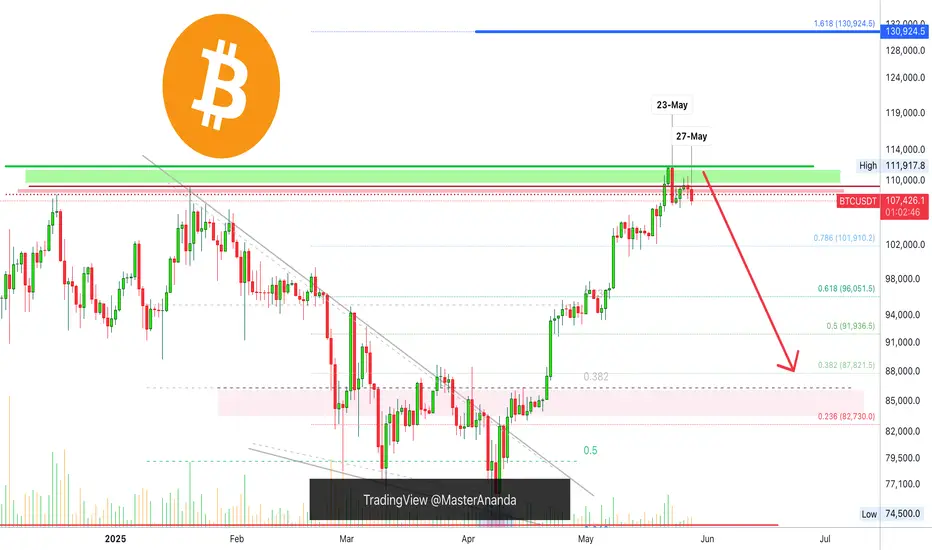
Bitcoin's Bearish Potential Explained Using Candlestick ReadingI will explain the chart as it is now based on candlestick reading and then add some additional information. The bearish bias short-term has been confirmed.
The green line marks Bitcoin's all-time high.
Dark red is the previous ath 20-Jan. 2025 and the dark red dotted line the high from 17-Dec. 2024.
Bitcoin (BTCUSDT) now trade below all three levels on a daily basis.
Right after the all-time high, 23-May, we have a full red candle.
The full red candle is a rejection as Bitcoin produced this new ath which is also a technical double-top.
After three days green, Bitcoin produces a lower high in the form of a Doji. 27-May. This Doji confirms the candle from 23-May.
Today, 28-May, Bitcoin produces a red candle as continuation of the action from 23 and 27 May.
Trading volume is super low.
Big institutions are buying and these always tend to buy at the top. The top means higher no more. A correction is upon us.
Resistance has been confirmed, how can Bitcoin turn bullish again short-term?
It needs to move and close above the all-time high on a daily basis. Anything lower and you can SHORT.
The fact that Bitcoin closed 7 consecutive weeks green, with the last few weeks become smaller, it is a sign of exhaustion, the market is looking for a relief.
A retrace can turn into a correction and if panic sets in a correction can turn into a crash.
It is still early though, but these things tend to unravel pretty fast.
Are you paying attention?
What will happen now?
A bullish trend is based on higher highs and higher lows. The bigger structure is not likely to break but, Bitcoin is going down, it doesn't matter if it is short or mid-term... Do what you have to do to protect yourself or secure profits. You can never go wrong by securing some profits when your pairs grew by 300 to 500%. If you are waiting for more, forever more, you are just a greedy ... trader.
Thanks a lot for your continued support.
Secure the win and forget the greed.
Win, win, win. And you will have the chance to play again.
Plan before buying. Develop a plan and use this trading plan to achieve trading success.
Whatever you do is up to you.
I am just reading the chart.
I left one question unanswered on purpose; How far down will it go?
Tell me in the comments, if you tell me your version I will tell you mine.
Thanks a lot for your continued support.
Buy and sell.
Sell, not hold.
Namaste.
Next Volatility Period: Around June 6
Hello, traders.
Please "Follow" to get the latest information quickly.
Have a nice day today.
-------------------------------------
(BTCUSDT 1D chart)
This is the last day of this volatility period.
To continue the uptrend, the price needs to rise above at least 109403.63 and hold.
If it fails to rise, we need to check if it is supported near 106843.58.
And we need to see if it can touch the M-Signal indicator on the 1D chart and rise.
If the price is maintained above the HA-High indicator, it is also important to see if the price can be maintained above 106843.58, as there is a possibility of a stepwise rise.
The next volatility period is expected to be around June 6.
-
(30m chart)
It seems that the basic trading strategy is being followed faithfully.
That is, it is showing a pattern of buying near the HA-Low indicator and selling near the HA-High indicator.
Therefore, we need to focus on finding a trading point when the HA-Low or HA-High indicator is touched.
However, if it is supported by the HA-High indicator and rises, it is likely to show a stepwise upward trend, and if it is resisted by the HA-Low indicator and falls, it is likely to show a stepwise downward trend.
Even so, we must not forget that the end of a stepwise upward trend is a decline, and the end of a stepwise downward trend is an increase.
At the current price position, the important points on the 1D chart are 111696.21, 109403.63, and 106843.58.
Therefore, when looking at the 30m chart, if the HA-Low and HA-High indicators are generated near the important points above, it is necessary to interpret that point as forming a more important section.
In other words, the HA-Low indicator was generated at the 107096.41 point near the current 106843.58 point, and it eventually showed an upward trend.
Therefore, if the HA-Low indicator is newly generated as the price falls, you should check if there is an important point near it.
Otherwise, if it touches the existing HA-Low indicator point of 107094.41 again, it is more likely to fall because it touches the second time, so you need to be careful when trading.
This means that the HA-Low indicator is likely to rise when it is first generated, and is likely to fall when it touches the second time.
Conversely, the HA-High indicator is likely to fall when it is first generated, and is likely to rise when it touches the second time.
Since the interpretation of the indicator is not 100% applicable, you should check the support and find the trading point.
-
Thank you for reading to the end.
I hope you have a successful trade.
--------------------------------------------------
- This is an explanation of the big picture.
(3-year bull market, 1-year bear market pattern)
I will explain more details when the bear market starts.
------------------------------------------------------

Bitcoin 6X Lev. Full PREMIUM Trade-Numbers —2nd Entry (PP: 540%)I will explain my thinking as usual so you can make an informed decision.
I believe Bitcoin will make a new advance. When there is a move that leads to the challenge of resistance or support, there is always a stop, a retrace or pullback before additional action. Bitcoin here stopped at 95,000, which is the first resistance from our previous trade-signal and did produce a retrace but it was extremely small. This is a bullish signal.
The fact that the action remains at resistance and this resistance continues to be challenged, is also a bullish signal. The more this resistance gets challenged the weaker it becomes.
Now, a 2nd entry is riskier than the first one of course because the action is more advanced but not everybody can enter perfectly at bottom prices nor at the same time.
We manage risk through capital allocation and relatively low leverage, which is actually pretty high.
See the full numbers and you will see that risk is low.
The stop goes below the low 13-Jan. 2025. The lowest after the final advance happened at $91,688 on 24-April. This is a relatively safe chart setup.
_____
LONG BTCUSDT
Leverage: 6X
1) $96,000
2) $93,000
3) $90,000
Targets:
1) $104,250
2) $120,000
3) $131,400
4) $143,300
5) $165,000
6) $181,000
Stop-loss:
Close weekly below $86,000
Potential profits: 540%
Capital allocation: 5%
_____
I think timing is good on this one. The next move can happen within days because consolidation has been happening already for an entire week without much change in price, clearly a continuation pattern. Volume being low at this point is also a signal of consolidation.
The fact that there is no volume indicates that the true bullish action is yet to start.
Bears not being present indicates that growth will happen long-term as the bearish cycle (the previous correction) is over.
I wishing you great luck and profits.
The market always offers a second chance, always.
Namaste.
