$LINK 6H Chart AnalysisBIST:LINK 6H Chart Analysis
LINK is retesting the breakout zone from the ascending triangle.
Price is holding above key support around $16.20.
A bounce here could ignite a move toward the $22.85 target.
- Entry: CMP
- TP: $22.85/ $19.23 / 21.32
- SL: $15.26
Bullish continuation likely if support holds!
DYRO, NFA
BTCUSDT

BTC Strength Alert: Key Levels, Fibonacci & VolatilityBitcoin (BTCUSD) Strength Alert: Key Levels, Fibonacci & Volatility Point to Entry Opportunities
Bitcoin (BTCUSD) Technical Analysis: Navigating Strength and Volatility
Bitcoin (BTCUSD) continues to capture the attention of the global financial markets, demonstrating notable resilience and underlying strength. The current market structure suggests a period where bulls are actively defending key price thresholds, creating a fascinating technical landscape. This analysis will provide an in-depth examination of BTCUSD, focusing on its price action relative to significant psychological levels, the supportive role of Fibonacci retracements, characteristic volatility patterns, and strategic entry considerations based on bullish candlestick formations.
1. Introduction to Bitcoin and the BTCUSD Pair
Bitcoin, introduced in 2009, stands as the progenitor of cryptocurrencies, operating on a decentralized peer-to-peer network secured by cryptographic principles and recorded on a public distributed ledger known as the blockchain. It was designed as a digital alternative to traditional fiat currencies, free from central bank control. The BTCUSD pair represents the exchange rate between Bitcoin and the United States Dollar, making it one of the most liquid and heavily traded instruments in the digital asset space. Its price movements are a barometer for the broader cryptocurrency market sentiment and are influenced by a myriad of factors including adoption trends, regulatory news, macroeconomic developments, and technological advancements within the Bitcoin network itself. Understanding the technical dynamics of BTCUSD is crucial for traders, investors, and market analysts seeking to navigate its often-turbulent price swings.
2. Current Market Sentiment and Price Action: Holding Above Key Psychological Levels
A significant observation in the current BTCUSD market is its ability to maintain its footing above a key psychological price level. Such levels, often round numbers (e.g., $50,000, $60,000, or in this context, a hypothetical significant level like $100,000 if we assume a major bull run has occurred), act as important mental benchmarks for market participants. When price successfully breaks above such a level and subsequently holds it as support, it can signal a powerful shift in market sentiment. This behavior suggests that buyers are willing to step in and defend this new valuation, absorbing selling pressure and preventing a swift retracement.
The act of holding above a major psychological level often has a self-fulfilling prophecy component. As traders and algorithms identify this level as critical, buy orders tend to cluster around it, reinforcing its strength as a support zone. Conversely, if the price were to decisively break below such a level after holding above it, it could trigger a cascade of stop-loss orders and a rapid decline, indicating that the previous bullish conviction has waned. The current strength shown by Bitcoin in maintaining its position above such a noted psychological threshold is therefore a bullish indicator, suggesting underlying demand and a positive short-to-medium-term outlook, provided this support continues to hold. This resilience can build confidence among market participants, potentially attracting further capital inflow.
3. Fibonacci Retracement Analysis: Identifying Strong Support
Fibonacci retracement levels are a cornerstone of technical analysis, employed to identify potential areas of support and resistance. Derived from the Fibonacci sequence – a series of numbers where each number is the sum of the two preceding ones (0, 1, 1, 2, 3, 5, 8, 13, etc.) – the key retracement levels are 23.6%, 38.2%, 50%, 61.8%, and 78.6%. These percentages are applied to a prior price swing (from a significant low to a significant high in an uptrend, or vice-versa in a downtrend) to project areas where the price might pull back before resuming the primary trend.
The observation that Fibonacci retracement levels suggest strong support at current BTCUSD levels is particularly pertinent. When the market is in an uptrend and experiences a corrective pullback, traders watch these Fibonacci levels closely. The 38.2%, 50%, and 61.8% levels are often considered the most significant. A retracement to, and subsequent bounce from, one of these levels indicates that the correction is likely a healthy pause within a larger bullish trend, rather than a reversal.
If BTCUSD is currently finding support near a critical Fibonacci level, it implies that the preceding upward momentum was strong, and the current consolidation or minor pullback is being met with buying interest at a mathematically significant point. For example, if Bitcoin recently rallied from point A (low) to point B (high), and has now retraced to the 61.8% level of that rally and is holding, it's a classic sign that bulls are re-entering the market, viewing the pullback as a discounted buying opportunity. The confluence of a psychological level with a Fibonacci support level would create an even more potent support zone, significantly increasing the probability of a price bounce. Traders often look for candlestick confirmation at these Fibonacci levels before committing to a position.
4. Volatility Analysis: US Evening and Asian Morning Hours
Volatility is an inherent characteristic of Bitcoin, representing the degree of variation of its trading price series over time. The observation that BTCUSD volatility tends to increase during US evening and Asian morning hours is a valuable insight for strategic trade timing. This period typically corresponds to the overlap between the closing of the New York trading session and the opening of major Asian financial centers like Tokyo, Hong Kong, and Singapore.
Several factors contribute to this heightened volatility:
Market Overlap and Liquidity Shifts: As one major market winds down and another ramps up, there can be shifts in liquidity. The initial hours of the Asian session often bring fresh news, order flows, and participants, leading to price discovery and increased trading activity.
News Dissemination: Significant economic data releases, corporate earnings (for Bitcoin-related companies), or crypto-specific news from either the US (late announcements) or Asia can occur during these hours, directly impacting BTCUSD prices.
Algorithmic Trading: Many trading algorithms are programmed to react to specific inter-market conditions or news events, and their activity can amplify price movements during these transitional periods.
Derivatives Market Activity: The global nature of Bitcoin derivatives markets (futures, options) means that activity in these markets can influence spot prices around the clock. The US evening/Asian morning window sees active participation from traders in these regions.
For traders, this period of increased volatility presents both opportunities and risks. Opportunities arise from potentially larger price swings that can be capitalized upon with well-timed entries. Risks are elevated due to the potential for rapid price changes, which can trigger stop-losses or lead to slippage. Therefore, while these hours can be opportune for entry, they also demand heightened vigilance and robust risk management.
5. Entry Strategies: Volatility, Candlestick Patterns, and Timing
Leveraging the increased volatility during US evening and Asian morning hours for entry timing requires a methodical approach, primarily focusing on the confirmation provided by bullish candlestick patterns. Candlestick charts offer a visual representation of price movements and can signal shifts in market sentiment and potential reversals or continuations.
Key Bullish Candlestick Patterns for Entry Confirmation:
Hammer: Appearing after a downtrend, a Hammer is characterized by a small real body at the upper end of the trading range, with a long lower shadow (at least twice the size of the body) and little to no upper shadow. It indicates that sellers initially pushed prices down, but buyers stepped in strongly to drive prices back up near the open, suggesting a potential bottom and bullish reversal.
Inverted Hammer: Also a bottom reversal pattern, the Inverted Hammer has a small real body at the lower end of the trading range, a long upper shadow, and a short (or absent) lower shadow. It suggests that buyers attempted to push the price up, but sellers resisted. However, the fact that buyers showed strength is a tentative bullish sign, requiring further confirmation.
Bullish Engulfing: This is a powerful two-candle reversal pattern. The first candle is bearish (red/black), and the second candle is bullish (green/white) with a real body that completely "engulfs" the real body of the preceding bearish candle. It signifies that buying pressure has overwhelmed selling pressure.
Piercing Line: Another two-candle bullish reversal pattern seen after a downtrend. The first candle is a strong bearish candle. The second candle opens below the low of the first candle but then closes more than halfway up the real body of the first bearish candle. This indicates a significant shift in sentiment from bearish to bullish during the second candle's session.
Morning Star: A three-candle bullish reversal pattern. It begins with a long bearish candle, followed by a small-bodied candle (which can be bullish or bearish and ideally gaps down from the first candle), and then a long bullish candle that closes well into the body of the first bearish candle (ideally gapping up from the second candle). The small middle candle (the "star") represents indecision, and the strong bullish third candle confirms the reversal.
Three White Soldiers: This is a strong bullish continuation or reversal pattern consisting of three consecutive long-bodied bullish candles. Each candle should open within the body of the previous candle and close at or near its high, making progressively higher highs. It signals sustained buying pressure.
Strategic Entry Timing:
Monitor Volatile Periods: Be particularly attentive to price action during the US evening and Asian morning hours.
Identify Key Support: Note the psychological levels and Fibonacci retracement zones where BTCUSD is expected to find support.
Scan for Bullish Candlesticks: Look for the formation of one of the aforementioned bullish candlestick patterns (or others like Dojis at support, Bullish Harami) at or near these support levels during the identified volatile periods.
Seek Confirmation: Wait for the candlestick pattern to fully complete at the close of its period (e.g., end of the hour for an hourly chart). Some traders wait for the next candle to trade above the high of the bullish pattern for further confirmation.
Volume Analysis: Higher trading volume accompanying the formation of a bullish candlestick pattern adds to its reliability, indicating stronger conviction behind the buying pressure.
Context is Key: Bullish reversal patterns are most potent when they appear after a discernible pullback within a larger uptrend, or at the end of a consolidation phase near strong support.
By combining the timing advantage of predictable volatility spikes with the confirmation signals from bullish candlestick patterns at technically significant support levels, traders can refine their entry strategies for BTCUSD.
6. Other Key Technical Indicators for Comprehensive Analysis
While the core observations provide a strong foundation, incorporating other technical indicators can offer a more holistic view of BTCUSD's market dynamics:
Moving Averages (MAs): MAs smooth out price data to identify trend direction and potential support/resistance. The 50-day, 100-day, and 200-day SMAs (Simple Moving Averages) or EMAs (Exponential Moving Averages) are widely watched. Price trading above these MAs is generally bullish. Crossovers, like a "golden cross" (50-day MA crossing above the 200-day MA), are considered strong long-term bullish signals. Conversely, a "death cross" (50-day MA crossing below the 200-day MA) is bearish.
Relative Strength Index (RSI): This momentum oscillator measures the speed and change of price movements, ranging from 0 to 100. An RSI above 70 is often considered overbought (suggesting a potential pullback), while below 30 is oversold (suggesting a potential bounce). However, in strong trends, BTCUSD can remain in overbought or oversold territory for extended periods. Bullish or bearish divergences between price and RSI (e.g., price making a new high while RSI makes a lower high) can signal weakening momentum.
MACD (Moving Average Convergence Divergence): This trend-following momentum indicator consists of the MACD line and a signal line. A bullish crossover occurs when the MACD line crosses above the signal line, suggesting increasing upward momentum. A bearish crossover is the opposite. The MACD histogram visualizes the distance between the MACD and signal lines; a growing positive histogram is bullish.
Horizontal Support and Resistance Levels: Beyond Fibonacci, historical price action creates distinct support (price floor) and resistance (price ceiling) levels. These are areas where the price has previously reversed or consolidated. Identifying these levels on daily and weekly charts provides a broader map of potential turning points.
Trendlines and Channels: Drawing trendlines connecting successive lows (uptrend line) or highs (downtrend line) helps visualize the dominant trend. Price often respects these lines. Parallel trendlines can form channels, providing dynamic support and resistance boundaries. A break out of a well-established trendline or channel can signal a significant change in trend.
Volume Analysis: Trading volume is a critical confirming indicator. A price rally accompanied by increasing volume is generally seen as healthy and sustainable. Conversely, a rally on declining volume may indicate weakening conviction. Spikes in volume during breakouts above resistance or bounces from support add validity to the price move.
Integrating these indicators with the primary observations about psychological levels, Fibonacci support, and candlestick patterns during volatile periods can provide a more robust and nuanced trading framework.
7. Risk Management in Bitcoin Trading
The high volatility inherent in BTCUSD, while offering profit potential, also necessitates stringent risk management. Without it, traders expose themselves to significant losses. Key risk management practices include:
Stop-Loss Orders: Always define an exit point for a trade if it moves against you. A stop-loss order automatically closes a position when the price reaches a predetermined level, limiting potential losses.
Position Sizing: Determine the appropriate amount of capital to allocate to a single trade based on your overall portfolio size and risk tolerance. A common rule is to risk no more than 1-2% of trading capital on any individual trade.
Risk/Reward Ratio: Before entering a trade, assess the potential profit (reward) versus the potential loss (risk). Aim for trades where the potential reward is significantly greater than the risk (e.g., 2:1 or 3:1).
Diversification: While this analysis focuses on BTCUSD, traders should consider diversifying their overall crypto portfolio if they are investors, rather than concentrating all funds in one asset.
Emotional Discipline: Avoid making trading decisions based on fear (FUD - Fear, Uncertainty, Doubt) or greed (FOMO - Fear Of Missing Out). Stick to a well-defined trading plan.
8. Potential Future Outlook (Based on Technicals)
Based on the current technical posture where Bitcoin shows strength above a key psychological level and finds support at Fibonacci retracement zones, the outlook leans cautiously optimistic, contingent on these supports holding.
Bullish Scenario: If BTCUSD continues to respect these support levels, particularly during periods of consolidation, and bullish candlestick patterns during volatile US evening/Asian morning hours lead to upward impulses, further upside is likely. A sustained break above immediate overhead resistance, confirmed by volume, could see BTCUSD challenge its next major resistance zones and potentially trend towards new highs. The ongoing defense of psychological levels is paramount for this scenario.
Bearish Scenario: Should the identified support levels (psychological and Fibonacci) fail to hold, the outlook could shift. A decisive break below these supports, especially on increased selling volume, would indicate that sellers have gained control. This could lead to a deeper correction, targeting lower support structures and potentially invalidating the current bullish sentiment. Increased volatility during the US evening/Asian morning hours could, in this case, exacerbate downward moves if bearish patterns emerge.
9. Conclusion
The technical analysis of BTCUSD reveals a market displaying notable strength, characterized by its ability to hold above a significant psychological price point and find robust support at Fibonacci retracement levels. This underlying resilience is a positive sign for bulls. The tendency for volatility to surge during the US evening and Asian morning trading sessions presents strategic windows for traders, particularly when seeking entries confirmed by validated bullish candlestick patterns at these critical support junctures.
A comprehensive trading approach should also integrate other indicators like moving averages, RSI, MACD, and volume analysis to confirm signals and understand the broader market context. While the current technical setup suggests a favorable environment for bulls, the inherent volatility of Bitcoin demands disciplined risk management practices. Traders must remain vigilant, adapting their strategies to the evolving price action and ensuring that any bullish conviction is continuously validated by the market's behavior at these key technical inflection points. The interplay between these technical elements will be crucial in determining BTCUSD's trajectory in the near to medium term.

Bitcoin still has strong supportThe RSI index is in a neutral-to-strong zone but has retreated from earlier levels, indicating that short-term upward momentum has weakened. The MACD indicator still maintains a bullish pattern, though the height of the bars has decreased. The price remains well above both the 50-day and 200-day moving averages, with the medium-to-long-term upward channel intact, keeping the overall structure in a strong bull market. However, there are signs of a potential short-term pullback.👉👉👉
On the daily chart, the Bitcoin price remains above the long-term trend breakout point since April. The 20-day moving average is at $103,260, forming a direct resistance level, while the 50-day moving average at $101,904 coincides with a key support level. As long as the Bitcoin price stays above this dynamic range, bulls still have opportunities.
In view of the current market conditions, short-term trading is recommended for investors to closely monitor the breakthrough of key support and resistance levels. If the price pulls back to the $100,000-$101,000 range and finds support, while forming daily K-line doji or long lower shadow patterns, appropriate position increases can be considered, with targets set at $105,000. After a breakthrough, the target can be further adjusted to $110,000. At the same time, due to market uncertainties and short-term pullback risks, investors should control their position sizes and avoid excessive leverage and blind chasing of gains or panic selling.
BTCUSD Trading Strategy
buy @ 102500-102700
sl 101000
tp 103800-104000
If you think the analysis helpful, you can give a thumbs-up to show your support. If you have different opinions, you can leave your thoughts in the comments. Thank you for reading!👉👉👉

BTC | New ATH Incoming | + 135% ??A very interesting fractal from 2021 lead to a 135% increase - and a new all time high.
Bitcoin has been following similar patterns to the bullish twin-peaks in 2021. After a multi-month correction, the price proceeded to increase another 135% over the next few months. Some weeks fast, and some weeks sideways.
Is it possible that BTC follows a similar pattern - and increase another 135%, all the way to 170k?
Hec, I'd even be happy with just a 100% ! That would lead us up to around 149k, which can also be considered a phycological resistance zone.
While you're here! Check out this post on PEPE:
_________________
BINANCE:BTCUSDT

BTCUSDT, We are in Up TrendHello everyone
According to the chart that you can see the price movement was moved exactly to the route the we analysed and shown weeks ago and according to this time , that analysed is valid
If you need some help you can send us messages
Good Luck
AA
BITCOIN Analysis (1H)We have a CHoCH (Change of Character) in the internal structure, and a bullish order block has been cleared. Price is currently within a supply zone, and there is a resistance line above the current price level.
It appears that price is aiming to pull back to lower support zones. These lower zones are fresh and unmitigated, so we expect that upon reaching them, price may bounce back upward toward the previous high.
A 4-hour candle closing above the invalidation level would invalidate this bias.
Do not enter the position without capital management and stop setting
Comment if you have any questions
thank you

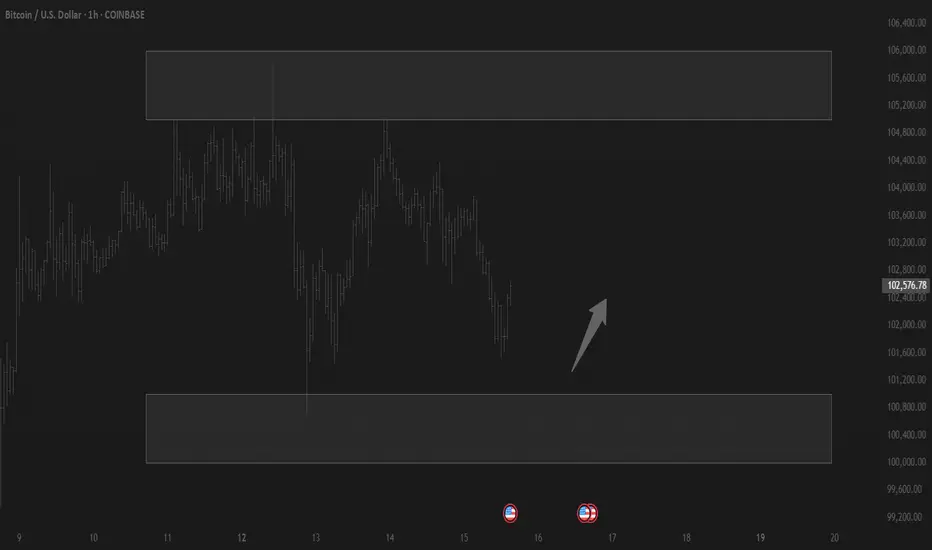
Correction Imminent? Will Bitcoin Drop Or Continue Rising?As we can see here, Bitcoin is challenging resistance very close to the All-Time High. This is a price range. The highest Bitcoin was able to hit was $105,850, right below $106,000. Will Bitcoin drop now, even if short-term, or continue moving higher?
» Bitcoin will continue higher and produce a minimum of retrace.
Bitcoin is very likely staying above $100,000 and after some consolidation continue higher to hit a new All-Time High.
While Bitcoin moved above $100,000 on the 8th of May, there isn't any bearish pressure nor bearish momentum. The bears have no strength.
If there is selling happening, the bulls are more than ready and happy to buy everything up. Anyone and everyone selling now will simply lose their coins and miss a huge opportunity because Bitcoin is already growing and will continue to grow. It is normal to see some consolidation after a strong resistance level is hit. This resistance stands around $105K. Once this level breaks, we will see additional growth.
Bitcoin is bullish.
The market is bullish.
Any retraces are just an opportunity to buy-up, rebuy and reload. Do not sell your coins, hold strong. Hold easy or even buy more because Bitcoin is going up!
It can start growing right away, within hours or it can take a maximum of few days but the next major move is up. When Bitcoin starts going, it never looks back. The market will continue growing. Rest easy and buy more Altcoins.
Namaste.

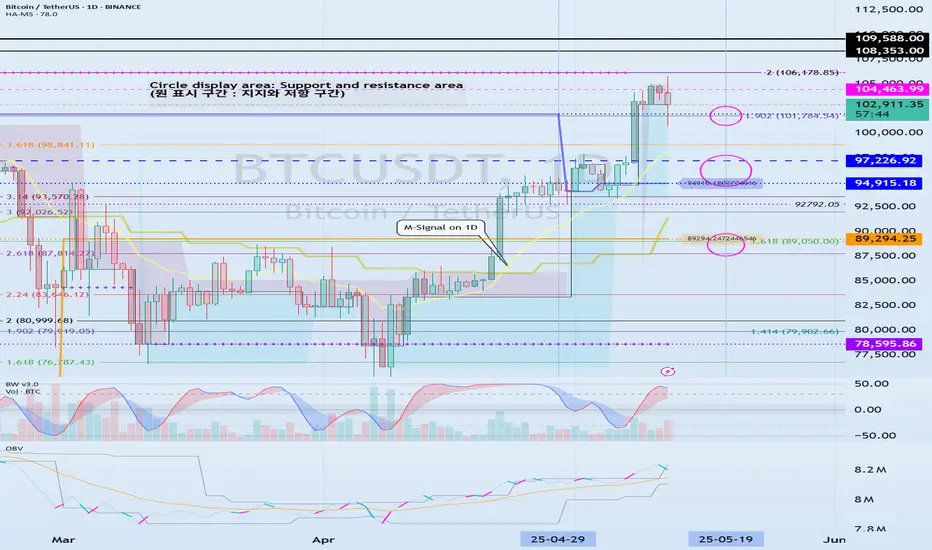
Important section: 101947.24-106133.74
Hello, traders.
If you "Follow", you can always get new information quickly.
Have a nice day today.
-------------------------------------
(BTCUSDT 1D chart)
It has touched the Fibonacci ratio 1.902 (101784.54) and is rising.
The key is whether it can receive support near the StochRSI 50 indicator (102971.99) and rise.
If not, it can fall to the 94915.18-97226.92 area.
Since the HA-Low indicator is formed at the 89294.25 point, it is important whether the price can be maintained above that point.
If the StochRSI indicator falls below the overbought range and then rises while moving sideways around the Fibonacci ratio range of 1.902 (101784.54) ~ 2 (106178.85), it is expected to renew the ATH.
Even if it falls more than expected, if it rises along the M-Signal indicator on the 1D chart, it is highly likely to renew the ATH.
----------------------------------------------------------
I will explain the newly added indicators, StochRSI 50, StochRSI 80, and StochRSI 20.
The disadvantage of interpreting the StochRSI indicator added as an auxiliary indicator is that it cannot determine the price movement.
Because of this, when interpreting the StochRSI indicator so far,
- Whether it is in the overbought or oversold zone,
- Whether StochRSI is above or below the 50 point,
we interpreted it as above.
Therefore, we added the price movement to the StochRSI indicator to check the movement more accurately.
-
The StochRSI 50 indicator is literally created when the StochRSI indicator passes the 50 point.
Therefore, we need to think about a response plan based on the price StochRSI 50 indicator.
-
The fact that StochRSI 80 is created means that the StochRSI indicator has risen above 80.
Therefore, in order to continue the upward trend, StochRSI must rise above 80.
If StochRSI 80 is not created and only StochRSI 20 is created, the upward trend will occur when the price is maintained above the StochRSI 50 indicator.
-
The fact that StochRSI 20 was created means that the StochRSI indicator has fallen below 20.
Therefore, in order to continue the downtrend, it must fall below StochRSI 20.
If StochRSI 20 is not created and only StochRSI 80 is created, the downtrend will occur when the price is maintained below the StochRSI 50 indicator.
-
Thank you for reading to the end.
I hope you have a successful trade.
--------------------------------------------------
- This is an explanation of the big picture.
I used TradingView's INDEX chart to check the entire range of BTC.
I rewrote the previous chart to update it by touching the Fibonacci ratio range of 1.902 (101875.70) ~ 2 (106275.10).
(Previous BTCUSD 12M chart)
Looking at the big picture, it seems to have been following a pattern since 2015.
In other words, it is a pattern that maintains a 3-year bull market and faces a 1-year bear market.
Accordingly, the bull market is expected to continue until 2025.
-
(Current BTCUSD 12M chart)
Based on the currently written Fibonacci ratio, it is displayed up to 3.618 (178910.15).
It is expected that it will not fall again below the Fibonacci ratio of 0.618 (44234.54).
(BTCUSDT 12M chart)
I think it is around 42283.58 when looking at the BTCUSDT chart.
-
I will explain it again with the BTCUSD chart.
The Fibonacci ratio ranges marked in the light green boxes, 1.902 (101875.70) ~ 2 (106275.10) and 3 (151166.97) ~ 3.14 (157451.83), are expected to be important support and resistance ranges.
In other words, it seems likely to act as a volume profile range.
Therefore, in order to break through this section upward, I think the point to watch is whether it can rise with support near the Fibonacci ratios of 1.618 (89126.41) and 2.618 (134018.28).
Therefore, the maximum rising section in 2025 is expected to be the 3 (151166.97) ~ 3.14 (157451.83) section.
To do that, we need to look at whether it can rise with support near 2.618 (134018.28).
If it falls after the bull market in 2025, we don't know how far it will fall, but considering the previous decline, we expect it to fall by about -60% to -70%.
So, if the decline starts near the Fibonacci ratio 3.14 (157451.83), it seems likely that it will fall to around Fibonacci 0.618 (44234.54).
I will explain more details when the downtrend starts.
------------------------------------------------------
Trading balanceTrading balance The price of the asset has rebounded from the balance zone. With the prospect of growth into the resistance zone.
Looks like the rally is going on... BTCUSDT Uptrend Analysis 📈
BTCUSDT is currently around $102,000 and in a short-term downtrend. Here are some key points to watch:
- Buying Opportunities: The $100,600 - $99,600 range may present a good buying opportunity. 💰
- Critical Levels: If the price drops below $99,400, there’s a risk of falling to $97,000. Investors should stay cautious. ⚠️
- Uptrend Targets: For the uptrend to continue, the $108,000 - $112,000 area looks like a suitable take profit zone. 🚀 After that, the $120,000 range could be targeted.
It's essential for investors to closely monitor market movements! 📊

$PYTH 1D Chart AnalysisEURONEXT:PYTH 1D Chart Analysis
Classic Inverse Head & Shoulders pattern spotted ✅
The neckline breakout is confirmed, but the price is now resetting the zone.
As long as it holds above the $0.16–$0.17 range, we could see a push toward $0.25 and $0.35, a potential 116%+ upside 📈
Watch this zone closely 👀
DYRO, NFA

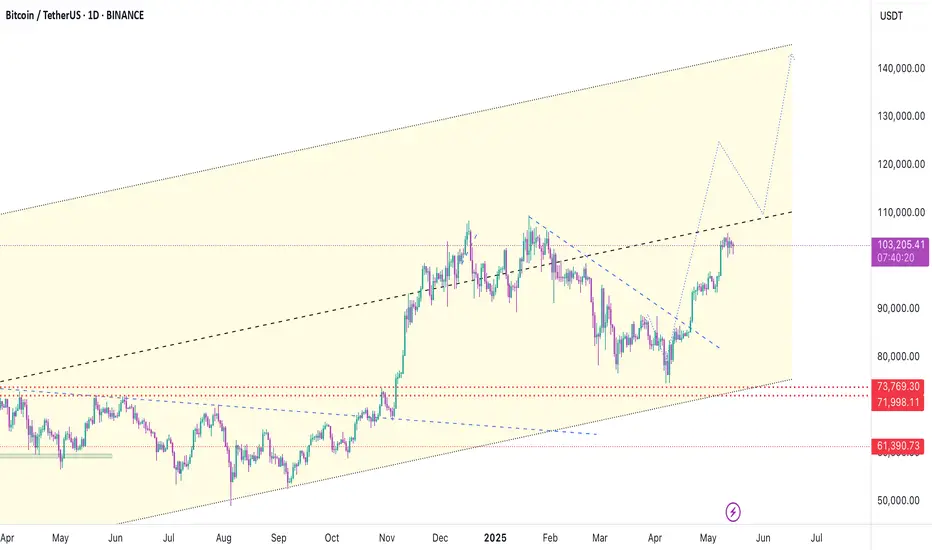
Bitcoin - An unusual chart!Over the past 3 years, I’ve noticed that Bitcoin has been moving in a consistently bullish pattern, as shown on the chart.
After breaking out of the red ellipse shape, Bitcoin tends to rally strongly—and that’s usually the signal for altcoins to follow. We’ve now broken out of this ellipse, and it looks like the real bullish move is just beginning.
In this chart, I’ve tried to illustrate both the potential upside ahead of us and the estimated timeframe in which this move could unfold.
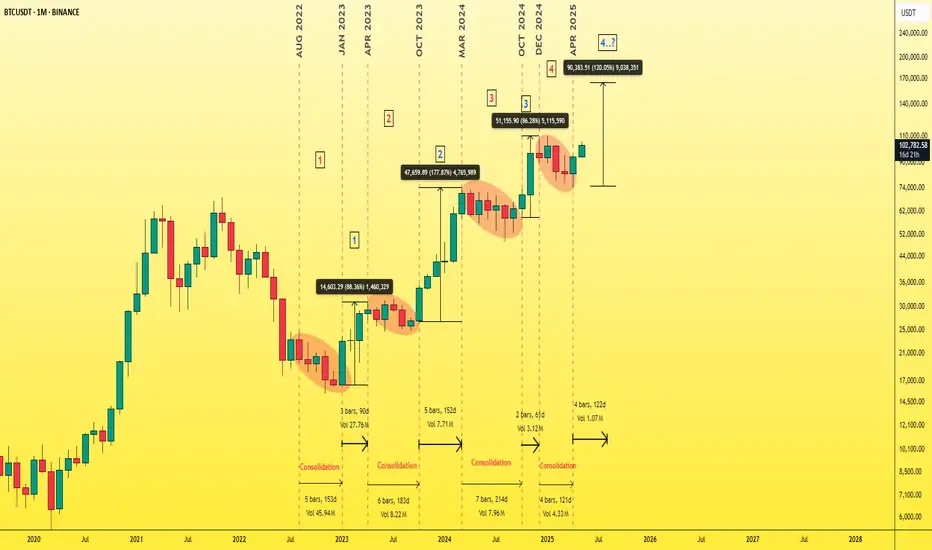
I’ve divided the chart into segments from August 2022 to April 2025.
🔸The red numbers 1, 2, 3, 4 indicate periods of consolidation.
🔸The blue numbers 1, 2, 3, 4 represent strong Bitcoin and altcoin rallies that follow the breakouts.
While the exact percentage gains and time durations may vary, if we take the average, we can estimate the upcoming move to be around 120%, taking Bitcoin to around $165K.
Similarly, the average time duration for each bullish move has been approximately 120 days.
[b ]Welcome to the bull market.
Best Regards Ceciliones 🎯
Bitcoin remains in high-level fluctuationsThe price of Bitcoin has generally remained above $103,000 today, demonstrating strong support. In the short term, after experiencing previous fluctuations, Bitcoin is currently in a relatively stable upward trend and continues to move towards higher prices.👉👉👉
Global economic events have contributed to the rise of Bitcoin. The decision between China and the U.S. to temporarily reduce tariffs has improved investor confidence and encouraged market risk appetite, making funds more willing to flow into risky assets like Bitcoin.
From a technical perspective, Bitcoin is in a strong upward trend. The RSI is above 70, indicating that Bitcoin may be in an overbought state in the short term. This could lead to a slight pullback or sideways consolidation in the upcoming market to digest excessive buying pressure. Investors need to pay attention to potential pullback risks, while closely monitoring factors such as macroeconomic data, policy changes, and market capital flows to adjust investment strategies in a timely manner.
BTCUSD Trading Strategy
buy @ 102700-103000
sl 101000
tp 104000-104200
If you think the analysis helpful, you can give a thumbs-up to show your support. If you have different opinions, you can leave your thoughts in the comments. Thank you for reading!👉👉👉

USDJPY 4H BULLISH ZONEBased on the USD/JPY 4-hour chart we provided, the market is currently in an ascending channel. A recent dip from the upper boundary of the channel suggests a possible retracement before a bounce back up. The chart indicates a bullish continuation pattern with a projected move toward the top of the channel and a marked target around 148.725–148.855.
Suggested Buy Trade Setup:
Entry Zone (Buy Limit):
Near the mid-channel or support trendline: 145.50–145.80
Take Profit Levels (TPs):
1. TP1: 147.00 – conservative target (near recent highs)
2. TP2: 148.00 – key resistance and psychological level
3. TP3: 148.725 – top of the channel
4. TP4: 148.855 – potential breakout level or final target
Stop Loss (SL):
Below channel support: 144.80–145.00, depending on risk appetite

$EGLDUSDT Trade SetupBINANCE:EGLDUSDT Trade Setup
EGLD just broke above the resistance zone and is now retesting it as support, a classic breakout + retest structure.
Price holding above key EMAs
MACD shows bullish momentum building
Looking ready for a move toward $24+
DYRO, NFA

Bitcoin is heading towards a new high.Bitcoin continues its upward trend, heading towards its highest peak ever, and a new peak is expected.

$BALUSD long trade setupCAPITALCOM:BALUSD Long Trade Setup 🚀
The breakdown of the downtrend is confirmed as the price is respecting the trendline support. It is poised for a substantial relocation!
Entry Zone: $1.0664 - $1.1270
Stop Loss: $0.9585
. TP1: $1.55
. TP2: $1.85
. TP3: $ 2.25
Confirmation: Breakout pattern with holding above trendline.
Make the most of 3x–5x margin of safety
It looks like the accumulation is finished.
A breakout season could ensue! 🔥
DYRO, NFA

BTCUSDT - 4H - GAP 92K - Chicago Futures - SHSBTCUSDT - 4H - POSSIBLE SHS
TRADEX BOT NEWS:
In addition to the automated execution of individual trading strategies, we are working on enabling the bot to perform COPY TRADING STRATEGIES.
We want Trading View developers to be able to monetize their INDICATORS and STRATEGIES by allowing COPY TRADING STRATEGIES.
If the indicator generates profits, the developer will collect a percentage of the profits generated.
We will soon have the first version of the TradeX BOT, which will function as a second-layer Order Book on CEX markets, hiding our greed (TP) and fear (SL) from exchanges.
More news soon!
Thank you!
_______________________________________________________
BTCUSDT - 4H - POSSIBLE SHS
LEVELS:
Resistance: 105k
DYNAMIC SL: 101k
2nd SHOULDER: 91k - 92k
Why could BTC make a SHS breakout?
It seems BTC is again topping out at 105k (coinciding with the horizontal shoulder line).
We have a SELL signal at these levels.
And third, we have a GAP at 92k in the Chicago FUTURES.
If BTC makes this correction, we would have a bullish SHS pattern that could take BTC to 140k.
To be successful in trading, it is essential to be faithful to our strategy. Be clear about where we are, where we want to go, and when it is best to be liquid. __________________________________________________
Automated cryptocurrency trading bots: All of these strategic alternatives can be configured with TradeX BoT, as it allows you to position in both directions without having to lock any amount per position. All that's required is for the conditions, either up or down, to be met for the orders to be executed in either direction, withdrawing the necessary deposits from the portfolio.
TradeX BoT (in development): Tool for automating trading strategies designed in TradingView. It works with indicators and technical drawing tools: parallel channels, trend lines, supports, resistances, etc. It allows you to easily set SL (%), TP (%), Trailing SL, multiple strategies on different securities, simultaneous buy and sell orders, and conditional orders.
This tool is in development, and the beta version will be available soon for testing.
FOLLOW ME and I'll keep you informed of our progress.
I share with you my technical analysis assessments on certain securities that I follow as part of the strategies I design for my portfolio, but I do not recommend trading with these indicators. Get informed, educate yourself, and create your own investment strategies. I hope my comments help you on your journey :)

BTCUSDT - 4H - POSSIBLE SHSBTCUSDT - 4H - POSSIBLE SHS
TRADEX BOT NEWS:
In addition to the automated execution of individual trading strategies, we are working on enabling the bot to perform COPY TRADING STRATEGIES.
We want Trading View developers to be able to monetize their INDICATORS and STRATEGIES by allowing COPY TRADING STRATEGIES.
If the indicator generates profits, the developer will collect a percentage of the profits generated.
We will soon have the first version of the TradeX BOT, which will function as a second-layer Order Book on CEX markets, hiding our greed (TP) and fear (SL) from exchanges.
More news soon!
Thank you!
_______________________________________________________
BTCUSDT - 4H - POSSIBLE SHS
LEVELS:
Resistance: 105k
DYNAMIC SL: 101k
2nd SHOULDER: 91k - 92k
Why could BTC make a SHS breakout?
It seems BTC is again topping out at 105k (coinciding with the horizontal shoulder line).
We have a SELL signal at these levels.
And third, we have a GAP at 92k in the Chicago FUTURES.
If BTC makes this correction, we would have a bullish SHS pattern that could take BTC to 140k.
To be successful in trading, it is essential to be faithful to our strategy. Be clear about where we are, where we want to go, and when it is best to be liquid. __________________________________________________
Automated cryptocurrency trading bots: All of these strategic alternatives can be configured with TradeX BoT, as it allows you to position in both directions without having to lock any amount per position. All that's required is for the conditions, either up or down, to be met for the orders to be executed in either direction, withdrawing the necessary deposits from the portfolio.
TradeX BoT (in development): Tool for automating trading strategies designed in TradingView. It works with indicators and technical drawing tools: parallel channels, trend lines, supports, resistances, etc. It allows you to easily set SL (%), TP (%), Trailing SL, multiple strategies on different securities, simultaneous buy and sell orders, and conditional orders.
This tool is in development, and the beta version will be available soon for testing.
FOLLOW ME and I'll keep you informed of our progress.
I share with you my technical analysis assessments on certain securities that I follow as part of the strategies I design for my portfolio, but I do not recommend trading with these indicators. Get informed, educate yourself, and create your own investment strategies. I hope my comments help you on your journey :)

BTCUSDT hit take profit.Although the trade took a bit longer to play out, as always, BTC delivered solid profits. This will be my first and last trade of the day.
I'll be back to share new opportunities tomorrow if the market presents them, traders.
Wishing you all profitable days — much love to each of you! 🙂

BTCUSDTHere is your translated and polished English version with a professional and data-driven tone:
Hello traders.
Today's first trade comes from BTC. Currently, BTC’s delta value is very close to turning negative (currently at +0.72%). In addition to that, we’re seeing the Activity and Volume Order Flow Profile positioned at a highly critical level.
For these reasons, I’ve opened a sell position on BTC. You can find the full trade details below:
🔍 Criteria:
✔️ Timeframe: 15M
✔️ Risk-to-Reward Ratio: 1:1.50 / 1:2
✔️ Trade Direction: Sell
✔️ Entry Price: 103,796.33
✔️ Take Profit: 103,428.49
✔️ Stop Loss: 103,979.65
🔔 Disclaimer: This is not financial advice. It’s a trade I’m personally taking based on my own system, shared purely for educational purposes.
📌 If you're also interested in systematic and data-driven trading strategies:
💡 Don’t forget to follow the page and subscribe to stay updated on future analyses.

$WXT Breakout Alert!$WXT Breakout Alert!
$WXT just reclaimed a major supply zone after weeks of consolidation
If this breakout sustains, we could see a 60% move toward $0.053720
Momentum looks strong, eyes on the prize!
DYRO, NFA

BTC Testing Red Resistance – Potential Breakout Ahead!🚀 CRYPTOCAP:BTC Testing Red Resistance – Potential Breakout Ahead! 📈
CRYPTOCAP:BTC is currently testing the red resistance zone. A potential breakout could be coming soon, and we might see a new all-time high (ATH)! 🔥
Let’s watch this breakout closely! 💼💸
