$BTC - Lower Timeframe OutlookCRYPTOCAP:BTC | 1h
Didn't expect such a strong rejection, another push back to 107k now seems unlikely
If we get a reaction at 102k to 101.5k ( val) , we might see a complacency bounce into 104.5k–105.3k to fill some inefficiencies.
That'd be a solid short, targeting 95k–94k
BTCUSDT

Bitcoin Retests Ascending Trendline After BreakoutBTCUSD daily chart shows price action respecting a rising trendline, following a successful breakout from previous pattern. This ascending trendline now acts as a key dynamic support and serves as a central guide for the medium-term bullish structure.
Currently, price is consolidating just below the $107,000 resistance area. There are two primary scenarios to consider:
Bullish Scenario:
A confirmed breakout and daily close above the $107,000 resistance could trigger another bullish leg, targeting the next level near $120,000.
Mild Bearish / Pullback Scenario:
If the price gets rejected again, it may retrace towards the ascending trendline around $95,000, which aligns with previous horizontal support and could serve as a solid buy-the-dip zone.
Trade Plan:
Buy Entry Option 1: On a breakout above $107,000 → Target: $120,000
Buy Entry Option 2: On a bounce from the trendline near $95,000

$GOAT/USDT 1H Chart Breakout Alert!$GOAT/USDT 1H Chart Breakout Alert! 🐐
After a clean breakout from the downtrend line, price is now retesting the breakout zone + key demand area 🔥
- Entry: CMP
- Target: $0.20+
- SL: Below $0.142
Setup looks solid 👀
DYRO, NFA

Bitcoin Hits New ATH on Candle Close & New 2025 ATH ProjectionsThis week Bitcoin produced its highest weekly candle close ever at $106,454. 12-May 2025 weekly session.
The previous ATH based on candle close happened on the 9-December 2024 weekly session at $104,464.
The current high is 1.91% higher than the previous one. Volume is still basically zero on this chart...
Good evening my fellow Cryptocurrency trader—likely to be morning by the time you read this—how are you feeling in this beautiful day?
Bitcoin actually did better than expected but this is not surprising, because Bitcoin is always a surprise on the positive side. This already tells us that the new bullish cycle top can turn out being something completely unexpected, the institutional wave.
The volume...
There are many ways to extract targets so don't mind me using different methods and showing the different possibilities. It is good to have a broad market perspective. Instead of just one option, we can look at all the possible scenarios.
The standard All-Time High based on the previous cycle sits at $155,601. Four years later, hyper hidden inflation, etc., we know this is not it. This same level based on dollars value, $155,000, would be something like $189,000 or $206,000 today, so we are not going to consider this level to be the end of the 2025 bull market.
There is no 180K in this setup. The next target is the 3.618 Fib extension and goes to $209,125. This is more like it. This is a very strong level and there is possibility that Bitcoin can peak right below it.
The next one and last one is the 4.618 Fib extension at $262,649... Let's consider this number for a few minutes. Close your eyes, breathe... Think of Bitcoin, late 2025 or early 2026 and consider this number. Do nothing and just let any impressions come to you. Can be visual, auditory, kinaesthetic or just mental chatter, logical. Yes, it is possible! We keep beyond $250,000 on the cards. Share your impressions in the comments section by the way.
Low volume is natural. If you look at this chart from March 2020 through November 2021 there is no significant spike in volume. It is neutral. So this signal has no use for us at this point. The data-based conclusion is the fact that Bitcoin has been going up for six weeks and volume continues to be low. It was only high when the market hit bottom in 2022 and when it broke up above the 2017 peak in early 2023, that's the highest volume.
Look at this black line:
This is the golden ratio, 1.618 Fib extension in relation to the previous market cycle. It is very interesting. This same level from years ago worked as resistance in late 2024/early 2025.
Last week Bitcoin closed above this level and this week it wicked below and finally closed above. Definitely the action happening here around $102,000. So these numbers are good.
We have a certain price of $155,601 in the coming months, this will be a very strong resistance, the midterm bull market correction can happen here. After the correction bottoms, we will have wave 5 and this one must go beyond this level in order to be real, so this opens up $209,000. Unless $155,000 is the cycle top and ATH, we are set to experience Bitcoin trading above 200K.
My friend, it is my pleasure to write for you again today. Its been so long, I cannot believe we are still seeing each other, exchanging, talking, chatting, trading, reading, writing, fighting and making up just to keep on growing together. Where were you 7 years ago? Where are you now?
Thanks a lot for your continued support.
Namaste.

Bitcoin Hits Highest Prince Since JanuaryThis is a pattern breaker. Volume is rising together with prices.
There was a rejection right below 106,000 but rather than a rejection a bear-trap & shakeout.
The move higher now confirms this.
Bitcoin is now trading with a full green candle and continues to challenge resistance. As prices move to $106,000, this is the highest since January 2025. A full recovery and a challenge of resistance leading to a new All-Time High.
It seems the new week, 19-May, will be the week when Bitcoin makes history again. This is all positive.
This is a short-term chart; 1H.
Many shakeouts are happening now, both bears (LONGs) and bulls (SHORTs) are being liquidated. Liquidation can only happen with positions using too much leverage. Everybody with 5X or lower is extremely safe long-term and can rest easy. Only the gamblers are having a hard time right now.
The market will continue to shake. Volatility can go up. Regardless of the short-term, Bitcoin is set to grow.
Namaste.

The point to watch is whether it can rise above 106133.74
Hello, traders.
If you "Follow", you can always get new information quickly.
Have a nice day today.
-------------------------------------
In order to distinguish which time frame chart the line was drawn on, it is divided into 3 types of lines.
You can create a trading strategy by responding to the support and resistance points or sections drawn on the chart depending on whether there is support or not.
-
The left is an example of when the support and resistance points were first created, and the right is an example of what it looked like after that.
To draw support and resistance points, you need to understand the arrangement of candles.
By checking how the candles are arranged, you can draw support and resistance points or sections like the example chart.
To draw support and resistance points or sections on a time frame chart like this, you need to check the arrangement of candles while minimizing the chart as much as possible.
-
Indicators are used to draw this work using more objective information.
That is, lines are drawn at the DOM(60), DOM(-60), HA-High, and HA-Low indicator points.
In this way, you will be able to reduce your subjective thoughts as much as possible.
Reducing your subjective thoughts will ensure the reliability of the drawn support and resistance points or sections.
-
Going back and drawing support and resistance points or sections with the arrangement of candles means that there must have been movement of candles in the past.
Therefore, if the candle moves to a point where there is no trace of the past, you can no longer draw support and resistance points or sections.
In terms of compensating for this shortcoming, it may be more useful to use indicators to display support and resistance points or sections.
-
The DOM indicator is an indicator that comprehensively evaluates the DMI + OBV + MOMENTUM indicators.
If the DOM indicator is 60 or higher, it means that all indicators have risen above their highest value.
If the DOM indicator is -60 or lower, it means that all indicators have fallen below their lowest value.
The fact that the DOM(60) indicator was created means that it is likely to enter the high point range.
The fact that the DOM(-60) indicator was created means that it is likely to enter the low point range.
Therefore, the DOM(60) indicator is likely to correspond to the resistance point, and the DOM(-60) indicator is likely to correspond to the support point.
Since the DOM indicator is displayed on the Close value, it has the disadvantage of being difficult to respond immediately when the actual DOM indicator is created.
However, once it is created, it will faithfully perform the role of support and resistance.
-
The HA-Low and HA-High indicators are indicators created to determine the trading point from the Heikin-Ashi candle.
Accordingly, the plotted point corresponds to the average value.
Therefore, the HA-Low and HA-High indicator points have the disadvantage of being expressed differently from the candle's value.
As you can see from the formulas of the HA-Low and HA-High indicators, the RSI value is included in the conditions of the formula.
The fact that the HA-Low indicator was created means that the price rose from the low point range.
Therefore, the HA-Low indicator corresponds to the support point.
The fact that the HA-High indicator was created means that the price fell from the high point range.
Therefore, the HA-High indicator corresponds to the resistance point.
Therefore, we basically have a trading strategy of buying when the HA-Low indicator is created and selling when the HA-High indicator is created.
-
It is not clear whether the actual support and resistance points or sections are supported or resisted.
However, as time passes, we can see whether it is supported or resisted.
To help determine whether it is supported or resisted, we use the StochRSI indicator and OBV indicator as auxiliary indicators.
-----------------------------------------
(BTCUSDT 1D chart)
It is showing an upward trend above the DOM (60) indicator displayed at the current candle position.
And, if StochRSI rises above 80 and maintains the price, the possibility of an upward trend will increase.
If the auxiliary indicator StochRSI indicator rises in the oversold zone and OBV rises above the High Line, the upward trend will be guaranteed.
The previous DOM (60) indicator is formed near the Fibonacci ratio 2 (106178.85).
Therefore, the point of observation is whether it can rise above that.
If it rises and maintains the price, it is expected to renew the ATH.
If not, and it falls below the HA-High indicator or the M-Signal indicator on the 1D chart,
1st: 97226.92
2nd: M-Signal on the 1W chart
You should check for support near the 1st and 2nd above.
-
This volatility period is expected to continue until May 20.
However, volatility may also occur around May 23 (May 22-24) and around May 27 (May 26-28), so you should be careful of volatility until May 28.
-
Thank you for reading to the end.
I hope you have a successful trade.
--------------------------------------------------
- This is an explanation of the big picture.
I used TradingView's INDEX chart to check the entire range of BTC.
I rewrote the previous chart to update it by touching the Fibonacci ratio range of 1.902 (101875.70) ~ 2 (106275.10).
(Previous BTCUSD 12M chart)
Looking at the big picture, it seems to have been following a pattern since 2015 and has been rising.
In other words, it is a pattern that maintains a 3-year uptrend and faces a 1-year downtrend.
Accordingly, the uptrend is expected to continue until 2025.
-
(Current BTCUSD 12M chart)
Based on the currently written Fibonacci ratio, it shows up to 3.618 (178910.15).
Fibonacci ratio 0.618 (44234.54) is not expected to fall again.
(BTCUSDT 12M chart)
I think it is around 42283.58 when looking at the BTCUSDT chart.
-
I will explain it again with the BTCUSD chart.
The Fibonacci ratio ranges marked in the light green boxes, 1.902 (101875.70) ~ 2 (106275.10) and 3 (151166.97) ~ 3.14 (157451.83), are expected to be important support and resistance ranges.
In other words, it seems likely to act as a volume profile range.
Therefore, in order to break through this section upward, I think the point to watch is whether it can rise with support near the Fibonacci ratios of 1.618 (89126.41) and 2.618 (134018.28).
Therefore, the maximum rising section in 2025 is expected to be the 3 (151166.97) ~ 3.14 (157451.83) section.
To do that, we need to look at whether it can rise with support near 2.618 (134018.28).
If it falls after the bull market in 2025, we don't know how far it will fall, but considering the previous decline, we expect it to fall by about -60% to -70%.
So, if the decline starts near the Fibonacci ratio 3.14 (157451.83), it seems likely that it will fall to around Fibonacci 0.618 (44234.54).
I will explain more details when the downtrend starts.
------------------------------------------------------

Bitcoin 6th Consecutive Week Green? Not Yet But...Wait! We are not there yet but I will explain this is good even if this turns out not to be the final outcome.
The last time that Bitcoin produced 6 weeks green in a row was October 2023. Yes, you guessed it, when Bitcoin moved above ~$30,000 for the first time after the bear market and this led to now, a new All-Time High of $110,000.
The same development now, in May 2025, sends a very strong warning for the bears and a super strong signal for the bulls. This means that a rise can continue to happen—because it is already underway with 5-weeks green—toward $200,000 or higher.
Even if the week were to close red the truth is that Bitcoin is rising with strong bullish momentum and a red week within the uptrend is nothing more than consolidation.
The current week has a long lower shadow which is bullish. The candle body being red or green would be irrelevant as the candle would still be a Doji which in this case means neutral. Neutral on the rise means that the previous candle and market dynamics is the predominant factor; in short, the uptrend continues.
Now, the possibilities are in our favor being right 100% choose to follow Bitcoin will keep on growing and now for more than 1.5 months and this is great. The Altcoins will BOOM! as soon as Bitcoin hits $110,000 and the best news is that this is not the end, only the start.
We are looking at the strongest bullish signal since October 2023. Bitcoin closing six consecutive weeks green. This would only confirm what is already happening and what we already know. The 2025 bull market is on.
Let's add a little bit more of support to our analysis because some people are lost. Leave comment with your thoughts.
The RSI, weekly, reads 64.64 this is super strong. Basic.
A strong RSI is needed for a massive rise and at the same time, read this, there is plenty of room available for additional growth and we are back to the terminology we used back in December 2017. Nice isn't it?
Here is the chart:
The weekly MACD is ultra-hyper bullish:
The MACD bullish cross came in just now and this with the MACD reversing above zero, within the bullish zone. Basically, the MACD hit bottom and is ready to grow. "Plenty of room available for growth." Literally, in front of a major advance.
The last time the MACD looked like this was in October 2024. Before the major new ATH everything my people... This is it! Bitcoin LONG only bullish.
Ok, let's continue.
The short-term doesn't matter it is up-confirmed until late 2025. $200,000 more or less confirmed. Who cares about the noise?
Finally, Bitcoin is easily trading above ALL moving averages.
Comment & follow...
Namaste.

Your Crypto Wallet Isn’t Safe AnymoreA security update is splitting the market in two; some think they’re safe, others are running scared!
Security becomes dangerous when it makes you careless — and right now, that’s exactly where we are!
Whales aren’t just switching wallets, they’re changing where the money flows… and you need to know
Hello✌
Spend 3 minutes ⏰ reading this educational material .
🎯 Analytical Insight on Bitcoin: A Personal Perspective:
Bitcoin has recently established multiple daily resistance levels and has now executed a strong breakout above its long-standing descending channel. This move is backed by a significant increase in buying volume, signaling renewed bullish momentum. From a short-term perspective, I anticipate at least a 6% upside, with a target around the $110,000 zone. 📊🚀
Now , let's dive into the educational section,
🔐 New Security in Crypto
Tech like MPC and smart contract wallets look fancy but come with a lot of questions underneath.
If your private key isn’t in your hands, then you don’t really own your wallet.
Most people feel safe because they don’t have to memorize a seed phrase. But that one phrase could save or ruin you.
🧠 Trader Psychology and Feeling Safe
False security makes traders ignore managing their risk and stop doing real analysis.
Thinking “everything’s safe” shuts down your brain — right when the market is about to turn.
In crypto, fear and greed run the show; security is just an excuse to get greedy.
📈 Market Reaction to Security Updates
Tokens like TWT, SFP, and KASPA pump after security upgrades, but those pumps are often fake.
When exchanges roll out security updates, smart money is actually pulling out, because whales want real control, not just a safe look.
📉 Security Without Responsibility?
Social recovery means relying on a group of people. What if someone in that group betrays you?
Users think it’s easier now, but easier doesn’t always mean safer — sometimes it’s way riskier.
🕵️♂️ Watch What Whales Do
Data from TradingView shows old-style wallets are gaining users after MPC updates.
Whales prefer a hardware wallet and a paper backup over smart recovery systems any day.
📊 Tools You Need to Know ( in TradingView )
Use Wallet Flow and Smart Money Index on TradingView to track where the money’s moving.
The Wallet Activity heatmap tells you when the market is gearing up for a big move.
🤯 Feeling Safe = Market Blind Spot
When everyone feels safe, that’s exactly when the most liquidations happen.
Calm markets are traps built by whales to catch others off guard.
🔄 Final Thoughts
Security should be a tool, not an illusion. If you put all your trust in tech, you no longer control your money.
A pro trader doubts even when the market says it’s safe, because in crypto, nothing is ever guaranteed.
However , this analysis should be seen as a personal viewpoint, not as financial advice ⚠️. The crypto market carries high risks 📉, so always conduct your own research before making investment decisions. That being said, please take note of the disclaimer section at the bottom of each post for further details 📜✅.
Give me some energy !!
✨We invest countless hours researching opportunities and crafting valuable ideas. Your support means the world to us! If you have any questions, feel free to drop them in the comment box.
Cheers, Mad Whale. 🐋

BTC Preparing for A Move Towards $110k Are You Ready?Bitcoin Market Update: BTC Preparing for a Move Towards 109,200 and 110,000 Levels
Bitcoin (BTC) appears to be gearing up for a potential upward move targeting the 109,200 to 110,000 price range. Over the past several days, Bitcoin has been consolidating within a tight range, indicating accumulation and market indecision. However, the latest price action has shown a strong bullish breakout, confirmed by a solid bullish candle, followed by a healthy retest of the breakout zone.
This retest suggests that Bitcoin may now be preparing for its next leg upward. The current price area presents a possible buying opportunity, especially as we approach the key black-marked zones on the chart. These levels are significant because they hold pending liquidity from previous days’ highs and also correspond to notable swing highs—areas where the market previously reversed.
Traders should remain alert and not miss this potential opportunity. It's crucial to monitor the market closely for any structural shifts or additional confirmation signals, such as bullish patterns, increased volume, or momentum indicators aligning with the upward trend.
As always, conduct your own research (DYOR) before making any trading decisions. Market conditions can change rapidly, and informed decisions backed by solid analysis are essential for successful trading.

BTCUSD 1H TIMEFRAME BULISH ZONEThe chart you've shared for BTC/USD (1H timeframe) indicates a bullish outlook based on the following elements:
Ascending Channels: Price moved within two rising channels, suggesting a bullish momentum.
Support Zone: Marked by arrows, previous bounces suggest strong support near 102,200–102,300.
Breakout and Pullback: Price appears to be forming a higher low, potentially preparing for the next upward leg.
Target Area: Marked around 105,630 (TP target).
Summary:
Entry (Buy Zone): Around 103,200–103,300.
Stop Loss (SL): Below 102,200 (conservative stop).
Take Profit (TP): 105,630 (as marked on chart).
Risk-to-Reward Ratio: Approximately 1:2 or better.

BTC/USD 1-Hour Range Analysis: Key Levels & StrategieBTC/USD 1-Hour Chart Analysis 📊
Currently, BTC/USD is oscillating within the 101,500–105,000 range on the 1-hour chart 📈.
Key Levels
Support: 101,500 acts as short-term support 🛡️. Below that, the strong support lies at 100,600 — a breach of this key level could trigger a sharp price decline.
Resistance: 105,000 is a tough resistance level 🚧, with multiple failed upward attempts. The area above 106,000 forms a resistance zone, which bulls must overcome to initiate a significant uptrend.
Trend
The price is in a downward consolidation phase, with recent highs and lows gradually decreasing. However, chart patterns suggest a potential rebound after testing support, hinting at a possible short-term trend shift 🤔.
⚡⚡⚡ BTCUSD ⚡⚡⚡
🚀 Sell@105000 - 106000
🚀 TP 102500 - 101500
🚀 Buy@101500 - 102500
🚀 TP 105000 - 106000
Accurate signals are updated every day 📈 If you encounter any problems during trading, these signals can serve as your reliable guide 🧭 Feel free to refer to them! I sincerely hope they'll be of great help to you 🌟

BTC/USDT at Decision Point: Triangle Pattern Signals BreakoutHello guys!
Bitcoin is consolidating in a symmetrical triangle pattern near a key resistance zone after a strong uptrend within the ascending channel. The price is trading just below the triangle’s top line, indicating a potential breakout or breakdown setup.
✔ Key Scenarios:
👀 Scenario 1 – Bullish Breakout:
If BTC breaks above the top of the triangle, we could see a sharp move upward toward the $106K resistance zone and potentially higher.
This would signal trend continuation and strength in the bullish momentum.
👀 Scenario 2 – Temporary Pullback (Triangle Breakdown):
If BTC breaks the bottom of the triangle, the price might fall toward the $99,715 support level.
This zone is also aligned with a previous consolidation and could serve as a strong demand area.
A bullish reversal from this area is likely, providing another long opportunity targeting the same $106K resistance.
Conclusion:
Bitcoin is moving in a tightening range. A breakout from the triangle will dictate the next move. For clearer direction, traders should watch for a decisive move above or below the triangle structure.

BTC/USDTbtc is ready to enter acceleration phase.
expect high volatility in all coins. it's better to go for swing long or hold rather than using high leverage with tight stop losses

Bitcoin Ready to Explode – Just Like Last TimeCRYPTOCAP:BTC is currently showing a powerful accumulation and breakout pattern, repeating the same bullish structure that led to explosive rallies in the recent past.
The chart highlights three key zones where Bitcoin consolidated before breaking out:
🔹 First breakout from the $81K–$86K zone
🔹 Second breakout above $93K after holding above the 50 EMA
🔹Now, Bitcoin is accumulating again just below a key resistance zone (~$105K–$106K)
This resistance zone has acted as a ceiling before, but the current price action suggests strength. The tight consolidation just below resistance often precedes a breakout — and if it happens here, Bitcoin could explode toward $115K+ in the coming weeks.
Key Technical Points:
🔹50 EMA is acting as dynamic support
🔹Higher low structure remains intact
🔹Each consolidation is followed by a strong upward breakout
Repeating accumulation breakout pattern is visible
Next targets: $111K → $115K → $120K
Invalidation: Breakdown below GETTEX:98K with strong volume
If you found this helpful, don’t forget to like, comment, and repost.
Thank you!
#BTC #BTCUSDT #Unichartz

$GOAT Update MIL:GOAT Update
After a strong breakout, the price has retested the trendline, and the previous resistance has now flipped into support
Bulls stepped in from the green zone like clockwork, still bullish!
Next target: $0.25+ incoming? 👀
DYRO, NFA

BTC 4H Chart Analysis - Bitcoin is currently moving within a range, and two potential demand zones are highlighted on the chart with green boxes. There's a possibility that BTC may pull back into one of these zones to collect buy-side liquidity before continuing higher.
These areas can be considered for long setups on the 15-minute timeframe — but only with a valid entry trigger.
---
📌 Key Levels
🟢 Supports:
- 100,000 – 100,500
- 97,400 – 98,700
- 95,900
🔴 Resistances:
- 104,800 – 105,200
- 105,900

Bitcoin Short-Term, Bullish Continuation (Comment ATH Confirmed)The dynamics of Bitcoin are the dynamics of the entire Cryptocurrency market. If you can predict Bitcoin, you can predict Crypto; it also works in reverse. Follow the Altcoins through hundreds of charts and know exactly what Bitcoin will do in advance.
A bullish signal is a bullish signal. A lack of bearish signals is a bullish signal when market conditions are bullish makes sense?
For example, Bitcoin moved forward 8-May and went sideways, now we are talking about Bitcoin short-term. Bitcoin has been sideways for 10 days with little retrace no drop at all this is bullish. The fact that the market isn't dropping is bullish. Current conditions predict/point to a continuation of the bullish move.
Since Bitcoin is trading high up, strong near resistance and above 100K. A bullish move and continuation means a new All-Time High yes? This is awesome watch Crypto grow confirmed extremely powerful system the charts technical analysis is great.
Two ways to look at it. The fact that many Altcoins remained strong while Bitcoin was sideways or even growing predicts that Bitcoin will continue growing but tell me why now! This is because when Bitcoin is set to crash or move lower the Altcoins crash even stronger. The lack of major bearish action on the Altcoins indicated that the market was experiencing a short retrace and that this retrace would be followed by additional growth. This is all that we have it is true now Bitcoin is going up.
This is Bitcoin short-term. The main move is an advance that turns sideways. The sideways period is consolidation of this advance. Consolidation is neutral. Since neutral the momentum that remains and bias is the initial move and the initial move was a break of resistance. This all means that once consolidation is over, Bitcoin will continue to grow? Agree with me always follow support with comment below.
It is easy only takes a few seconds of your time you gain reputation, raise in the ranks both happy win-win it is free and I can continue to share more content we can agree or disagree comments is a great tool use them now watch, just see hear and feel me.
Thank you again for reading and I hope you are being entertained. We are here long-term and while Bitcoin is going up, billions of dollars of SHORT traders will be liquidated in the coming days. Why? Because they are using the ATH as an excuse to bet down and this is a mistake. When Bitcoin is rising, move off the way —leave a comment.
Namaste.

Bitcoin's weekly closeBitcoin's weekly close tonight is crucial. It's good if it closes above its all-time weekly high to continue the uptrend and form a new peak.

BTC Medium Term and Local Work for 2025 18 05 2025Logarithm. Time frame 3 days. Everything is shown extremely accurately, according to technical analysis, logic based on cyclical repetition, and liquidity consolidation zones as a result of price and trading movements. This trading idea, with precise reversal zones and targets, will last you for 31 weeks. That is, for 7 months.
The previous trading idea BTC/USD Triangle. Medium-term and local work , published on 7 06 2024, it lasted me almost 1 year. It has 63 local work updates (I don't spam with new trading ideas on principle). So, nothing will get lost, you can follow everything, read, possibly use it as training material on a live chart, as a whole explanation of local work, what is really happening on the market, profit/loss potential, always before the price movement, and not after the fact. I show what is, that is, a chart and potential work from the position of a trader, not a crypto marketer.
🟣 Local and medium urgent now
1️⃣💸 The bullish triangle itself (which is not there yet, I have depicted it on the chart for you) acts as a stop and consolidation zone (zone “psychology 100”, reset in trend No. 1). This is the easiest to manipulate and the most probable scenario. This will just be the summer consolidation. Instead of it, there may be:
2️⃣💸 Rising wedge , but more in shape like a triangle (essentially a wedge, there is a meaning of a triangle, but it was formed on aggressive pump news), with a large short liquidity takeout, and not very good logic of the TA movement after that... But, this is a bullish scenario, although quite aggressive.
3️⃣ Working out the bearish targets of the triangle (non-corrective price movement within its canvas). Stopping the decline in the designated zone and reversal upward (continuation of the trend). I emphasize the importance of not fixing the price below the zone of targets of the local corrective decline, which will not break the trend.
4️⃣💸 Double top (or triple). Double top as in 2021 in the distribution zone. This is the least likely scenario, but the most negative, as it breaks the trend. But, this is the least likely scenario, primarily because of the altcoins.
Altcoins in 2021 and now.
4️⃣In 2021, when Bitcoin formed a double top, they (altcoins) were in “space”, that is, in their distribution zones (+500-1000% of the average price of the set).
🔽Now everything is the other way around, they are in capitulation zones (most of them) or in their long-term accumulation channels :
Liquid -90-93%
Medium liquid -93-96%
Low liquid -96-98% or some are already scams or on the verge of it...
Some altcoins have pumped up earlier. That is, they left their long-term accumulation zones earlier. For example: SUN, XRP, DOGE, PEPE, SOL and so on... But there are very few of them, as distributing (raising the price, holding it and selling, inspiring to buy expensive when everything is cheap) in a bearish altcoin trend is very irrational, and you need a lot of money to go against the general market trend.
Main trend (most of it, chart since Binance Exchange foundation) for clarity on a large time frame of this local zone for work.
BTC Primary trend. Secondary — expanding triangle.

Bitcoin: Next Stop is at 144,000Looking at historical data, Bitcoin has experienced similar price growth following the last two MACD crossovers on the weekly chart. We’re now witnessing a third MACD crossover, and if history repeats itself, this could project Bitcoin’s price to around $144,000.
This is a conservative estimate, based on past performance during the middle of previous bull runs. Currently, we appear to be in the final leg of this cycle — which could mean even more upside compared to the previous two MACD crossovers.
What’s your Bitcoin target? Drop your predictions in the comments!
Cheers,
GreenCrypto

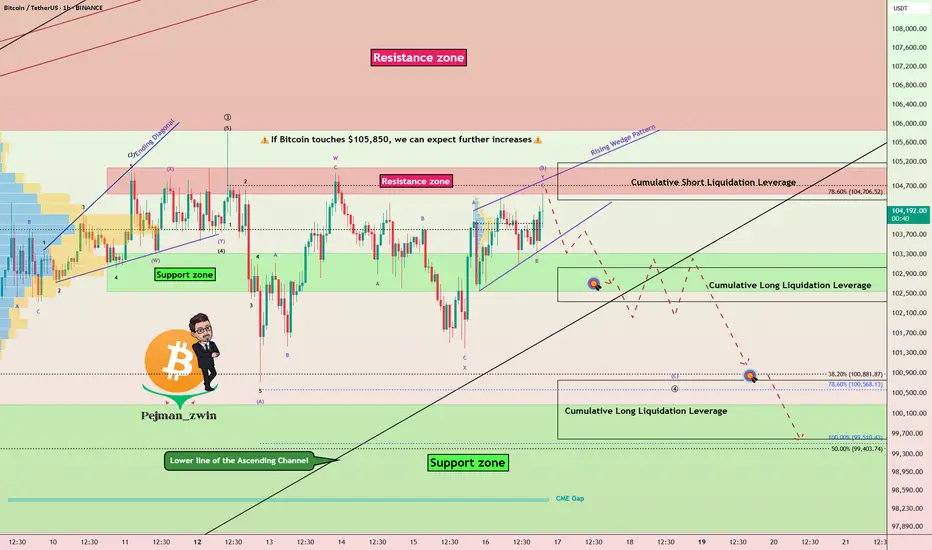
Bitcoin at Resistance With Weak Momentum-Bearish SetupBitcoin ( BINANCE:BTCUSDT ) finally reached the Resistance zone($105,100-$104,520) as I expected yesterday. Of course, the way Bitcoin reached the resistance zone was NOT with high momentum , so I decided to share this analysis with you.
In terms of Classic Technical Analysis , Bitcoin appears to have formed a Rising Wedge Reversal Pattern between Support zone($103,320-$102,600) and Resistance zone($105,100-$104,520) over the past few hours .
In terms of Elliott Wave theory , given Bitcoin’s low momentum and the Heavy Cumulative Short Liquidation Leverage($105,180-$104,412) ahead of Bitcoin, it appears that Bitcoin has completed microwave B of the main wave 4 with a Double Three Correction(WXY) .
I expect Bitcoin to decline to at least $102,800 at the first target AFTER breaking the lower line of the Rising Wedge Pattern, and if the Support zone($103,320-$102,600) and lower line of the ascending channel(Major) are broken, we should expect a drop to Cumulative Short Liquidation Leverage($100,763-$99,600) .
Note: If Bitcoin touches $105,850, we can expect further increases.
Please respect each other's ideas and express them politely if you agree or disagree.
Bitcoin Analyze (BTCUSDT), 1-hour time frame.
Be sure to follow the updated ideas.
Do not forget to put a Stop loss for your positions (For every position you want to open).
Please follow your strategy and updates; this is just my Idea, and I will gladly see your ideas in this post.
Please do not forget the ✅' like '✅ button 🙏😊 & Share it with your friends; thanks, and Trade safe.
Bitcoin Trajectory for Q1 and Q2 2025Hey everyone, it’s been a while! 👋
Let’s dive straight into the Bitcoin outlook and my vision for the months ahead. 🚀
Key Observations 📊
Patterns : Rounding Top & Bottom.
Rebound Levels:
Alt. 1: $101,000
Alt. 2: $82,000
Moving Averages : EMA50 & EMA188.
Target Area : $135,000+ 🔥
Pro Tip 💡
I'm setting an alert for the EMA188 cross on BTCUSDT to stay ahead of the game.
Stay tuned for more updates and insights! 💬

TradeCityPro | Bitcoin Daily Analysis #94👋 Welcome to TradeCity Pro!
Let’s go over the Bitcoin analysis and major crypto indexes. As usual, I’ll cover the New York futures session triggers for you.
⏳ 1-Hour Timeframe
As you can see, yesterday the price was rejected from the 104204 level and formed a lower high compared to 104800. Currently, there's a strong chance the short trigger will activate, so let’s review those triggers.
🔽 For a short position, the area where the price is currently consolidating—102882—is a suitable trigger. If this level breaks, the price could drop to 101628.
📊 One note about this trigger: the zone between 102882 and 101628 is a major support range. Every time the price has entered it, it’s formed long wicks and exited with strong bullish candles.
✨ So, if we enter a position based on this trigger, the volatility of the candles increases the chance of getting stopped out. On the other hand, using a large stop loss isn’t ideal either, since these trades go against the main trend and work better with a tight stop to hit the target faster.
💥 The next trigger is the break of 101628, which seems more reasonable. Breaking this level confirms a deeper correction and opens the path toward levels like 99225.
✔️ For a long position, if the price prints a higher low above 101628, we can confirm a bullish bias with the break of 104204. A higher low indicates strong bullish momentum, allowing us to use a slightly riskier trigger.
⚡️ However, if the price falls to the bottom of the box and then returns to the top, the main long trigger becomes a breakout above 104800.
🔍 Today, most of the market volume is on the sell side, and red candles are getting solid volume, so a correction to the box bottom seems likely. Either way, we have to wait for the triggers to activate.
👑 BTC.D Analysis
Bitcoin Dominance continues its bullish move after breaking the descending trendline. Yesterday, it printed a higher low and broke 63.30, reaching 63.61, and is now consolidating below that level.
🔔 If this level is broken too, we’ll have the first confirmation of a trend reversal in dominance. Full confirmation will come after BTC.D holds above 63.95.
📅 Total2 Analysis
Let’s move to Total2. Yesterday, the 1.19 trigger activated, and the price dropped to 1.17. The reaction to 1.18 wasn’t strong or clean, so I’ve adjusted the support level to 1.17.
📉 Today, we can open a short position if 1.17 is broken. For a long, if the price moves above 1.19, we can go long on altcoins that trigger accordingly.
📅 USDT.D Analysis
Now looking at Tether Dominance. Yesterday, it reacted to 4.70 and is now forming a higher low, heading back toward that level.
☘️ I see strong bullish momentum on the chart, and I believe the probability of breaking 4.70 is high. If it breaks, USDT.D could move up to 4.82.
❌ Disclaimer ❌
Trading futures is highly risky and dangerous. If you're not an expert, these triggers may not be suitable for you. You should first learn risk and capital management. You can also use the educational content from this channel.
Finally, these triggers reflect my personal opinions on price action, and the market may move completely against this analysis. So, do your own research before opening any position.
