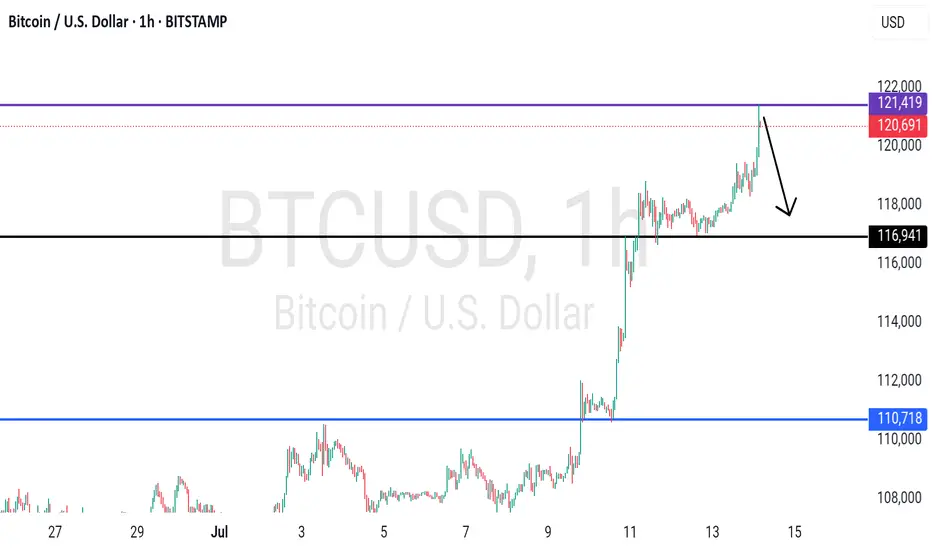
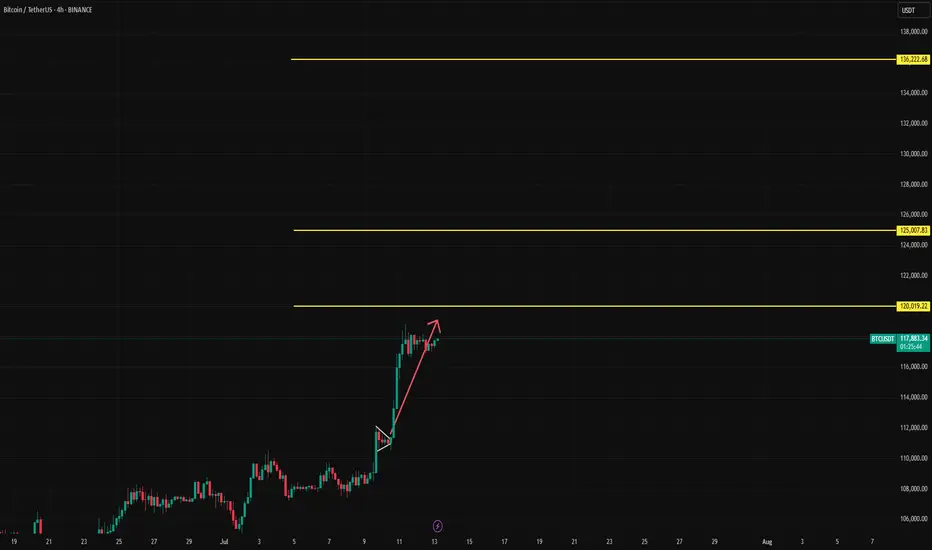
BTCUSDT - high placed? What's next??#BTCUSDT.. .A very reasonable high are placed so far.
That is around 120-121k
I'd market hold it in that case drop expected.
Good luck
Trade wisely
BTCUSDT
Bitcoin Crash? No! The Bullish Wave Starts Now! $155,601 Next!Some people are still expecting for "Bitcoin to go down." Poor bastards, the advance is just starting. Bitcoin just broke out of a 210 days long consolidation phase. After this huge, long-term consolidation, expect a major advance. Next target is now set at $155,601.
This week is the first week green after the consolidation finally ends. The market was sideways for seven months, with some fluctuations, and the result is a bullish breakout. Why a breakdown? Why expect a drop? If the market just broke up—think about it—why would it go down?
If resistance is confirmed; you remember the range between $100,000 and $110,000. If resistance is confirmed then Bitcoin would start crashing down from $110,000. If the break of $110,000 does happen and Bitcoin moves to $112,000 as a bull-trap, then you would expect a major crash happening from $112,000 and no more. But, reality is saying, showing, something much different. We have a major advance. Resistance has been flipped into support.
Now, the first that is needed is the weekly close. It is still very early into this move but Bitcoin is showing maximum strength. Remember the altcoins? These confirm that the advance is just new, early, because these are recovering from all-time lows or major lows. There is still plenty of room for growth.
My people, wake up! Bitcoin is going up.
The next target is $155,601 and it can go higher, this is only the mid-term target based on the long-term. When Bitcoin consolidates for 7 months, it tends to grow some 137% on average, it can be less but it can also be much more. And it tends to grow at least for 1-2 months, but this also is just the average, Bitcoin can grow straight up for 4 months.
So, are you still bearish?
Oh please no! The bulls already won.
The 2025 bull market final phase starts now, soon you will experience a marketwide bull-run. We have not seen the euphoria phase, this is only the start. Prepare for additional growth.
I am calling out all of the bears, never bet down on Bitcoin; Bitcoin is going up.
Namaste.

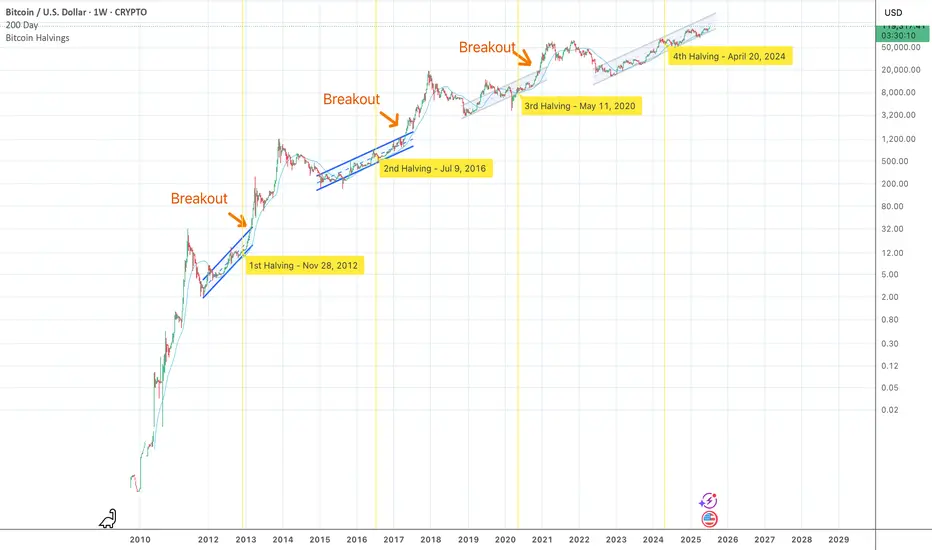
Bitcoin Still in Up-Trend Channel, Bubble Still AheadAs of July 2025 Bitcoin trades near $120 000 and every weekly close since the November 2022 low has stayed inside the same rising log-channel. The channel’s upper rail is ≈ $170 000 today and should reach ≈ $230 000 by December. A decisive breakout requires a weekly close above that rail. In previous cycles the breakout came almost exactly at the prior all-time high, but this time the 2021 ATH of $69 000 was reclaimed while price was still inside the channel. The trigger is therefore less obvious; yet if price finally closes beyond the rail, a new exponential leg is expected to begin.
Two structural shifts explain the delay. First, the channel’s slope keeps flattening: early cycles rose about 0.6 % per day on a log scale, now it is roughly 0.15 %. Second, each order-of-magnitude move demands vastly more capital, so the supply squeeze after the April 2024 halving is taking longer to translate into price.
At past tops growth multiples fell from 36× (2013) to 16× (2017) to 3.5× (2021). Extending that trend points to roughly 1.5–2× from the future breakout price. If the breakout happens near $170 000–230 000 the projected new ATH lands around $250 000–360 000, a range that lines up with the red-orange band on the updated Bitcoin Rainbow Chart.
Historically peaks follow a breakout by 9–13 months and the halving by 16–20 months, placing the most probable time window in Q4 2025. Until the weekly candle settles above the channel roof Bitcoin remains in accumulation mode and the classic blow-off phase is still ahead.
BTCUSDT Forming Strong BreakoutBTCUSDT is looking increasingly bullish as the pair continues to hold above its key support level, building a solid foundation for the next major leg up. The chart clearly shows a strong breakout pattern forming with higher highs and higher lows, signaling that the momentum is shifting in favor of the bulls. The well-defined support zone highlighted on the chart has repeatedly acted as a launchpad for buyers, making this area crucial for traders to watch closely. A breakout above the recent consolidation could open doors for a significant rally toward the 140% to 150% gain levels projected.
Volume for BTCUSDT remains robust, confirming the strong interest from both retail and institutional investors. This is a good sign because healthy volume typically precedes strong price action and follow-through. As Bitcoin continues to dominate the crypto market, it often sets the tone for the entire altcoin space, so a strong BTC rally could spark renewed optimism across the board. Traders are now keeping a close eye on whether BTC can maintain its position above the key psychological levels shown on the chart, as this could trigger another wave of buying momentum.
Investors are increasingly looking at BTCUSDT as a safe bet in an otherwise volatile market. Bitcoin’s fundamentals remain strong, with growing adoption, continued development, and macroeconomic conditions that could favor a hedge like BTC. Combined with the current technical setup, the outlook is promising for a big move to the upside. As we approach the next few weeks, the market sentiment suggests that any dips towards the key support level might be seen as attractive buying opportunities.
✅ Show your support by hitting the like button and
✅ Leaving a comment below! (What is You opinion about this Coin)
Your feedback and engagement keep me inspired to share more insightful market analysis with you!

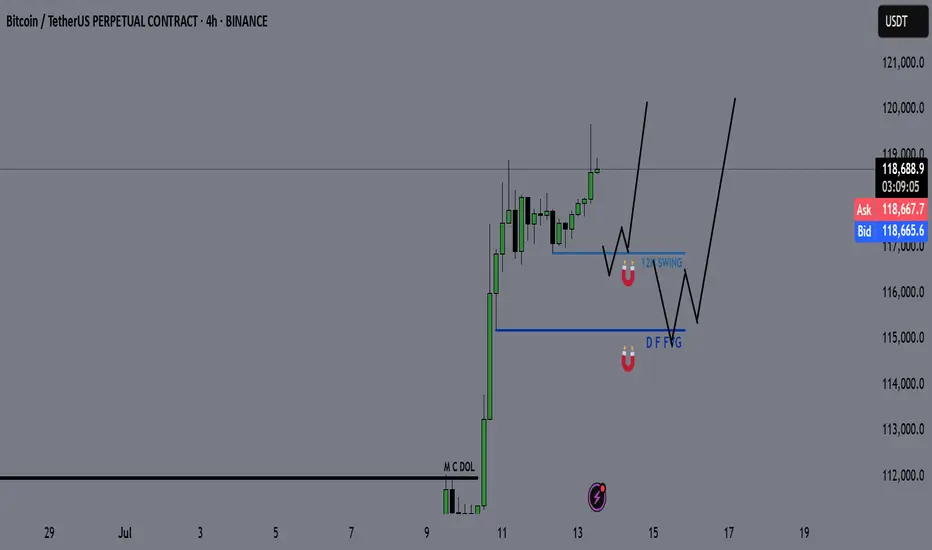
Bitcoin - BTC | Weekly Market Recap & Outlook 13.07.2025What Happened Last Week?
Bitcoin broke out of the recent downtrend structure and established a bullish leg with clear momentum.
The breakout was supported by volume and price structure, suggesting a trend reversal rather than a temporary deviation.
Weekly Bias and Strategy
The current outlook is bullish.
A retracement or sideways consolidation between the $120,000 and $114,000 zone is possible.
This zone may act as accumulation before further upside.
Key Points of Interest (POIs):
12H Swing Liquidity (turquoise line)
Daily FVG (blue line)
These levels will be monitored for long setups with confirmation on lower timeframes.
Macro Consideration – Fed Chairman Jerome Powell
Recent market speculation has increased regarding Jerome Powell potentially stepping down as Chair of the Federal Reserve.
If such a resignation is confirmed, it may act as a significant bullish catalyst for Bitcoin and other risk assets, possibly accelerating upside without allowing for any meaningful pullback.
Summary
• Bullish breakout confirmed
• Long bias maintained unless major invalidation occurs
• Watching retracement levels for entries
• Macro catalyst (Powell resignation) may trigger strong continuation without retrace
BTC/USD Heist Mode: Buy Low, Escape Rich🔓 BTC/USD Crypto Vault Breach: Thief Strategy for Long Entry Robbery (Swing/Day Setup) 🔓
🌟Hi! Hola! Ola! Bonjour! Hallo! Marhaba!🌟
Dear Money Makers & Robbers, 🤑💰💸✈️
🚨 Welcome to our next Thief Trading-style breakout mission — this time targeting the mighty BTC/USD vault. Using a fusion of technical precision and macro-level insight, we're charting a long entry blueprint for a profitable heist.
🔑 Entry Plan
"The vault is open!" 💥
Buy at current price or set Buy Limit near swing lows (15–30min timeframe pullback entries). We're timing the entry with stealth—precision over panic.
🛑 Stop Loss Setup
SL set near recent swing low (4H TF reference: ~104.000).
Adjust based on position sizing, risk appetite & multi-order tactics.
🎯 Take Profit Target
Targeting 115.000—or exit earlier if price action stalls. Get in, get out. Efficiency is the code.
👀 Scalpers' Notice
Only work the Long side. If your bag’s heavy, strike instantly. If light, ride with swing robbers. Use trailing SLs to protect your bag.
📈 Why We’re Bullish
Market momentum favors the bulls:
Overbought zones acting as lures
Bearish traps ready to flip
Key confluences from sentiment, COT, on-chain & macro analysis
➡️ Full supporting breakdown available 👉👉🔗🔗.
📢 Risk Note – Stay Sharp
Major news events = increased volatility ⚠️
Avoid entries during news. Trail stops to protect running profit. Rob smart.
💖 Boost the Crew
If this blueprint aligns with your mission, hit that Boost button. It fuels the team, and together, we profit like pros. One heist at a time. 💪🎉
🧠 Stay ready—next plan drops soon. Until then, rob safe, rob smart. 🐱👤
AIN/USDT : IS THIS THE COIN THAT WILL DO IT?? MOON SHOTAfter analyzing this coin, we’ve identified signals suggesting a potential breakout in the near future. As a result, we will continue monitoring it closely for confirmation.
Once confirmation is established, further updates will be provided below.
follow up the $0,30, expecting as first target

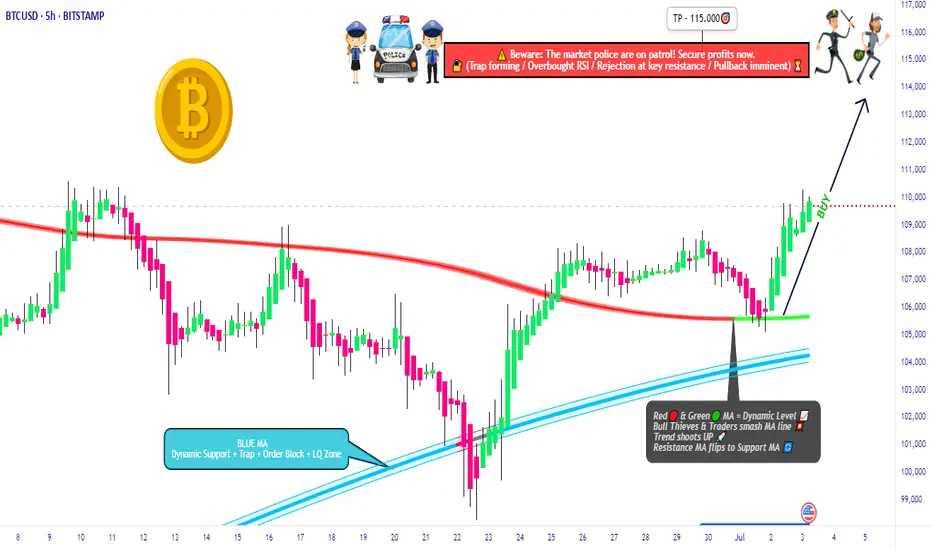
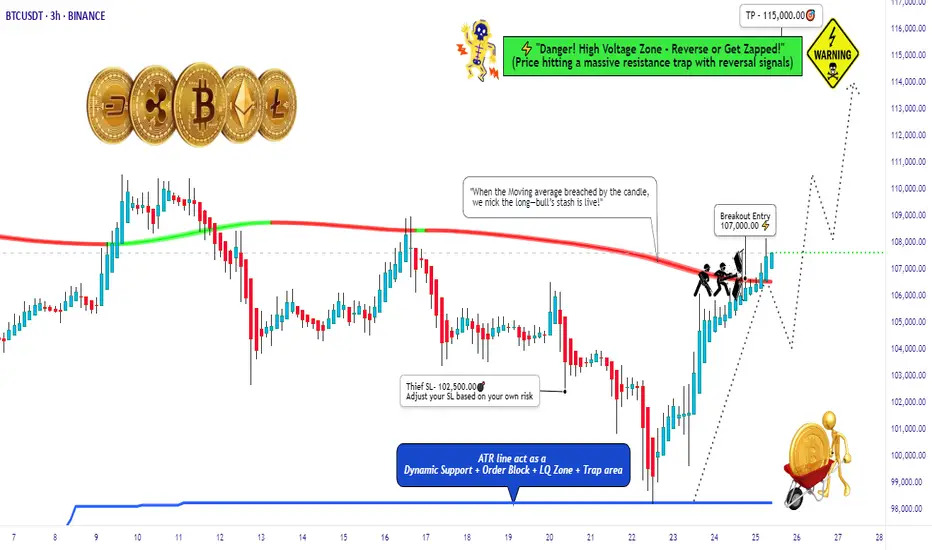
BTC/USD Thief Breakout at $107K – Eyeing $115K!🚨 Thief Entry Setup: BTC/USD Breakout Play 🚨
Overview:
Jump in after the $107 000 breakout—aiming for $115 000 with a tight “Thief SL” at $102 500. Adjust the stop‑loss to match your personal risk tolerance.
🧠 Setup Summary
Pair: BTC/USD
Entry trigger: Breakout above $107 000
Stop‑Loss: “Thief SL” at $102 500 (use your own risk‑based SL)
Target: $115 000
🎯 Why This Setup?
Clear breakout level at $107 000 = fresh momentum
Tight SL cushion (≈‑4.3%) = defined risk
Target ≈ +7.5% potential = strong reward-to-risk (~1.75:1)
📏 Risk Management Tips:
Only risk a small % of your capital—never exceed your comfort zone.
Move your SL to breakeven once mid‑target is hit to lock in profits.
Trailing your stop‑loss could secure bigger gains if BTC surges toward $115 000.
Bitcoin Roadmap=>End of RallyBitcoin ( BINANCE:BTCUSDT ) has gained nearly +10% in the recent weekly candle so far. The question is where this rally could end up. So to get to that zone, let’s go to the weekly timeframe .
Before we start this analysis, let’s take a look at my last analysis on the weekly timeframe , which was well into the Potential Reversal Zone(PRZ) . ( Analysis time: 9 JUN 2025 )
Bitcoin has now entered the Potential Reversal Zone(PRZ) and Time Reversal Zone(TRZ=June 23 to August 4) , and these zones could be the zones where this Bitcoin rally will end. Do you agree with me?
In terms of Elliott Wave theory , Bitcoin appears to be completing a main wave 5 , as the main wave 3 was an extended wave . The main wave 5 could end at the Potential Reversal Zone(PRZ) .
I expect Bitcoin to start a main correction from the Potential Reversal Zone(PRZ) and could continue to support lines and near the $105(at least) .
What do you think about the end of the Bitcoin rally?
Note: Sell orders near $120,000 are very heavy.
Note: Cumulative Long Liquidation Leverage attractive volume for liquidation.
Note: If Bitcoin goes above $130,000, it can continue to rise to the Resistance lines (near $150,000).
Please respect each other's ideas and express them politely if you agree or disagree.
Bitcoin Analyze (BTCUSDT), weekly time frame.
Be sure to follow the updated ideas.
Do not forget to put a Stop loss for your positions (For every position you want to open).
Please follow your strategy and updates; this is just my Idea, and I will gladly see your ideas in this post.
Please do not forget the ✅' like '✅ button 🙏😊 & Share it with your friends; thanks, and Trade safe.

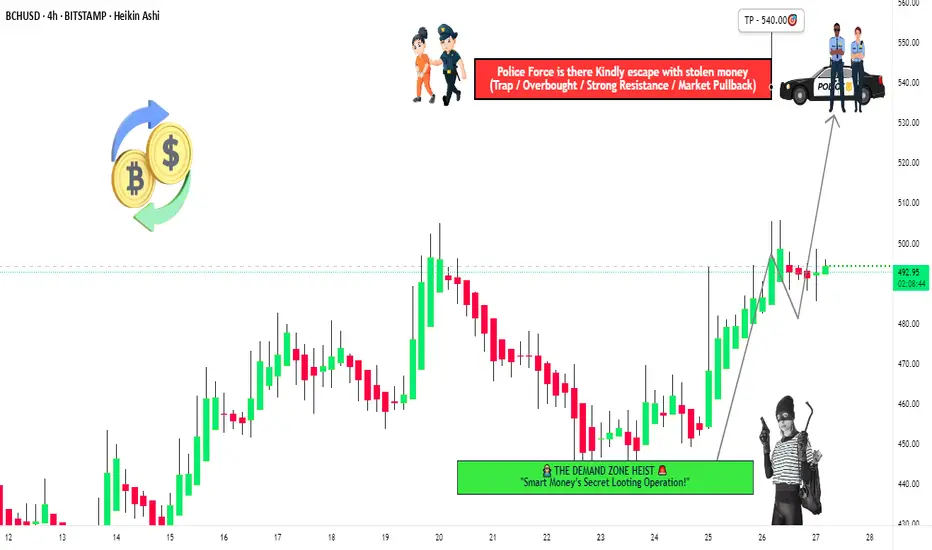
"BCH/USD Heist Mode: Enter Long, Exit Before Bears Strike!🚨 BCH/USD HEIST ALERT: Bullish Loot & Escape Plan! (Thief Trading Style) 🚨
🌟 Greetings, Market Bandits & Profit Pirates! 🌟
(Hola! Oi! Bonjour! Hallo! Marhaba!)
🔥 Mission Briefing:
Based on Thief Trading tactics (TA + FA), we’re plotting a bullish heist on BCH/USD. Time to swipe the loot & escape before the cops (bears) show up!
🔓 ENTRY: "The Vault is Open!"
📈 Buy Zone: Retest of recent low/high (15-30min timeframe).
💡 Pro Tip: Use limit orders for precision—don’t chase!
🛑 STOP LOSS: Live to Steal Another Day
📍 Thief SL: Recent swing low (~440.00 on 4H TF).
⚠️ Adjust based on your risk, lot size, & multi-order strategy.
🎯 TARGET: 540.00 (or Bail Early!)
🏴☠️ Escape before the red zone (overbought, reversal risk, bear traps!).
💰 "Take profit & treat yourself—you earned it!"
📢 WHY THIS HEIST? (Bullish Catalysts)
✅ Fundamentals: Strong macro + sentiment.
✅ Technicals: Pullback entry + bullish structure.
✅ Intermarket trends: Crypto momentum favors bulls.
(For full intel—COT reports, on-chain data, sentiment—check 👉🔗🔗!)
🚨 NEWS ALERT: Avoid the Police (Volatility Traps!)
🔹 Avoid new trades during high-impact news.
🔹 Trailing stops to lock profits & dodge reversals.
💥 BOOST THIS HEIST! (Let’s Get Rich Together!)
👍 Smash that "Like" & "Boost" button to fuel our next robbery!
🚀 Follow for daily heist plans—easy profits await!
See you at the next heist, bandits! 🤑💎
Are we on Super Bullish Express Highway ? Elliott Waves RoadmapHello friends,
Welcome to RK_Chaarts
Today we're attempting to analyze Bitcoin's chart, specifically the BTCUSD chart, from an Elliott Wave perspective. Looking at the monthly timeframe chart, which spans the entire lifetime of Bitcoin's data since 2011, we can see the overall structure. According to Elliott Wave theory, it appears that a large Super Cycle degree Wave (I) has completed, followed by a correction in the form of Super Cycle degree Wave (II), marked in blue.
Now, friends, it's possible that we're unfolding Super Cycle degree Wave (III), which should have five sub-divisions - in red I, II, III, IV, & V. We can see that we've completed red I & II, and red III has just started. If the low we marked in red II doesn't get breached on the lower side, it can be considered our invalidation level.
Next, within red III, we should see five primary degree sub-divisions in black - ((1)), ((2)), ((3)), ((4)) & ((5)). We can see that we've completed black ((1)) & ((2)) and black ((3)) has just started. Within black ((3)), we should see five intermediate degree sub-divisions in blue - (1) to (5). Blue (1) has just started, and within blue one, we've already seen red 1 & 2 completed, and red 3 is in progress.
So, we're currently in a super bullish scenario, a third of a third of a third. Yes, the chart looks extremely bullish. We won't commit to any targets here as this is for educational purposes only. The analysis suggests potential targets could be very high, above $150,000 or $200,000, if the invalidation level of $98,240 isn't breached. But again, friends, this video is shared for educational purposes only.
Many people think that the market doesn't move according to Elliott Waves. But friends, here we've tried to analyze from the monthly time frame to the overly time frame. We've definitely aligned the multi-time frame and also aligned it with the principal rules of Elliott Waves, without violating any of its rules.
I agree that the Elliott Wave theory can be a bit difficult, and for those who don't practice it deeply, it can be challenging. But yes, the market moves according to this methodology, following this pattern. This is a significant achievement.
I am not Sebi registered analyst.
My studies are for educational purpose only.
Please Consult your financial advisor before trading or investing.
I am not responsible for any kinds of your profits and your losses.
Most investors treat trading as a hobby because they have a full-time job doing something else.
However, If you treat trading like a business, it will pay you like a business.
If you treat like a hobby, hobbies don't pay, they cost you...!
Hope this post is helpful to community
Thanks
RK💕
Disclaimer and Risk Warning.
The analysis and discussion provided on in.tradingview.com is intended for educational purposes only and should not be relied upon for trading decisions. RK_Chaarts is not an investment adviser and the information provided here should not be taken as professional investment advice. Before buying or selling any investments, securities, or precious metals, it is recommended that you conduct your own due diligence. RK_Chaarts does not share in your profits and will not take responsibility for any losses you may incur. So Please Consult your financial advisor before trading or investing.

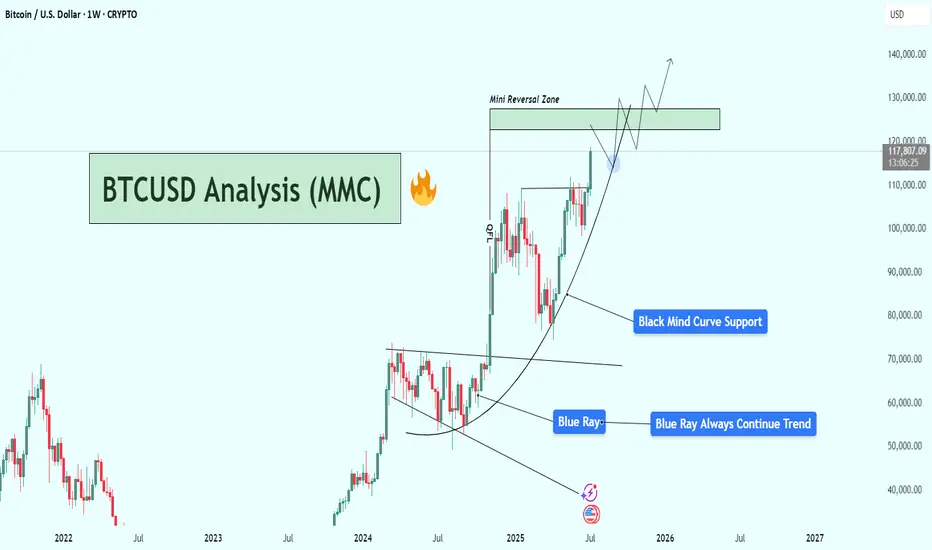
BTCUSD Weekly Analysis : Testing $130K Resistance + Next Target📌 1. Big Picture – Bitcoin is in a Parabolic Uptrend
This chart clearly shows that Bitcoin has shifted from a consolidation phase into a full-blown parabolic rally. That’s not just random growth — it’s an aggressive, momentum-driven market move that usually only happens during major bull cycles.
The curve shown in black — labeled “Black Mind Curve Support” — is your guide here. It's not a simple trendline. It shows how Bitcoin is accelerating upward, and this curve acts as a dynamic support. Every time price dips to it, buyers jump in fast — which shows strong bullish pressure and market confidence.
🔍 2. Blue Ray Broken = Trend Change Confirmed
Earlier, BTC was stuck under the Blue Ray, a long-term resistance trendline. As marked:
“Blue Ray Always Continue Trend”
That means, as long as price stays under it, the market is bearish. But guess what?
BTC broke above it — strongly.
That break confirmed a reversal in long-term structure, and it triggered this massive upward move. This breakout also aligned with a pattern of higher highs and higher lows, further confirming that bulls are now in full control.
🧠 3. Current Situation – Heading Into Mini Reversal Zone
Now BTC is trading around $117,820, and it's approaching the green box labeled Mini Reversal Zone — between $125,000 and $135,000.
Why is this area important?
It’s a psychological zone (big round numbers).
It lines up with historical resistance and previous supply zones.
It’s where smart money might take some profit, so we could see rejection or a short-term pullback here.
🎯 4. Two Scenarios to Watch
✅ Scenario A: Mini Pullback & Retest
BTC hits the Mini Reversal Zone → stalls → pulls back → retests the Black Mind Curve → bounces again.
That’s bullish and normal in a healthy uptrend. If you missed earlier entries, this pullback could be your golden opportunity.
🚀 Scenario B: Breakout of Reversal Zone
If Bitcoin breaks above $135K with strong momentum and closes the weekly candle high, we may see another parabolic rally toward $140K+.
This would mean even stronger buyer interest, possibly driven by FOMO, ETFs, or macro news.
📉 What Could Invalidate the Bullish Move?
Only if BTC:
Breaks below the Black Mind Curve, and
Starts closing weekly candles under $105K–$100K
That would mean the curve is broken, momentum is lost, and we might go into a consolidation or deeper correction.
But for now? No signs of weakness. Trend is strong, volume is rising, and price action is clean.
🧩 Summary of Key Levels
Type Level Notes
Curve Support Dynamic ($105K–$110K) Critical for trend continuation
Mini Reversal Zone $125K – $135K Watch for rejection or breakout
Bullish Target $140K+ If breakout holds above reversal zone
Trend Indicator Black Mind Curve As long as price rides this, bulls are in control
📌 Final Thoughts
This BTC chart isn’t just a random uptrend — it’s a well-structured parabola, powered by strong technical support and clean breakouts. Everything is lining up for a potential monster move, but don’t chase price blindly.
Watch the Mini Reversal Zone closely. If we see rejection, be ready to buy the dip. If we break through with volume — it’s 🚀 time again.
Weekly Close Watch: Bitcoin’s Key Level Could Shift the ChartsGood morning, Guys
There's only 1 day and 13 hours left until the weekly Bitcoin candle closes.
It's crucial that this candle closes above the 112,331 level with strong volume. Anyone experienced in economics and technical analysis knows just how significant this is.
If we get that close above the level, I’ll share a powerful analysis with a clear target.
I want to sincerely thank everyone who’s been supporting my analyses with likes—your support is
my biggest source of motivation when it comes to sharing content.
Much love to you all—we’re more than just a community, we’re a family. 💛

BTCUSD LONG TERMBTCUSD Live Trading Session/ BTCUSD analysis #forex #forextraining #forex
Hello Traders
In This Video BTCUSD HOURLY Forecast By World of Forex
today BTCUSD Analysis
This Video includes_ (BTCUSD market update)
BTCUSD Analysis today | Technical and Order Flow
#usdjpy #usdchftechnicalanalysis #usdjpytoday #gold
What is The Next Opportunity on BTCUSD Market
how to Enter to the Valid Entry With Assurance Profit?
This Video is For Trader's that Want to Improve Their Technical Analysis Skills and Their Trading By Understanding How To Analyze The Market Using Multiple Timeframes and Understanding The Bigger Picture on the Charts.
Disclaimer: Financial Trading Has Large Potential Rewards, But Also Large Potential Risk. You must be aware of the Risk and Be Welling to Accept Them in order to Trade the Financial Market . Please be Carefully With Your Money.
We are talking about future market, anything can Happen,Markets are Always like that.dnt Risky more Than 2% of your account
Now you can join with our "vip premium" service
Join us and let's make trading together

BTC crash to 50kLooks like the top is in!
This should propagate into a nice bear run.
Crypto community got BTC to 100,000$
That’s the PUMP
Then the ETF opens the flood gates for corrupt / corporate money supply… that’s the DUMP signal!
Take their money and run!
Where to? Maybe the park… I’m gonna run my DOGE!

BTCUSDTHello Traders! 👋
What are your thoughts on BITCOIN?
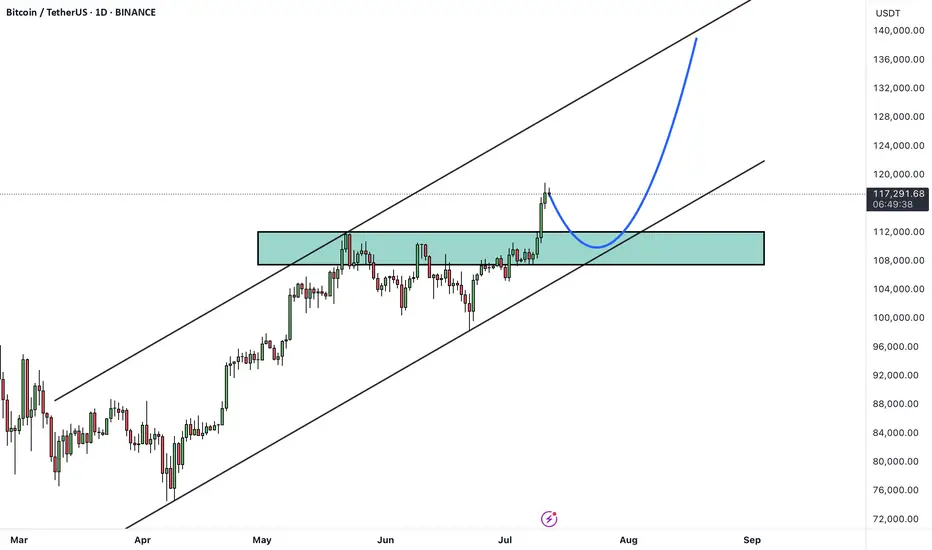
Bitcoin has recently broken above its all-time high and printed a new record high, signaling strong bullish momentum. Currently, the market has entered a consolidation phase, which is typical after such a major breakout.
A pullback toward the previous breakout level (the old all-time high) is expected, which now acts as new support.
After this consolidation and pullback, the price could resume its bullish trajectory and move toward higher targets, including the upper boundary of the current bullish channel.
As long as the price remains above the key support zone, the overall trend remains bullish and any dip could be seen as a buying opportunity within the broader uptrend.
Will this consolidation lead to the next leg up, or is a deeper correction ahead? Share your thoughts below! 🤔👇
Don’t forget to like and share your thoughts in the comments! ❤️
#BTC/USDT Bitcoin Recovers Above 108,000 $#BTC
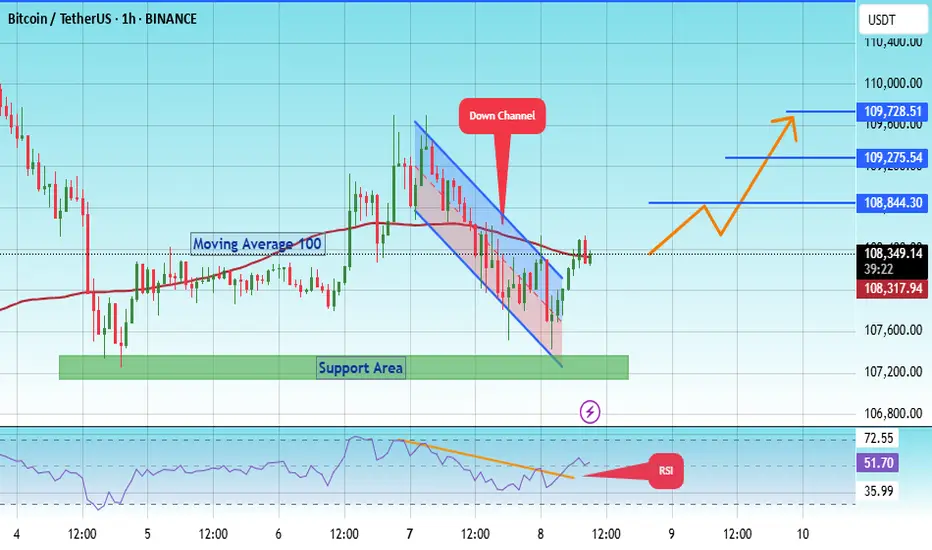
The price is moving within a descending channel on the 1-hour frame, adhering well to it, and is on its way to breaking it strongly upwards and retesting it.
We are seeing a bounce from the lower boundary of the descending channel. This support is at 107600.
We have a downtrend on the RSI indicator that is about to break and retest, supporting the upside.
There is a major support area in green at 107217, which represents a strong basis for the upside.
Don't forget a simple thing: ease and capital.
When you reach the first target, save some money and then change your stop-loss order to an entry order.
For inquiries, please leave a comment.
We are looking to hold above the Moving Average 100.
Entry price: 108337.
First target: 108844.
Second target: 109275.
Third target: 109728.
Don't forget a simple thing: ease and capital.
When you reach the first target, save some money and then change your stop-loss order to an entry order.
For inquiries, please leave a comment.
Thank you.
bitcoin - Time to buy again!As I mentioned, the price has started the third bullish wave and has shown good growth so far, with the bullish wave still ongoing. In my opinion, the price could rise to $127k, after which it may correct to form the fourth corrective wave.
previous analysis

Projected price targets for BitcoinAs long as the $108,400 level holds, the current market outlook remains bullish

#BTCUSDT(BITCOIN): Two Targets First $130,000 And Then $150,000Bitcoin is poised for significant distribution, with a potential price surge to $130,000, followed by a swing target of $150,000. The current accumulation phase is poised to transition into a substantial bullish move. We anticipate a surge in bullish volume in the coming days or weeks. Our analysis anticipates this transition to be completed by the end of the year or sooner.
It is important to note that this analysis does not guarantee a specific price movement and is provided solely for educational purposes.
We extend our best wishes for your successful trading endeavours. If our analysis has been of assistance, we would appreciate it if you could express your gratitude by liking and commenting.
For further insights, please follow our account.
Team Setupsfx_

#BTCUSDT: Major Bearish Correction?Bitcoin is currently undergoing a correction following its recent peak. While the initial price decline appeared insignificant, it has since experienced a substantial drop, suggesting a substantial volume of selling activity in the market.
We anticipate two potential areas where the price could reverse and resume its upward trajectory. These areas could lead to a price of 110,000, followed by 120,000, and ultimately reaching 150,000.
We strongly recommend that you implement rigorous risk management measures and conduct your own analysis before making any investment decisions.
Best regards,
Team Setupsfx_

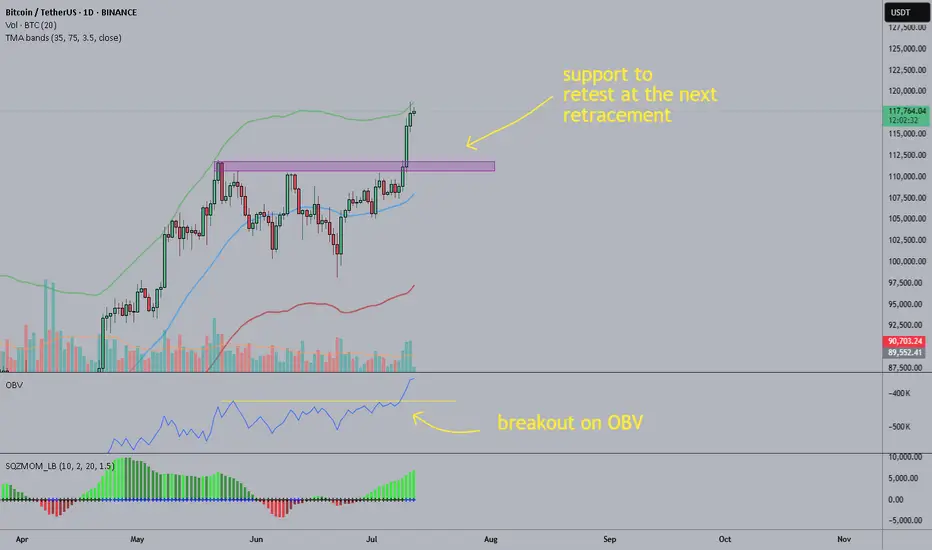
BTC: the breakout should be legitAs you can see the breakout had 3 days of rising volume and OBV also broke out so it should bne legit. On daily the upper band of the TMA bands is being tested, probably soon we'll see a retracement, I suppose the former resistance is now the support to test, however if the euphory continues we could see another peak of the price while RSI stays below the "overbought zone".
I'd look at opportunities to short although I usually don't trade BTC, I use it mostly as indicator on when to buy alts.
Good luck