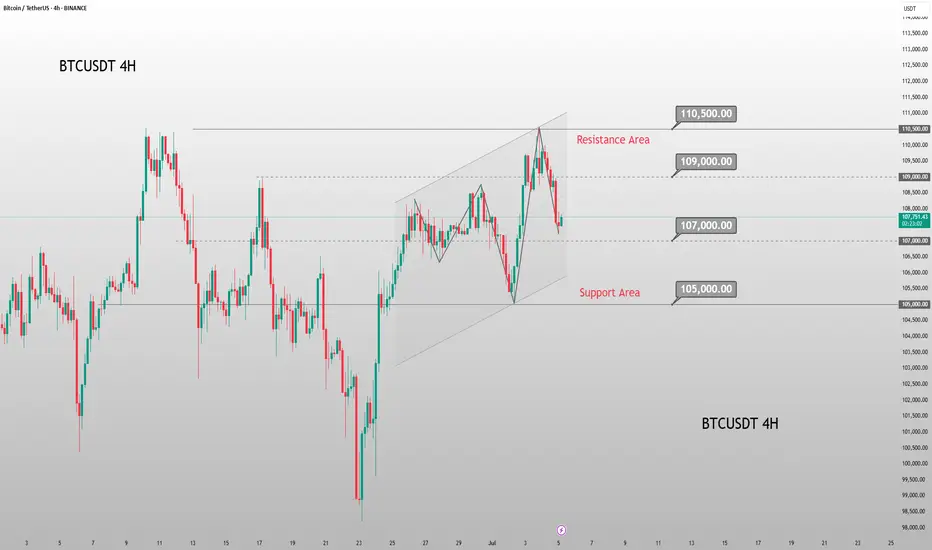
Evening BTC Trend Analysis and Trading SuggestionsLet's review this afternoon's market performance. The BTC price, as we anticipated, rebounded to around 109,000 in the afternoon before plummeting sharply. Living up to "Black Friday", this violent drop was well within our expectations. In the afternoon's live trading, we also reminded everyone that as long as there was a rebound to the upper zone, it was a good opportunity to go short. This drop has created a space of nearly 1,500 points. Currently, the BTC price has pulled back to around 107,800.
From the current 4-hour K-line chart, after a strong upward surge, the market encountered significant resistance near the upper track of the Bollinger Bands. As bullish momentum gradually faded, the price started to come under pressure and decline, suggesting that the short-term upward trend may come to a temporary halt. At present, the market has recorded multiple consecutive candlesticks with large bearish bodies. The price has not only effectively broken below the key support level of the Bollinger Bands' middle track but also caused the Bollinger Bands channel to switch from expanding to narrowing, indicating that market volatility is decreasing. In terms of trading volume, it showed a moderate increase during the price pullback, which further confirms the authenticity of the bearish selling pressure.
BTCUSD
sell@108000-1085000
tp:107000-106000
Investment itself is not the source of risk; it is only when investment behavior escapes rational control that risks lie in wait. In the trading process, always bear in mind that restraining impulsiveness is the primary criterion for success. I share trading signals daily, and all signals have been accurate without error for a full month. Regardless of your past profits or losses, with my assistance, you have the hope to achieve a breakthrough in your investment.
Btcusdt4h
Bitcoin still has strong supportThe RSI index is in a neutral-to-strong zone but has retreated from earlier levels, indicating that short-term upward momentum has weakened. The MACD indicator still maintains a bullish pattern, though the height of the bars has decreased. The price remains well above both the 50-day and 200-day moving averages, with the medium-to-long-term upward channel intact, keeping the overall structure in a strong bull market. However, there are signs of a potential short-term pullback.👉👉👉
On the daily chart, the Bitcoin price remains above the long-term trend breakout point since April. The 20-day moving average is at $103,260, forming a direct resistance level, while the 50-day moving average at $101,904 coincides with a key support level. As long as the Bitcoin price stays above this dynamic range, bulls still have opportunities.
In view of the current market conditions, short-term trading is recommended for investors to closely monitor the breakthrough of key support and resistance levels. If the price pulls back to the $100,000-$101,000 range and finds support, while forming daily K-line doji or long lower shadow patterns, appropriate position increases can be considered, with targets set at $105,000. After a breakthrough, the target can be further adjusted to $110,000. At the same time, due to market uncertainties and short-term pullback risks, investors should control their position sizes and avoid excessive leverage and blind chasing of gains or panic selling.
BTCUSD Trading Strategy
buy @ 102500-102700
sl 101000
tp 103800-104000
If you think the analysis helpful, you can give a thumbs-up to show your support. If you have different opinions, you can leave your thoughts in the comments. Thank you for reading!👉👉👉

Bitcoin remains in high-level fluctuationsThe price of Bitcoin has generally remained above $103,000 today, demonstrating strong support. In the short term, after experiencing previous fluctuations, Bitcoin is currently in a relatively stable upward trend and continues to move towards higher prices.👉👉👉
Global economic events have contributed to the rise of Bitcoin. The decision between China and the U.S. to temporarily reduce tariffs has improved investor confidence and encouraged market risk appetite, making funds more willing to flow into risky assets like Bitcoin.
From a technical perspective, Bitcoin is in a strong upward trend. The RSI is above 70, indicating that Bitcoin may be in an overbought state in the short term. This could lead to a slight pullback or sideways consolidation in the upcoming market to digest excessive buying pressure. Investors need to pay attention to potential pullback risks, while closely monitoring factors such as macroeconomic data, policy changes, and market capital flows to adjust investment strategies in a timely manner.
BTCUSD Trading Strategy
buy @ 102700-103000
sl 101000
tp 104000-104200
If you think the analysis helpful, you can give a thumbs-up to show your support. If you have different opinions, you can leave your thoughts in the comments. Thank you for reading!👉👉👉

BTC/USDT BinanceBTC/USDT Binance
4H hollow candlesticks
After a price rise of +25%, a Fibonacci channel has formed, combined with an Ascending triangle.
As there are also new Support & Resistance points.
From here, we can conclude the following:
At the end of the Ascending triangle, there will be a price break out.
The price must break the golden ratio of the Fibonacci channel so that moves to higher levels.
We can see a hypothetical price future move from a repeated previous move (Bar Pattern / Fractal) from early November 2023.
It is worth noting that the volume has increased significantly.
Market Cap: $1.65T -0.04%
24h Vol: $45.94B -7.70%
Dominance:
BTC: 52.3%
ETH: 16.3%
Good Luck
#CryptoHellas Team

BTC/USDT BinanceBTC/USDT Binance
4H hollow candlesticks
Since mid-March, a sideways movement continues between $25860 and $31000 as an All-Time High (ATH).
In the present phase, a symmetrical triangle has been formed, where a price breakout is expected soon.
The Support area occurs from the extension of the golden ratio of the last Fibonacci retracement.
The Resistance area occurs, if we reverse the golden ratio of extension of the Fibonacci retracement starting from 15/03/2023.
Another conclusion, is that the price is expected to fluctuate within the Descending triangle that has been formed since 06/05/2023, until the price breakout occurs.
Finally, a hypothetical scenario is that the price may follow the slightly resized footprint (Bar Pattern), of a previous price movement (fractal).
Bitcoin (BTC) = $26,928.54 -0.54% (1d)
Market Cap: $1,126,847,982,844
24h Vol: $30,866,809,616
Dominance:
BTC: 46.3%
ETH: 19.4%
Good Luck
#CryptoHellas Team

BTC confluence area.last swing up was quite steep id say, so im looking at 0.5 fibo retracement spot.
the good thing is, that the same level covers a little bit more things
1. previous 4H tops
2. 50 and 200 emas
3. RSI hidden divergence
let me know if u see something else to add.
price still can retrace from where it is curently.
buy now and at 22000
SL 21300
lev 1-2x
TPs in previous post.
LETS DO IT!
