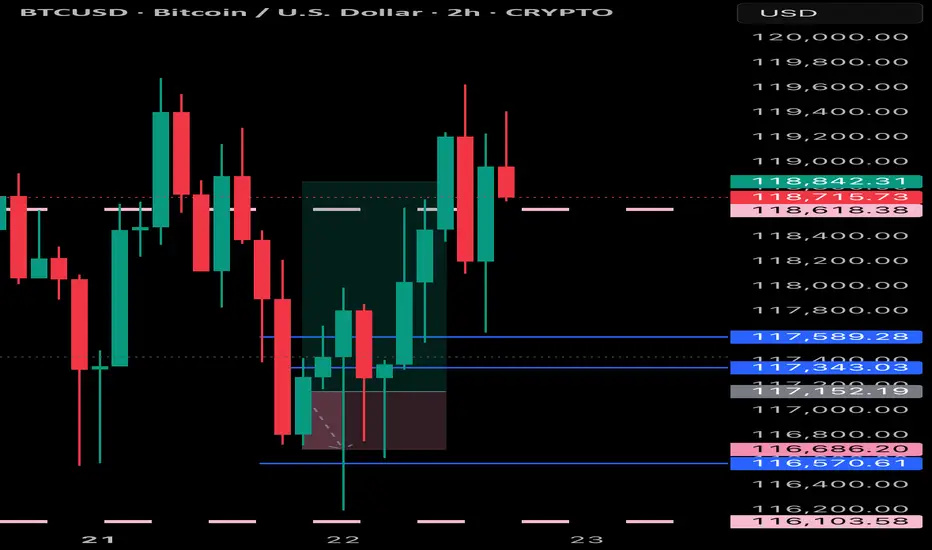
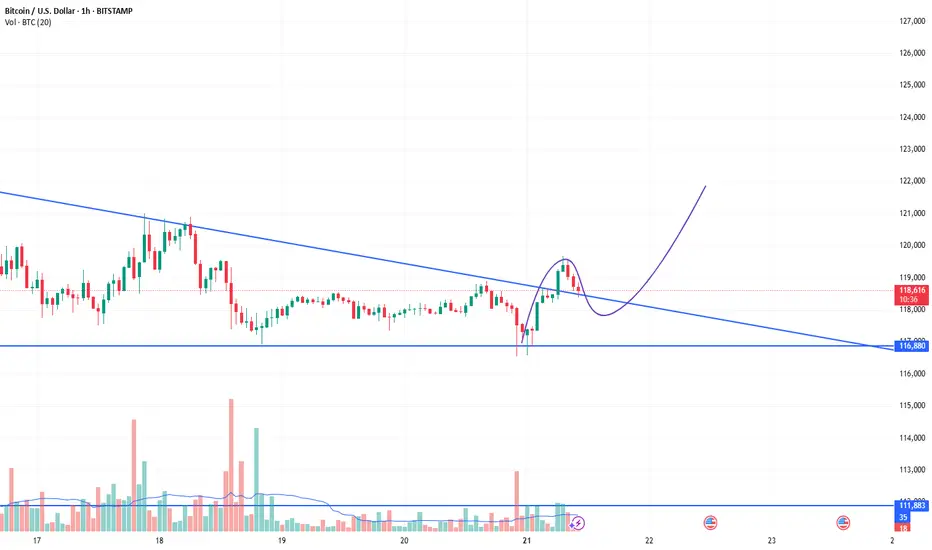
BTCUSD DROPPED BELOW LOCAL SUPPORTBTCUSD DROPPED BELOW LOCAL SUPPORT📉
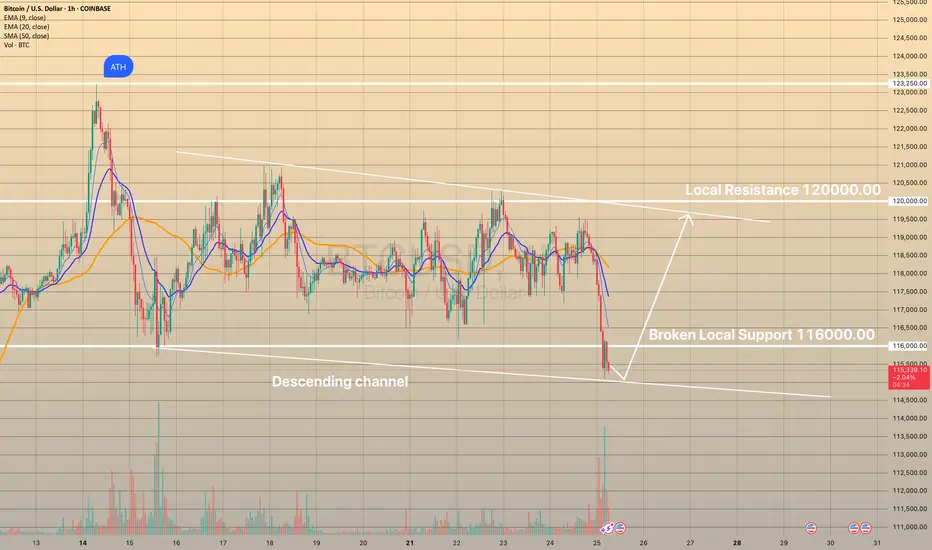
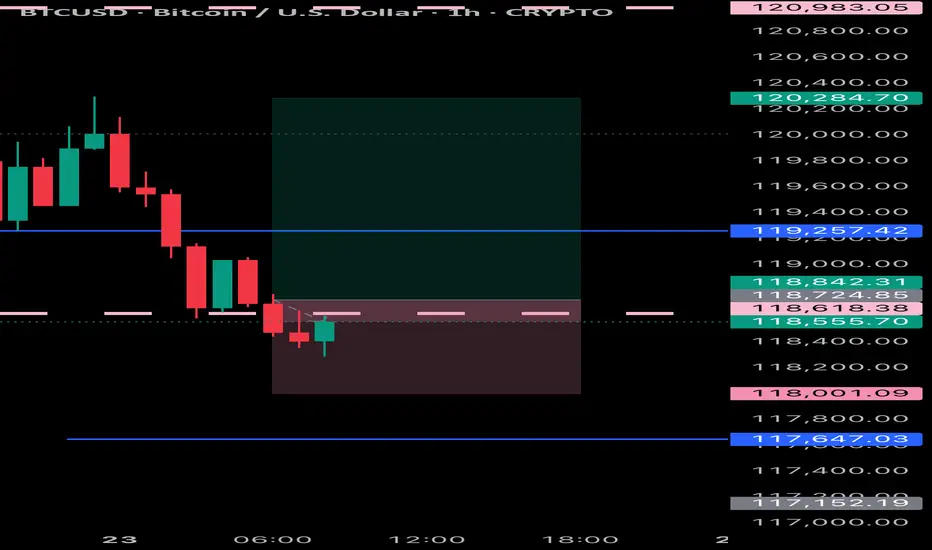
Today bitcoin dropped below the level of 116,000.00 on high volume. However, the price didn't go somewhere far downwards and consolidates slightly below this level. Presumably, descending channel may be formed.
What is a descending channel?
A descending channel is a bearish chart pattern formed by two downward-sloping parallel trendlines connecting lower highs and lower lows in a pair’s price, indicating a consistent downtrend. It shows sellers are in control, with prices declining within a defined range.
Here I presume the price to rebound from lower border of the descending channel with possible movement towards upper border slightly below the 120,000.00 level.
Btcusdtanalysis
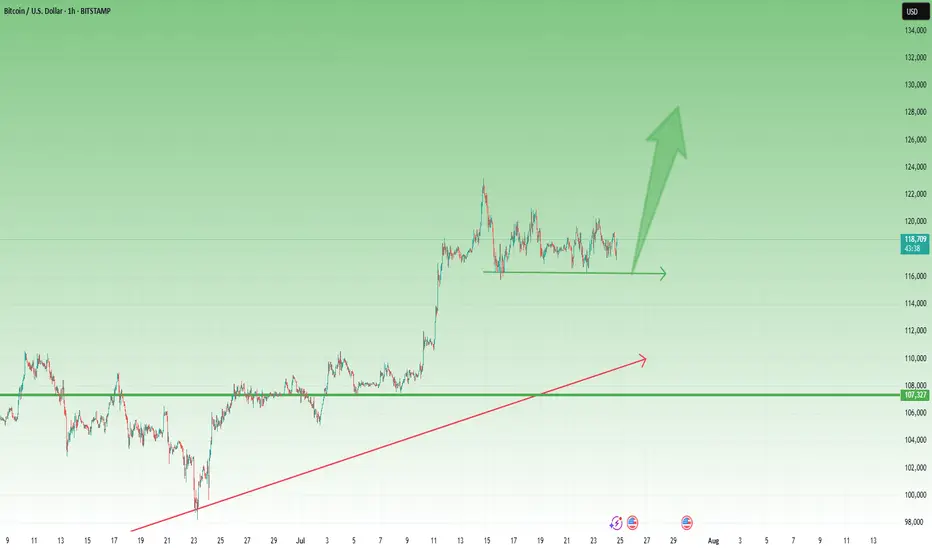
BTCUSD BUYING can expect a bullish move from bitcoin as it has dropped a fair amount and can extract a reversal to the up side due to being oversold
BTCUSD Daily Analysis – Golden Pocket Hold Before a Bullish?🧠 Chart Description & Market Structure:
The BTCUSD daily chart is showing a consolidation phase after forming a local high near $123,231. Currently, the price is retracing and approaching a key Fibonacci retracement zone between the 0.5 level ($115,557) and 0.618 level ($113,740) — also known as the Golden Pocket, which is often a strong reversal area.
---
📈 Bullish Scenario:
If the price holds within or just above the 0.5–0.618 Fibonacci zone (highlighted in yellow) and forms a bullish reversal candlestick (like a hammer, bullish engulfing, or pin bar), there’s a high probability for BTC to resume its uptrend.
Bullish upside targets include:
$119,842 as minor resistance.
$123,231 as the previous swing high and a key breakout confirmation.
A successful break above $123,231 could send BTC toward the next major targets around $128K–$132K.
---
📉 Bearish Scenario:
If the price fails to hold the 0.618 Fibonacci level ($113,740) and breaks down below the key psychological support at $111,500, a deeper correction may occur.
Downside targets:
$108K–$106K as the next major support zone.
A break below this could lead to the formation of a lower high structure and potentially trigger a bearish continuation.
---
📊 Pattern Observations:
Potential Bullish Flag or Rectangle Consolidation: The price action suggests horizontal consolidation after a strong rally — possibly a re-accumulation zone before a bullish continuation.
Golden Pocket Retest: Price is currently testing the Fibonacci 0.5–0.618 zone, often targeted by institutional buyers and technical traders as a potential entry point.
---
🧭 Key Levels to Watch:
Major Resistance: $123,231 (swing high)
Minor Resistance: $119,842
Fibonacci 0.5: $115,557
Fibonacci 0.618: $113,740
Key Support: $111,500
---
🔖 Conclusion:
BTC is currently in a decision zone. Price action within the $115,500–$113,700 range will be crucial. Will this be a healthy retracement before the next leg up — or the beginning of a deeper correction?
#BTCUSD #BitcoinAnalysis #CryptoTA #FibonacciRetracement #CryptoChart #BitcoinDaily #BullishSetup #BearishSetup #CryptoMarket

BTCUSDT eyeing 125k next after bounce from 116k zoneEarlier I shared the high time frame view of #BTCUSDT. We know that its heading higher and that helps in holding spot positions.
However, the move to the high frame target will not happen in a straight line, instead with various push to the upside and then subsequent corrections to the down side.
Therefore, as a trader, we must profit from those movements as we see some good high probability setups.
And there is one right now which is a long position.
The price broke 4h support 4HS1, but quickly reclaimed it. That is a sign of demand and strength required to move higher.
Therefore, this presents a long opportunity where the target of this long position should be 125k.
As the price enters into 4HS1 zone, I will scale into long position.
It is quite likely that the price will bounce hard once it taps into 4HS1 zone.
I am talking this long position targeting 125k. What about you? Share with me what you think.
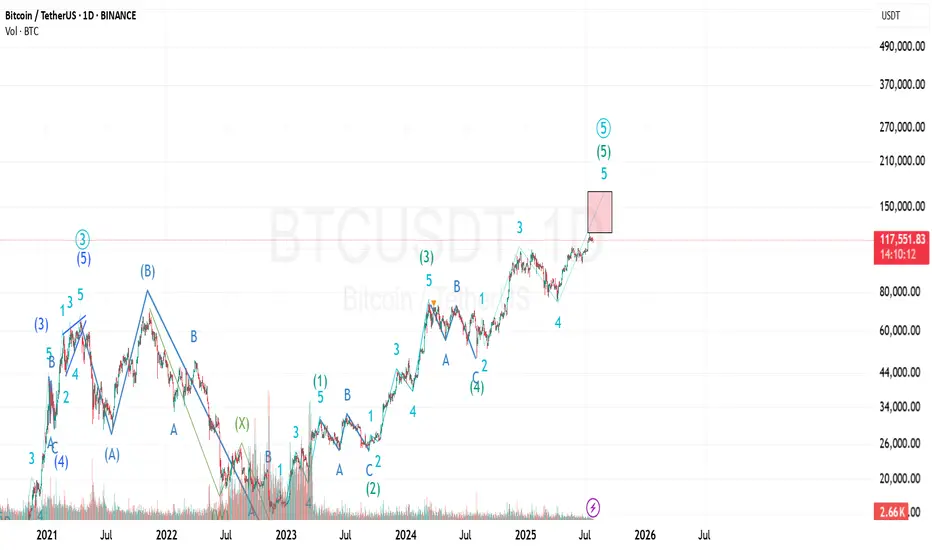
Bitcoin Prediction UpdateI've just modified the wave count and still the previous analysis is valid...
I'm not sure about the target of the last wave (the 5th of 5th wave) because it can be an extended wave...
The shown box is where I'll investigate to find any ending pattern...
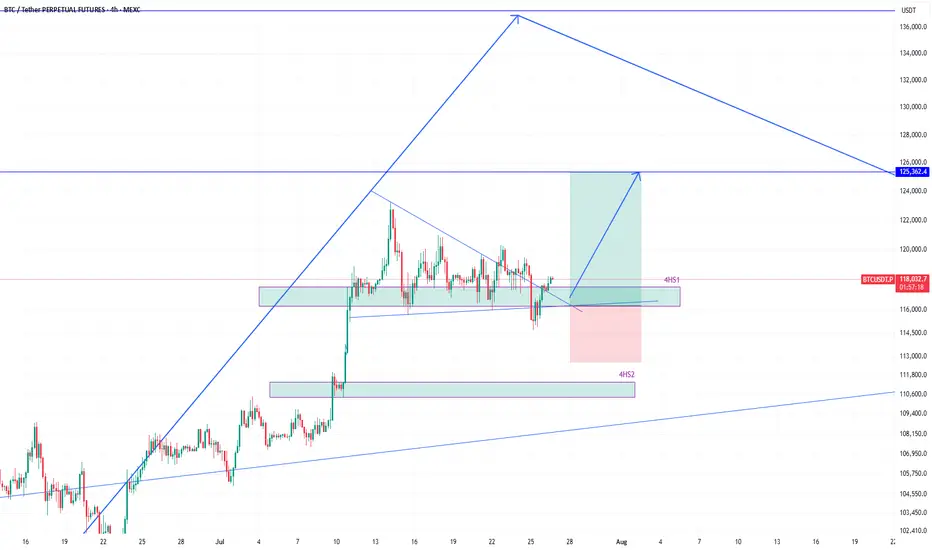
BTCUSDT ready to march towards 140k zoneHere is once again a view of what I had shared when BTCUSDT was trading around 95k in may 2025.
The price action has been similar to our expectation. A push towards 106k-110k and then drop around 95k-98k before boucing towards 137k.
So the next stop for the current upward move is 137k. The push from 98k has brought us into 120k zone and currently we were holding in that range from 114k-120k for a while.
However, this is going to change now. I believe the last drop towards 114k was a false breakdown from 4h support 4HS1 since the price quickly grabbed this region again by moving towards 117k.
I believe the path to 137k-144k is clear now and we see that in coming weeks. After that we shall likely see a correction towards 120k area before move to the target around 150k.
Lets see how the price moves. We will keep monitoring it time to time and I will provide updates. But till now it has been moving according to the plan.
#BTC #BTCUSD #BTCUSDT #BITCOIN #CRYPTO CRYPTOCAP:BTC $crypto

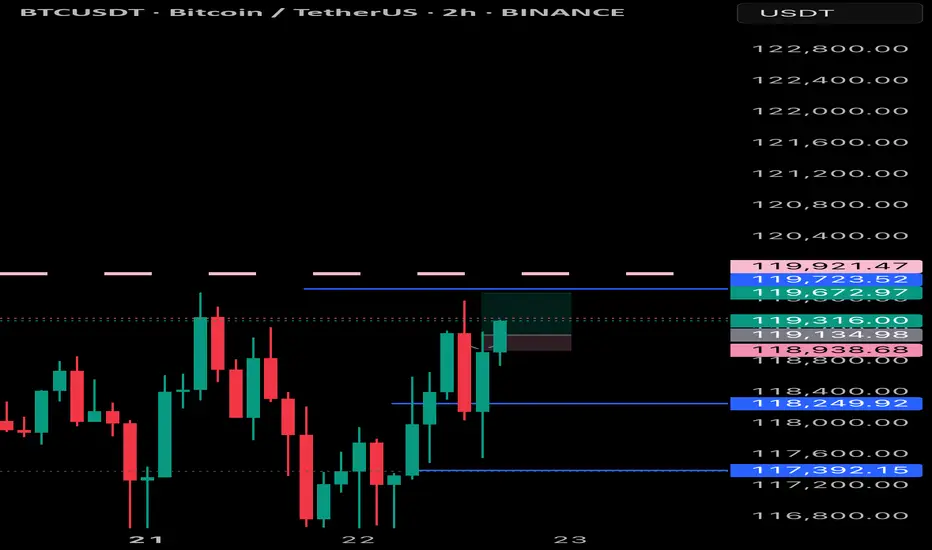
BTC/USDT 2H Chart – Updated Bullish Continuation SetupChart Overview: Bitcoin (BTC) continues to show signs of bullish momentum after consolidating within a wedge pattern. The breakout appears more confirmed now, with price holding above the local trendline and forming higher lows.
Key Technical Points:
Pattern: Bullish breakout from descending wedge
Support Zone: Strong demand between 116,000 – 117,000 USDT (highlighted in yellow)
Current Price: ~119,100 USDT
Breakout Confirmation: Retest of breakout area appears successful
Targets:
TP1: 123,075 – 123,341 USDT (intermediate resistance zone)
TP2: 127,465 – 127,642 USDT (final target zone from the wedge breakout projection)

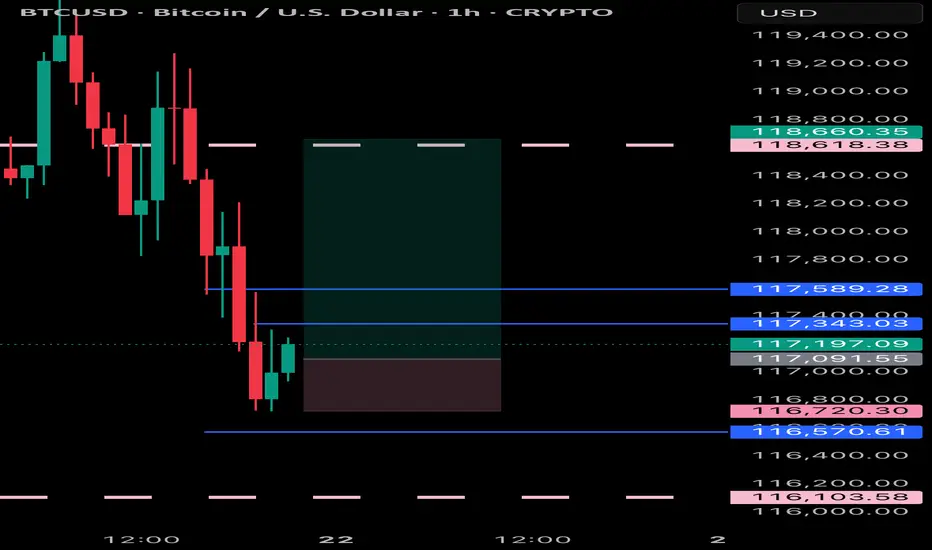
BTCUSD – Bulls Still in Control After New ATH 🔸 After the new All-Time High printed 10 days ago, Bitcoin entered a consolidation phase. So far, the market looks healthy and seems to be waiting for a trigger to continue the uptrend.
🔸 A clear support zone has formed around 116k, and as long as this level holds, bulls remain in full control of the market.
📉 For short-term traders and speculators:
Buying dips near 117.5k could offer solid risk/reward setups, with a target around 125k in case of a breakout.
Let’s see if the market gives us the trigger we’re waiting for. 🚀
BTCUSDT Forming Bullish WaveBTCUSDT is currently forming a bullish wave pattern, signaling a potential continuation of its upward momentum. This technical setup suggests a series of higher highs and higher lows, indicative of strong buyer demand and consistent market optimism. With volume remaining robust, the foundation for a significant breakout is solid. If the pattern plays out, analysts expect a 09% to 10% gain in the mid to long term, which could be fueled by renewed institutional interest and global adoption.
Bitcoin has historically responded well to bullish wave formations, often leading to aggressive rallies once key resistance levels are breached. As the largest cryptocurrency by market cap, BTCUSDT not only reflects investor sentiment in Bitcoin itself but also often sets the tone for the broader crypto market. The current price action shows consolidation with positive volume spikes, which further supports the bullish thesis and provides a potential launchpad for another major leg upward.
With increasing attention on macroeconomic shifts, regulatory developments, and halving cycles, Bitcoin continues to position itself as a hedge against traditional market uncertainties. The bullish wave pattern now forming could signal that Bitcoin is entering a new phase of growth, especially as global interest in decentralized finance, ETFs, and blockchain innovation surges.
Traders and long-term investors alike should closely monitor this structure. A breakout with volume confirmation could offer an excellent entry point, backed by strong technicals and a solid fundamental backdrop. The combination of a bullish pattern and broader adoption trends makes BTCUSDT one of the most watched assets in the market right now.
✅ Show your support by hitting the like button and
✅ Leaving a comment below! (What is You opinion about this Coin)
Your feedback and engagement keep me inspired to share more insightful market analysis with you!

BTC/USD) Bullish trend analysis Read The captionSMC Trading point update
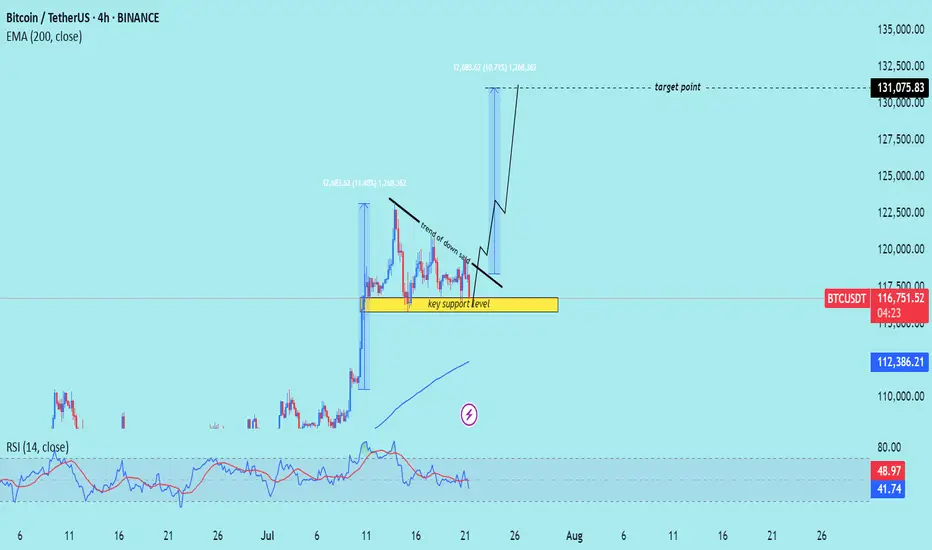
Technical analysis of Bitcoin (BTC/USDT) on the 4-hour timeframe, indicating a potential upward continuation after a period of consolidation above a key support level.
---
Analysis Summary
Pair: BTC/USDT
Timeframe: 4H
Current Price: 116,810.90
Bias: Bullish breakout continuation
---
Key Technical Insights
1. Key Support Zone:
The yellow box marks a strong support level, where price has bounced multiple times.
Acts as a launchpad for the next move higher.
2. Descending Trendline:
A trend of lower highs suggests short-term selling pressure.
Break above this trendline would signal a bullish breakout.
3. Projected Move:
If the breakout occurs, the projected target is around 131,075.83, representing a ~12% gain.
Similar move structure as the previous breakout earlier this month.
4. EMA 200 (Supportive):
Price remains above the 200 EMA at 112,386.80, affirming bullish trend bias.
5. RSI (14):
RSI hovering around 42–49, slightly oversold area, suggesting upside potential remains.
---
Target Point
Target: 131,075.83 USDT
Stop-Loss Suggestion: Below key support zone (~114,000)
---
Trade Idea
Direction Entry Stop-Loss Target
Buy Break above 118,000 Below 114,000 131,000–132,000
Mr SMC Trading point
---
Summary
Bitcoin is consolidating above a strong support zone and under a descending trendline. A confirmed breakout from this pattern could lead to a bullish rally toward 131,000+.
-
Please support boost 🚀 this analysis)
BTCUSD RECAPBITCOIN has preformed as expected in short period of time can continue even more to the up side but will wait for good entries
BTCUSD BTCUSD still expecting some good run within to the up side as there’s a new higher price that’s not been touched
Btcusd:Huge trading opportunities and ideasBTCUSD's rebound after touching the position near 116180 this time is fast. From the trend observation. BTCUSD is still in a high consolidation stage. It has not broken the oscillation range for the time being. It can maintain selling near 120k. Buying near 11600 for range trading. It is expected that there will not be many trading opportunities in the London market. It will take until the New York market opens to see better trading opportunities.

BTCUSDT BEARISH LONG CHART ANALYSIS📉 BTCUSDT – Bearish Setup in Play (1H)
Bitcoin faces rejection near 119500 resistance and is currently trading around 117000. If price breaks below 115000, bearish momentum may extend toward the 112000 target zone.
🔸 Resistance: 119500
🔸 Support Zone: 115000
🔸 Bearish Target: 112000
Structure remains weak unless buyers reclaim 119500. Watch price action closely.
---
📌 This analysis is for educational purposes only. Trade safe and manage risk properly.

BTCUSD BULLYING Bitcoin is still respecting price and is buying can expect some nice moves (New Highs)
BTCUSDBTCUSD also fell from a high level, reaching a high of around 119700, only 300 points away from the target of 120k. The price after the decline is now around 118600. Buying at a low level is the main focus. The reference buying point is 118500-118000. The target is above 120k. Stop loss 117300
BTC/USDT LONG SET UP (BITCOIN)Entry Price 1: $118,000
Entry Price 2: $116,500
Stop Loss: $115,000
Take Profit 1: $121,000 (Close 25%)
Take Profit 2: $124,000 (Close 50%)
Take Profit 3: $127,000 (Close 75%)
Take Profit 4: $130,000 (Close 100%)

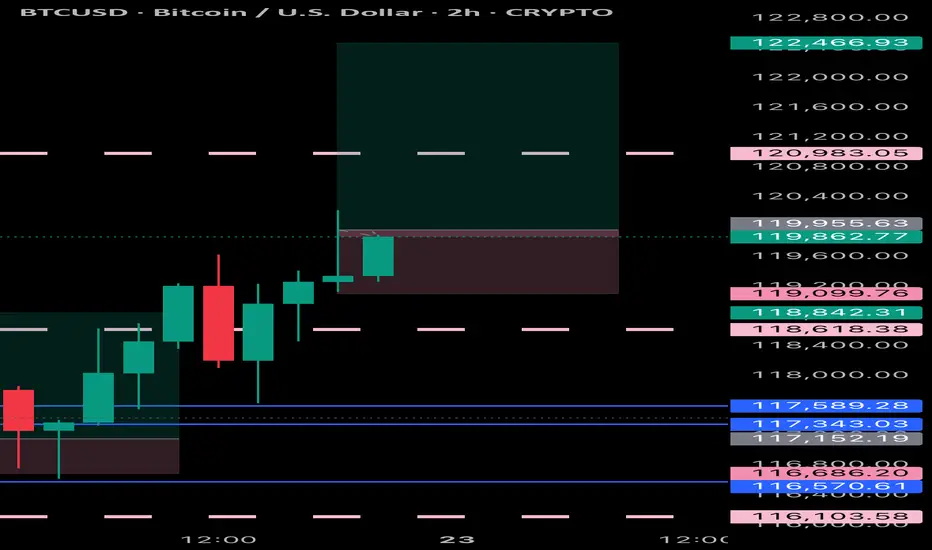
BTCUSD CONSOLIDATES BEFORE NEXT HIKE
BTCUSD CONSOLIDATES BEFORE NEXT HIKE📈
Bitcoin has been under buying pressure since the beginning of July 9. Since July 14 the price has been consolidating. Now the graph represents the bullish pennant.
I expect the price to continue trading sideways for some time, then rebound from the trendline and move towards first major liquidation level at 127,400.00.
What is a liquidation Level?
The price at which a crypto exchange forcibly closes a leveraged position when margin falls below the required level, recovering borrowed funds.

#Bitcoin LTF update #Bitcoin LTF update
After making a high of $123,300, it dropped a bit and made short-term support at $117,000, and currently it is holding at this level.
But it is not strong enough to hold, we will retest the lower level.
IMO, we can see a retest up to $113,000 level approximately.
Where we have 0.382 golden fibre level, which is also aligning with some more important indicators, and most importantly, we have good numbers of liquidation at that level.
If you find my updates helpful, don’t forget to like and follow for more!
DYOR, NFA

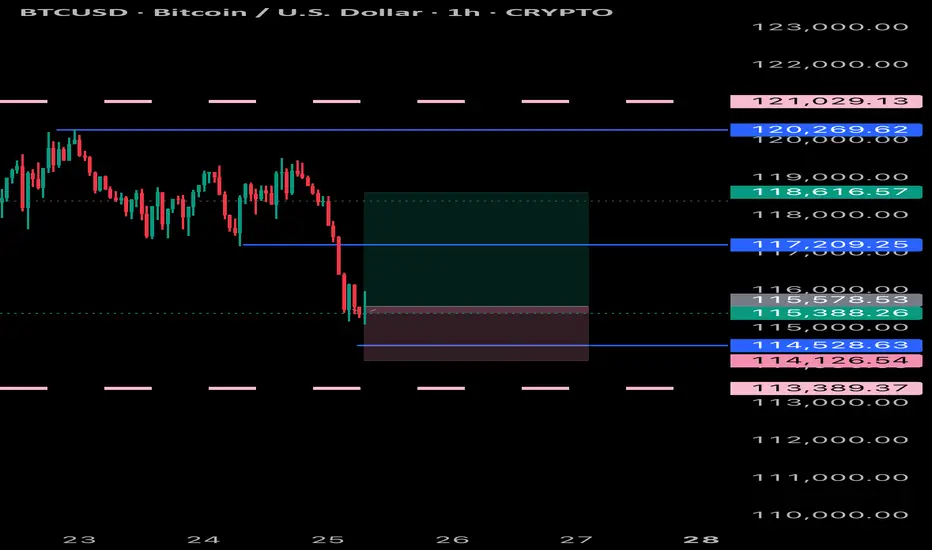
Bitcoin Technical Setup: Support Holds, Eyes on $118,600Bitcoin ( BINANCE:BTCUSDT ) moved as I expected in the previous ideas and finally completed the CME Gap($117,255-$116,675) in the last hours of the week. ( First Idea _ Second Idea )
Before starting today's analysis, it is important to note that trading volume is generally low on Saturday and Sunday , and we may not see a big move and Bitcoin will move in the range of $121,000 to $115,000 ( in the best case scenario and if no special news comes ).
Bitcoin is currently trading near the Support zone($116,900-$115,730) , Cumulative Long Liquidation Leverage($116,881-$115,468) , Potential Reversal Zone(PRZ) , and Support lines .
According to Elliott Wave theory , Bitcoin had a temporary pump after the " GENIUS stablecoin bill clears House and heads to Trump's desk " news, but then started to fall again, confirming the end of the Zigzag Correction(ABC/5-3-5) . Now we have to wait for the next 5 down waves or the corrective waves will be complicated .
I expect Bitcoin to rebound from the existing supports and rise to at least $118,600 . The second target could be the Resistance lines .
Do you think Bitcoin will fill the CME Gap($115,060-$114,947) in this price drop?
Cumulative Short Liquidation Leverage: $121,519-$119,941
Do you think Bitcoin can create a new ATH again?
Note: Stop Loss(SL)= $114,700
Please respect each other's ideas and express them politely if you agree or disagree.
Bitcoin Analyze (BTCUSDT), 15-minute time frame.
Be sure to follow the updated ideas.
Do not forget to put a Stop loss for your positions (For every position you want to open).
Please follow your strategy and updates; this is just my Idea, and I will gladly see your ideas in this post.
Please do not forget the ✅' like '✅ button 🙏😊 & Share it with your friends; thanks, and Trade safe.

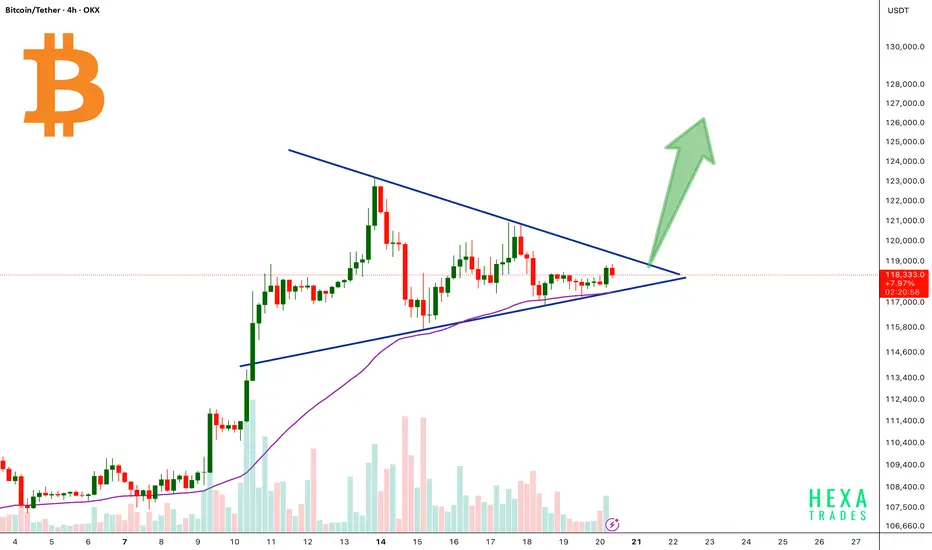
BTC Forming Bullish Triangle!Bitcoin is currently consolidating inside a symmetrical triangle pattern after a strong bullish rally. The price is approaching the apex of the triangle, signaling a potential breakout soon.
The 50 EMA is acting as dynamic support, perfectly aligned with the triangle’s lower trendline, reinforcing the bullish structure.
A confirmed breakout above the triangle resistance could trigger a strong upward move, with a potential target near the $125,000–$130,000 zone.
Cheers
Hexa
BINANCE:BTCUSDT CRYPTOCAP:BTC