BTC/USDT "Bitcoin vs Tether" Crypto Market Bearish Heist Plan🌟Hi! Hola! Ola! Bonjour! Hallo!🌟
Dear Money Makers & Robbers, 🤑 💰🐱👤🐱🏍
Based on 🔥Thief Trading style technical and fundamental analysis🔥, here is our master plan to heist the BTC/USDT "Bitcoin Tether" Crypto Market. Please adhere to the strategy I've outlined in the chart, which emphasizes short entry. Our aim is the high-risk Green Zone. Risky level, oversold market, consolidation, trend reversal, trap at the level where traders and bullish robbers are stronger. 🏆💸Book Profits Be wealthy and safe trade.💪🏆🎉
Entry 📈 : The heist is on! Wait for the breakout of (80000) then make your move - Bearish profits await!"
however I advise placing Sell stop below the MA line or Sell limit orders within a 15 or 30 minute timeframe. Entry from the most recent or closest low or high level should be in swing/retest.
📌I strongly advise you to set an alert on your chart so you can see when the breakout entry occurs.
Stop Loss 🛑: Thief SL placed at (84000) swing Trade Basis Using the 4H period, the recent / swing high or low level.
SL is based on your risk of the trade, lot size and how many multiple orders you have to take.
Target 🎯: 68000 (or) Escape Before the Target
🧲Scalpers, take note 👀 : only scalp on the Short side. If you have a lot of money, you can go straight away; if not, you can join swing traders and carry out the robbery plan. Use trailing SL to safeguard your money 💰.
📰🗞️Fundamental, Macro, COT Report, On Chain Analysis, Quantitative Analysis, Intermarket Analysis, Sentimental Outlook:
The BTC/USDT "Bitcoin Tether" Crypto Market is currently experiencing a Neutral trend (there is a higher chance for Bearishness).., driven by several key factors.
⭐Fundamental Analysis
Fundamental analysis assesses Bitcoin's core metrics and market position. Here are the key factors:
Market Capitalization: Approximately 1.68 trillion USD, calculated using the circulating supply of 19.83 million BTC multiplied by the current price of 85,000 USDT. This reflects Bitcoin’s significant presence in the crypto market.
Trading Volume (24h): Around 31.44 billion USD, indicating robust liquidity and active trading activity over the past day.
Circulating Supply: 19.83 million BTC, out of a maximum supply of 21 million BTC, meaning 94.4% of the total supply is already in circulation.
Price Context: Bitcoin’s current price of 85,000 USDT is below its all-time high of 109,356 USD (reached on January 20, 2025), suggesting it is in a corrective phase but still well above historical lows (e.g., 2 USD on October 20, 2011).
Key Insight: Bitcoin’s fundamentals remain strong with a high market cap and active trading volume, but the price being below its recent peak indicates potential vulnerability or a consolidation period.
⭐Macroeconomic Factors
Macroeconomic conditions influence Bitcoin’s price as a global asset. Here are the relevant factors:
Global GDP Growth: Forecasted at 3.0% to 3.3% for 2025, suggesting moderate economic expansion worldwide. This level of growth may support risk assets like Bitcoin but isn’t strong enough to trigger significant inflation concerns.
Commodity Prices: Expected to decline by 5% in 2025, potentially reducing Bitcoin’s appeal as an inflation hedge since falling commodity prices signal lower inflationary pressure.
Stock Market Performance: U.S. stock indices are up 5% year-to-date (YTD) as of early 2025, reflecting a positive risk-on sentiment that often correlates with Bitcoin’s performance as a speculative asset.
Interest Rate Policies: The U.S. Federal Reserve is anticipated to cut interest rates in 2025, which could weaken the USD and make Bitcoin more attractive relative to USDT (a USD-pegged stablecoin). Conversely, the Bank of Japan may raise rates, though this has a limited direct impact on BTC/USDT.
Key Insight: Macroeconomic conditions are mixed—declining commodity prices may dampen Bitcoin’s inflation-hedge narrative, but stock market gains and potential Fed rate cuts could bolster its price.
⭐Global Market Analysis
Global market trends and events provide context for BTC/USDT’s performance:
Geopolitical Events: No significant geopolitical tensions are currently reported as of March 5, 2025. This reduces demand for Bitcoin as a safe-haven asset, unlike during periods of global unrest.
Central Bank Policies:
Federal Reserve: Expected rate cuts could weaken the USD, potentially driving BTC/USDT higher as investors seek alternatives.
Bank of Japan: Anticipated rate hikes may strengthen the JPY, but this has minimal direct influence on BTC/USDT unless it triggers broader currency shifts.
Commodity Trends: A projected 5% decline in commodity prices may ease inflation fears, indirectly reducing Bitcoin’s appeal as a store of value.
Global Risk Sentiment: Mixed stock market performance globally suggests a neutral stance on risk assets, with no strong directional push for Bitcoin.
Key Insight: Without major geopolitical catalysts, Bitcoin’s price may hinge on central bank actions, particularly Fed rate cuts that could weaken the USD and support BTC/USDT.
⭐Commitment of Traders (COT) Data
COT data offers insights into large trader positions, though specific BTC/USDT COT reports are not directly available. Here’s an inferred analysis:
Technical Ratings: Current indicators for BTC/USDT show a “sell” signal, with oscillators (e.g., RSI, MACD) and moving averages (e.g., 50-day, 200-day) trending strongly bearish.
Trader Positioning: The bearish technical outlook suggests large traders (e.g., speculators) are likely net short, anticipating further price declines.
Market Implications: This positioning could amplify downward pressure if selling continues, though a reversal in sentiment could trigger a short squeeze.
Key Insight: The inferred COT data points to bearish sentiment among large traders, aligning with technical signals and suggesting a downward bias.
⭐On-Chain Analysis
On-chain data reflects Bitcoin’s blockchain activity and holder behavior:
Unmoved BTC: Approximately 151,000 BTC, acquired at an average price of 97,800 USDT, has not moved despite recent volatility. This indicates strong conviction among holders at higher levels, potentially acting as resistance.
Accumulation Patterns: Some accumulation occurred near 83,000 USDT, suggesting buying interest at lower levels. However, rapid selling has dominated, with one-third of BTC accumulated between 96,000–97,500 USDT redistributed during the recent decline.
Supply Concentrations: Thin supply exists between 93,000 and 83,000 USDT, with notable clusters at 84,200 USDT (23,000 BTC), 86,900 USDT (25,800 BTC), and 88,900 USDT (46,000 BTC), indicating key price levels where holders may act.
Key Insight: On-chain data shows a mix of strong holding at higher prices and selling pressure at current levels, hinting at capitulation but also potential support forming near 83,000–85,000 USDT.
⭐Market Sentiment Analysis
Market sentiment reflects trader and investor psychology:
Social Media Sentiment: Posts on platforms like X reveal a split outlook—some traders predict a drop to 75,000–73,000 USDT, citing technical weakness, while others see a potential bullish reversal if support holds.
Sentiment Index: Total positive sentiment is estimated at 0.75 (on a scale from -1 to 1), suggesting moderate optimism despite recent declines.
Fear and Greed Index: Specific data is unavailable, but the mixed sentiment aligns with a neutral-to-slightly bullish stance.
Key Insight: Sentiment is mixed but leans slightly bullish, indicating cautious optimism amid uncertainty.
⭐Positioning
Positioning reflects how traders are aligned in the market:
Speculative Positions: Likely net short, inferred from bearish technical signals and COT-like trends, suggesting traders are betting on a decline.
Institutional Positioning: Hedge funds have increased exposure to Bitcoin ETFs, indicating growing long-term interest that could counterbalance short-term selling.
Market Dynamics: Short positions may dominate near-term price action, but institutional buying could stabilize or reverse the trend.
Key Insight: Short-term bearish positioning contrasts with potential long-term bullish institutional interest.
⭐Next Trend Move
The next likely price movement is based on current data:
Direction: Downward pressure is favored, driven by technical sell signals and bearish positioning.
Key Levels:
Support: 80,000 USDT; if breached, 75,000–73,000 USDT becomes the next target.
Resistance: 95,000 USDT, a level that would need to be overcome for a bullish reversal.
Triggers: A break below 80,000 USDT could accelerate selling, while holding above 85,000 USDT might signal stabilization.
Key Insight: The next trend move likely tests lower support levels, with a potential drop to 75,000–73,000 USDT if momentum persists.
⭐Other Data
Additional factors impacting BTC/USDT:
Institutional Adoption: Hedge funds are increasing exposure to Bitcoin ETFs, a bullish signal for long-term price support as institutional capital flows in.
Regulatory Changes: The SEC’s employee buyout program in 2025 could lead to shifts in crypto regulation, introducing uncertainty and potential volatility.
Market Trends: Bitcoin’s limited supply (21 million BTC cap) and growing mainstream acceptance bolster its long-term value proposition.
Key Insight: Institutional interest is a positive wildcard, but regulatory uncertainty could shake confidence in the near term.
⭐Overall Summary Outlook
Overview: On March 5, 2025, BTC/USDT at 85,000 USDT exhibits a cautiously bearish outlook. Technical sell signals, bearish trader positioning, and recent on-chain selling pressure point to downside risks. However, strong holding behavior at higher levels (e.g., 97,800 USDT), potential institutional support via ETF exposure, and a slightly bullish market sentiment suggest a reversal is possible if support holds. Macroeconomic factors like expected Fed rate cuts could weaken the USD and provide tailwinds, though declining commodity prices may temper Bitcoin’s inflation-hedge appeal. Risks include a drop below 80,000 USDT or volatility from regulatory shifts.
📌Keep in mind that these factors can change rapidly, and it's essential to stay up-to-date with market developments and adjust your analysis accordingly.
⚠️Trading Alert : News Releases and Position Management 📰 🗞️ 🚫🚏
As a reminder, news releases can have a significant impact on market prices and volatility. To minimize potential losses and protect your running positions,
we recommend the following:
Avoid taking new trades during news releases
Use trailing stop-loss orders to protect your running positions and lock in profits
💖Supporting our robbery plan 💥Hit the Boost Button💥 will enable us to effortlessly make and steal money 💰💵. Boost the strength of our robbery team. Every day in this market make money with ease by using the Thief Trading Style.🏆💪🤝❤️🎉🚀
I'll see you soon with another heist plan, so stay tuned 🤑🐱👤🤗🤩
Btcusdtanalysis

BTC/USD "Bitcoin vs Tether" Crypto Market Heist Plan🌟Hi! Hola! Ola! Bonjour! Hallo! Marhaba!🌟
Dear Money Makers & Robbers, 🤑💰✈️
Based on 🔥Thief Trading style technical and fundamental analysis🔥, here is our master plan to heist the BTC/USD "Bitcoin vs Tether" Crypto market. Please adhere to the strategy I've outlined in the chart, which emphasizes long entry and short entry. 🏆💸Be wealthy and safe trade.💪🏆🎉
Entry 📈 :
"The loot's within reach! Wait for the breakout, then grab your share - whether you're a Bullish thief or a Bearish bandit!"
🏁Buy entry above 93000
🏁Sell Entry below 84000
📌However, I recommended to place buy stop for bullish side and sell stop for bearish side.
Stop Loss 🛑:
🚩Thief SL placed at 88000 (swing Trade Basis) for Bullish Trade
🚩Thief SL placed at 92000 (swing Trade Basis) for Bearish Trade
Using the 4H period, the recent / swing low or high level.
SL is based on your risk of the trade, lot size and how many multiple orders you have to take.
Target 🎯:
🏴☠️Bullish Robbers TP 11000 (or) Escape Before the Target
🏴☠️Bearish Robbers TP 68000 (or) Escape Before the Target
📰🗞️Fundamental, Macro, COT Report, On Chain Analysis, Sentimental Outlook, Intermarket Analysis, Future Prediction:
BTC/USD "Bitcoin vs Tether" Crypto market is currently experiencing a Neutral Trend (slightly Bearish🐼),., driven by several key factors.
1. Fundamental Analysis⭐⚡🌟
Fundamental analysis evaluates Bitcoin’s intrinsic drivers:
Adoption Trends:
Institutional inflows via Bitcoin ETFs remain strong, with $1.5 billion added in Q1 2025. MicroStrategy holds 300,000 BTC, reinforcing corporate adoption—bullish.
Regulatory Environment:
The U.S. signals a pro-crypto stance with talks of a strategic Bitcoin reserve, boosting confidence—bullish. However, global regulatory uncertainty (e.g., EU tax proposals) adds mild bearish pressure.
Halving Impact:
Post-2024 halving (April), supply issuance dropped to 450 BTC/day. Historical patterns suggest price appreciation 12-18 months later, supporting a bullish outlook for 2025.
Network Usage:
Transaction volume is up 10% year-over-year, driven by Layer 2 solutions (e.g., Lightning Network)—bullish for utility and value.
Inflation Hedge Narrative:
With U.S. inflation at 3.0%, Bitcoin’s appeal as a store of value grows—bullish, though tempered by short-term risk-off sentiment.
Detailed Explanation: Fundamentals are strongly bullish long-term due to adoption, supply scarcity, and macro trends. Short-term bearish pressures from regulatory uncertainty and profit-taking explain the current dip to 87,000.
2. Macroeconomic Factors⭐⚡🌟
Macroeconomic conditions influencing BTC/USD:
U.S. Economy:
Fed rates at 3.0% with no immediate cuts signal tighter conditions—bearish short-term as capital favors yield-bearing assets.
Unemployment steady at 4.2% supports economic stability—neutral.
Global Growth:
China’s GDP growth slows to 4.2%, reducing demand for risk assets like Bitcoin—bearish.
Eurozone PMI at 47.8 indicates contraction, pressuring global markets—bearish.
Currency Markets:
USD strength (DXY at 106) weighs on BTC/USD, as a stronger dollar reduces Bitcoin’s appeal—bearish short-term.
Commodity Prices:
Oil at $68/bbl and gold at $2,950 reflect a mixed risk environment—neutral for Bitcoin.
Geopolitical Risk:
Middle East tensions elevate safe-haven demand, but Bitcoin’s correlation with gold is weakening—neutral to mildly bearish.
Detailed Explanation: Macro factors tilt bearish short-term due to USD strength and global slowdown, countering Bitcoin’s long-term bullish fundamentals. This tension explains the current downward trend from higher levels.
3. Commitments of Traders (COT) Data⭐⚡🌟
COT data reflects futures positioning:
Speculative Traders:
Net long positions at 15,000 contracts, down from 25,000 at the 95,000 peak. Reduced bullishness suggests caution—bearish signal.
Commercial Hedgers:
Net short at 20,000 contracts, stable. Hedgers locking in gains indicate no panic—neutral.
Open Interest:
45,000 contracts, down 10% from February highs. Declining participation hints at fading momentum—bearish.
Detailed Explanation: COT data supports a bearish short-term view. Speculators unwinding longs and falling open interest align with the downward trend, though hedgers’ stability prevents a sharper collapse.
4. On-Chain Analysis⭐⚡🌟
On-chain metrics provide insights into Bitcoin’s network activity:
Exchange Balances:
2.6 million BTC on exchanges, up 5% in March. Rising supply suggests selling pressure—bearish.
Transaction Volume:
Daily volume at $10 billion, flat month-over-month. Lack of growth signals reduced buying interest—neutral to bearish.
HODLing Behavior:
70% of BTC unmoved for over a year (13.8 million coins). Strong holder conviction limits downside—bullish long-term.
Miner Activity:
Miners hold 1.8 million BTC, with minimal outflows. Stable miner behavior supports price floors—mildly bullish.
Realized Price Levels:
Realized cap indicates a cost basis of 78,000 for recent buyers, acting as support—bullish if held.
Detailed Explanation: On-chain data is mixed. Short-term bearish signals from exchange inflows contrast with long-term bullishness from HODLing and miner stability, suggesting a correction rather than a collapse.
5. Intermarket Analysis⭐⚡🌟
Correlations with other markets:
USD Strength:
DXY at 106 pressures BTC/USD inversely—bearish short-term.
S&P 500:
At 5,900, down 2% this week, reflecting risk-off sentiment. Bitcoin’s 0.6 correlation with equities adds downward pressure—bearish.
Gold:
At $2,950, gold rises as a safe haven, decoupling from Bitcoin—neutral to bearish.
Bond Yields:
U.S. 10-year yields at 3.8% attract capital away from risk assets—bearish.
Altcoins:
ETH/BTC ratio at 0.035, with altcoins underperforming Bitcoin, reinforcing BTC’s relative strength—mildly bullish.
Detailed Explanation: Intermarket signals are bearish short-term due to USD strength, equity declines, and yield competition. Bitcoin’s resilience versus altcoins offers some support, but broader risk-off trends dominate.
6. Market Sentiment Analysis⭐⚡🌟
Investor and trader mood:
Retail Sentiment:
Social media analysis shows 45% bullish sentiment, down from 60% at 95,000. Fear of further drops prevails—bearish.
Analyst Views:
Consensus targets range from 80,000 (short-term support) to 100,000 (Q3 2025), reflecting uncertainty—mixed.
Options Market:
Call/put ratio at 0.9, with balanced positioning. No strong directional bias—neutral.
Fear & Greed Index:
At 40 (neutral), down from 70 (greed) in February, indicating cooling enthusiasm—bearish shift.
Detailed Explanation: Sentiment has turned bearish short-term as retail investors react to the decline from 95,000. Analysts’ mixed views and neutral options activity suggest a wait-and-see approach, aligning with the current trend.
7. Next Trend Move and Future Trend Prediction⭐⚡🌟
Price projections across timeframes:
Short-Term (1-2 Weeks):
Range: 84,000 - 88,500
Likely to test support at 86,000-84,000 if selling persists; a bounce to 88,500 possible on relief rally.
Catalysts: U.S. economic data (e.g., CPI on March 12), ETF flows.
Medium-Term (1-3 Months):
Range: 80,000 - 92,000
Below 84,000 targets 80,000 (realized price support); above 88,500 aims for 92,000 if risk appetite returns.
Catalysts: BOJ policy update, institutional buying.
Long-Term (6-12 Months):
Bullish Target: 100,000 - 110,000
Driven by halving cycle, adoption, and inflation hedging—65% probability.
Bearish Target: 70,000 - 75,000
Triggered by global recession or regulatory crackdown—35% probability.
Catalysts: U.S. strategic reserve decision, Q3 GDP data.
Detailed Explanation: Short-term downside to 84,000 aligns with current bearish momentum. Medium-term consolidation reflects macro uncertainty, while long-term upside to 100,000+ hinges on fundamentals prevailing over temporary setbacks.
8. Overall Summary Outlook⭐⚡🌟
BTC/USD at 87,000 is in a short-term bearish correction within a broader bullish cycle. Fundamentals (adoption, halving) and on-chain HODLing support long-term gains, but macro headwinds (USD strength, global slowdown), COT unwinding, and risk-off sentiment drive the current downward trend. Exchange inflows and declining sentiment reinforce near-term weakness, with support at 84,000-80,000 likely to hold. Medium-term recovery to 92,000 and long-term growth to 100,000+ remain plausible if catalysts align.
📌Keep in mind that these factors can change rapidly, and it's essential to stay up-to-date with market developments and adjust your analysis accordingly.
⚠️Trading Alert : News Releases and Position Management 📰 🗞️ 🚫🚏
As a reminder, news releases can have a significant impact on market prices and volatility. To minimize potential losses and protect your running positions,
we recommend the following:
Avoid taking new trades during news releases
Use trailing stop-loss orders to protect your running positions and lock in profits
💖Supporting our robbery plan 💥Hit the Boost Button💥 will enable us to effortlessly make and steal money 💰💵. Boost the strength of our robbery team. Every day in this market make money with ease by using the Thief Trading Style.🏆💪🤝❤️🎉🚀
I'll see you soon with another heist plan, so stay tuned 🤑🐱👤🤗🤩

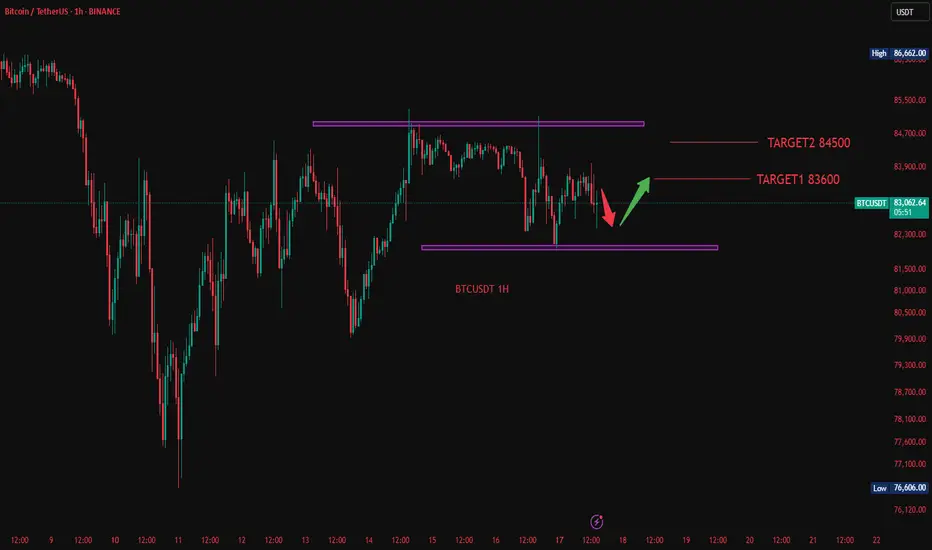
3/24 BTCUSD Trading Signal: LongThis is a relatively healthy rebound. After breaking through the first resistance, it slowly rose to the second resistance, where it has been tested many times. The current shape is good and there is room for further rise.
Therefore, in the current transaction, it is recommended to take long as an important reference direction, and the target is near the resistance of 86K.
When the price rises to this point, the market is likely to confirm the validity of the area near the 85K support. If the support is confirmed to be valid, the price may rise to 86.8K-88K.

This chart represents a Bitcoin (BTC/USD) price analysis on a 30This chart represents a Bitcoin (BTC/USD) price analysis on a 30-minute timeframe. Here’s a breakdown of the key elements:
Supply Zone (Resistance) at ~$85,599
The price has approached this supply zone, which could act as a resistance level.
The expectation is that the price may struggle to break above this level and could reverse downward.
Demand Zone (Support) at ~$81,500 - $81,755
This is labeled as the "diamond zone," which could act as a strong support area where buying interest may emerge.
The price is anticipated to decline towards this level.
Projected Price Movement
The blue arrows suggest a bearish scenario.
The price might initially react to the supply zone, then break below the trendline, confirming a downtrend.
The target for this downward move is the demand zone around $81,500.
Trendline Break
A rising trendline is drawn, which currently acts as support.
If the price breaks below it, it would confirm a bearish momentum shift.
Conclusion
This chart suggests a short-selling opportunity near the supply zone, targeting the demand zone. However, traders should watch for confirmations such as a rejection from resistance and a break below the trendline before entering a trade.


BTCUSDT:Wait for retracement and go longBTC has been fluctuating around 84,000, showing an overall upward trend in its movement. It is advisable to continue waiting for a pullback before taking a long position.
BTC Trading strategy:
buy@83500
TP1:85500
TP2:86500
Get daily trading signals that ensure continuous profits! With an astonishing 90% accuracy rate, I'm the record - holder of an 800% monthly return. Click the link below the article to obtain accurate signals now!

BTC Today's strategySo far, BTC has fluctuated around 84K today, and it still fluctuates within our marked range. The strategy of selling high and buying low still works.
Today's BTC trading strategy:
btcusdt buy@83K-83.5K
tp:84.5K-85.5K
There is no large-scale selling by long-term holders in the market. Short-term holders have a significant impact on short-term movements. At present, geopolitical conflicts continue, trade frictions continue, and bitcoin and gold have historically performed well in times of economic uncertainty
Our investment strategy has achieved significant returns in the past two weeks. If you also want to double your capital, you can click on my link to get my trading strategy

BTC/USD hourly trend using Market Timing AnalysisAccording to the analysis, the BTC/USD looks bearish. Trade with the stop loss.

BTC Today's strategyToday, BTC still fluctuates within our marked range, and the strategy of selling high and buying low still works
Today's BTC trading strategy:
btcusdt buy@83K-84K
tp:85K-86K
There are risks in trading. If you are not sure about the timing, it is best to leave me a message. This will better confirm the timing of the transaction, It can also better expand profits and reduce losses

BTCUSDT TRDAING POINT UPDATE > READ THE CHAPTIAN Buddy'S dear friend
SMC Trading Signals Update 🗾🗺️ crypto Traders SMC-Trading Point update you on New technical analysis setup for crypto BTC USDT list time post signals 💯 reached target 🎯✔️ New technical analysis Setup two said fisrt make close above ground that expect bullish trend 🚀 target point 88k 90k. Next patterns if close below 👇 ⬇️ 83k 80k strong 💪 support level up trand target point 88k 90k fisrt entry risk 🙏. Good luck 💯💯
Key Resistance level 87k + 80k + 90k
Key Support level 83k - 80k
Mr SMC Trading point
Pales support boost 🚀 analysis follow)

BTC Today's strategyAt present, the support range continues to move upward and the fluctuations have exceeded the previous range. This is a new direction. We only need to make appropriate adjustments and trade within the range, selling high and buying low.
Today's BTC trading strategy:
btcusdt buy@83K-84K
tp:86K-87K
There are risks in trading. If you are not sure about the timing, it is best to leave me a message. This will better confirm the timing of the transaction, It can also better expand profits and reduce losses.

BTCUSDT EA MAN UPDATE >READ THE CHAPTAIN **BTCUSDT EA MAN Update – Analysis in English**
---
### **BTC/USDT Analysis (15 min) – Bullish Trend in Sight**
#### **Key Observations:**
- **FVG Support Zone (Fair Value Gap):** The price has reacted positively to this zone and is showing signs of a bullish recovery.
- **EMA Confluence:** The price is currently below the 30 EMA (red), but a breakout above could confirm stronger bullish momentum.
- **Target Point:** The analysis anticipates a move towards **85,104 USDT**, possibly after a slight pullback to test the support zone.
If the price sustains above the 30 EMA and breaks through the minor resistance, the bullish target seems achievable.

BITCOIN 70K incoming!!!We can expect one more push towards 73-70k region before moving towards 120k. Don't get FOMO seeing green candles now. STAY CAUTIOUS !!! THIS MAY BE A BULL TRAP

BTC Today's strategyToday, BTC trading is relatively stable and has been fluctuating in the 80K-85K range. We are still buying near support points and selling near resistance points. Once there is a new breakout range, we can simply adjust it
Today's BTC trading strategy:
btcusdt sell@85K-87K
tp:83K-81K

BTC/USD - Bearish Break & Retest SetupMarket Overview :
Bitcoin (BTC/USD) has broken below a key consolidation zone after trading in a range between $90,000 - $108,000 for several weeks. The price is now attempting a retest of the previous support, which has turned into a resistance (supply zone) before a potential continuation to the downside.
Chart Pattern & Technical Setup:
📉 Break & Retest Structure: The price has broken below the previous range and is now testing the $87,000 - $91,000 resistance zone.
📉 Lower High Formation: BTC is expected to create a lower high before continuing its downward trend.
📉 Bearish Wave Projection: The chart suggests a zigzag movement, forming successive lower highs and lower lows, targeting $67,399 as the next support level.
Trade Setup:
Bias: Bearish
Entry: Sell limit at $87,000 - $91,000 (Supply Zone)
Stop Loss: Above $95,000 (Invalidation Level)
Take Profit: $67,399 (Next Key Support)
Confluences Supporting Bearish Bias:
✅ Supply Zone Rejection: The resistance area is likely to attract sellers.
✅ Market Structure Shift: A break below the previous range indicates a trend reversal.
✅ Lower High Confirmation: A rejection at resistance will confirm the bearish outlook.
Risk Management:
Risk-Reward Ratio (RRR): 1:3+
Position Sizing: Adjust based on risk tolerance.
Alternative Scenario:
A break and close above $95,000 would invalidate the bearish setup, signaling a potential bullish continuation.
📌 Disclaimer: This analysis is for educational purposes only. Always manage risk properly before entering a trade.

Bitcoin Correction & Accumulation Phase!#Bitcoin is in a correction and accumulation phase, something we’ve seen multiple times in this cycle.
As long as we don’t see any bearish confirmation on the higher time frame, this remains a normal correction within the bull run
We’re near the range's lower bound, which could be a good spot for short-term long setups on lower timeframes.
The next bullish breakout requires a weekly close above $110,000 🚀
History repeats itself—stay patient, accumulate smartly
What’s your strategy during these corrections? Let’s discuss it! 👇
DYOR, NFA

BTCUSD SELL signal. Don't forget about stop-loss.
Write in the comments all your questions and instruments analysis of which you want to see.
Friends, push the like button, write a comment, and share with your mates - that would be the best THANK YOU.
P.S. I personally will open entry if the price will show it according to my strategy.
Always make your analysis before a trade

BTC:Today's Trading StrategyThis morning, BTC has challenged the 84,000 price level. Currently, it has been fluctuating around 83,000 for a certain period. There is a high likelihood that it may witness another wave of upward movement at any moment. Today, I still adhere to the long-position trading strategy.
BTC Trading strategy:
buy@82600
TP1:83600
TP2:84500
I always firmly believe that profit is the sole criterion for measuring strength. I will share accurate trading signals every day. Follow my lead and wealth will surely come rolling in. Click on my profile for your guide.

Probability o Rising WedgeBINANCE:BTCUSDT BTC/USDT is currently "forming a rising wedge pattern" , which could indicate a continuation of the downtrend. Since the last peak at $110,000, Bitcoin has been experiencing a decline.
At the moment, BINANCE:BTCUSDT BTC/USDT is highly volatile, with daily price swings of up to 10%. This volatility increases the likelihood of fake breakouts and rapid reversals, especially due to external factors like news.

BTC Today's strategyThe support level of Bitcoin has begun to move upward. Currently, the market is still trading in the range of $80,000 to $85,000. The short-selling strategies I continuously provided have also made profits many times.
This week's BTC trading range could be broken at any time. We just need to wait for the market to show a new direction and then adjust our strategy
Today's BTC trading strategy:
btcusdt sell@85K-87K
tp:83K-81K
We will share various trading signals every day. Fans who follow us can get high returns every day. If you want stable profits, you can contact me.

BTC:Wait for opportunities and continue to go longToday, Bitcoin has experienced relatively limited price fluctuations, oscillating within a range of around 1,000 points. It has consistently failed to break through the resistance level of 84,000.
However, I believe that after a period of retracement, it will make another attempt to breach the resistance level. We can wait for the retracement to go long.
Trading strategy:
buy@82600
TP1:83600
TP2:84500
Bitcoin's local perspective 17.03.2025In Friday's analysis "How Trump's Policy Will Impact the Crypto Market", we presented a bearish model for the medium-term perspective👇
Today, our key focus is on the $78,300 level (the 4th point of our model), which serves as significant support.
It's important to note the presence of an unfilled gap on CME at the $85,905 level ($85,943 in index terms)👇
We assess the probability of closing this gap in the near term as high – either from current positions or after retesting the $78,300 level.
How will we act?
If price moves toward $85,943 from current levels, we plan to partially close our #ETH position that was accumulated during the March 11 decline.
In the scenario of a retest of $78,300, we will consider opening a long position on #BTC with a target of $85,943.
