BTCUSDT- at his current supporting area? What's next??#BTCUSDT.. market perfectly move as per our last idea and now market just reached at his current supporting area that is around 82120
Keep close that area because if market clear that level then it will leads you towards downside next supporting levels.
Good luck
Trade wisely
Btcusdtanalysis

BTCUSDT TRADING POINT UPDATE >READ THE CHAPTIAN Buddy's dear friend 👋
SMC Trading Signals Update 🗾🗺️ crypto Traders SMC-Trading Point update you on New technical analysis setup for crypto BTC USDT BTC still rejected supply zone. Again. Back Short Trade. FVG level) 83k I'm want to Sell now short trend 📈
Key Resistance level 93k + 95k
Key Support level 85k - 83k
Mr SMC Trading point
Pales support boost 🚀 analysis follow)

BTCUSDWe are expecting BTC to show us some side ways movement for the next few weeks until the end of this month
BTC/USD Ready for a BIG DROP? Next Target: Demand Zone!Bitcoin Showing Weakness – Smart Money Preparing a Move!
BTC/USD is struggling to hold key resistance levels, signaling potential distribution before a larger sell-off. Institutional players have grabbed liquidity, and a Break of Structure (BOS) to the downside confirms bearish momentum.

BTCUSDT 1WBTC ~ 1W Analysis
#BTC Expect good news to continue this pattern of increase. Maybe the next few weeks.
BTCUSDT: On the way back up to $110k!Dear traders,
Hope you are doing great, we have an excellent buying opportunity coming up or currently forming. Price has reversed with strong bullish volume, indicating a strong bullish impulse. A possible entry will be at breakthrough of inducement trend line.
If you agree with the idea, then please consider liking and commenting the idea which will encourage us to post more such ideas.
❤️

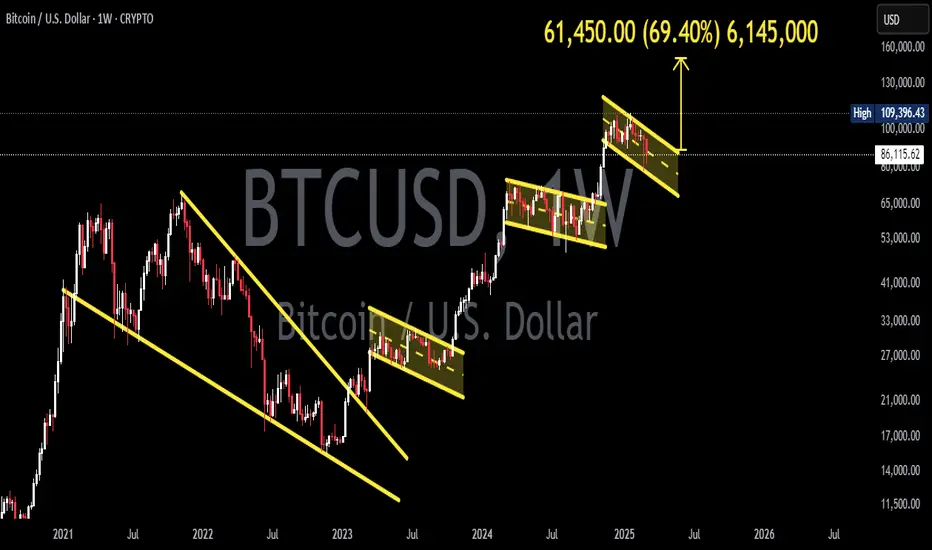
Bitcoin follows Fibanacci Leverls PERFECTLY - Easy tradingBitcoin has a habit of moving Rapidly, Randomly and at times, with Huge levels of volatility.
An yet, ALWAYS, it obeys Fibanacci levels to the Key.
The chart above shows this very well on a Weekly time scale.
Since the Low and start of this cycle on 13 Jun 2022, Bitcoin has moved Time and time again with Fib Extensions and Fib Fans providing Support and resistance.
The Diagonal Rising lines are a Fib Speed Resistance Fan and the Horizontal lines are Trend-Based Fib Extension
See how on each "Step" or period of Ranging that Bitcoin has done since the low, it has been perfectly "Contained" by 2 Fib lines.
The Fib Fan can also be seen to act as support or Resistance along the way.
And right now, if we Look at the daily version of this chart, we see the situation unfolding.
Firstly, see that rising Fib resistance line that just rejected PA on sunday - STRONG
It pushed PA back below that 3 Fib extension
That same 3 Fib ext line acted as strong support since we entered this range back in December 2024. It maybe as tough to cross back over and flip back to support.
See how PA has already tested the 2.768 Fib extension below, using the rising Fib Fan and then that Fib extension to stop its fall.
To me, this points towards PA possibly remaining in this Range, between the 3 and the 2.768 fib lines till we meet that next line of rising Fib fan in the later half of March ( Around 21st )
The 50 SMA ( not shown) is rising just below this line currently and I expect PA to bounce higher when the two meet.
And so, for me, I am expecting PA to remain in a range between 91K and a low around 82K with wicks Flashing Lower to around 78K
Obviously, Things can change very Quick with Bitcoin and invalidate all this in no time..but, for now....I have my SPOT Buy Orders from lows at 78600
I am not going to miss the chance of Buying Bitcoin at that price, understanding the real Cycle ATH will be in Q4 and expected to be over 200K
Lets see if this works out

BTC/USDT "Bitcoin vs Tether" Crypto Market Bearish Heist Plan🌟Hi! Hola! Ola! Bonjour! Hallo!🌟
Dear Money Makers & Robbers, 🤑 💰🐱👤🐱🏍
Based on 🔥Thief Trading style technical and fundamental analysis🔥, here is our master plan to heist the BTC/USDT "Bitcoin Tether" Crypto Market. Please adhere to the strategy I've outlined in the chart, which emphasizes short entry. Our aim is the high-risk Green Zone. Risky level, oversold market, consolidation, trend reversal, trap at the level where traders and bullish robbers are stronger. 🏆💸Book Profits Be wealthy and safe trade.💪🏆🎉
Entry 📈 : The heist is on! Wait for the breakout of (94000) then make your move - Bearish profits await!"
however I advise placing Sell stop below the support line or Sell limit orders within a 15 or 30 minute timeframe. Entry from the most recent or closest low or high level should be in swing/retest.
I highly recommend to use alert in your trading platform.
Stop Loss 🛑: Thief SL placed at 97000 (swing Trade Basis) Using the 4H period, the recent / swing high or low level.
SL is based on your risk of the trade, lot size and how many multiple orders you have to take.
Target 🎯: 86500 (or) Escape Before the Target
🧲Scalpers, take note 👀 : only scalp on the Short side. If you have a lot of money, you can go straight away; if not, you can join swing traders and carry out the robbery plan. Use trailing SL to safeguard your money 💰.
📰🗞️Fundamental, Macro, COT, Sentimental Outlook:
The BTC/USDT "Bitcoin Tether" Crypto Market is currently experiencing a Neutral trend (there is a higher chance for Bullishness).., driven by several key factors.
🌟☀ Fundamental Analysis
Institutional adoption (e.g., MicroStrategy) remains strong, but ETF outflows (650.8M last week) signal caution.
Hash rate near all-time highs supports network security; post-2024 halving supply reduction is a bullish long-term factor.
Pro-crypto US regulatory shifts are positive, though global uncertainty persists.
🌟☀ Macro Economics
Potential US rate cuts in 2025 could weaken USD, boosting BTC; tighter policy may pressure it.
Recession fears in Europe vs. US resilience create mixed risk sentiment; BTC correlates with equities.
Geopolitical tensions enhance Bitcoin’s store-of-value appeal.
🌟☀ Commitments of Traders (COT) Data
Large speculators slightly net long, showing cautious optimism; no extreme positioning.
Hedgers net short, typical for futures; retail longs are moderate, not overcrowded.
🌟☀ On-Chain Analysis
Exchange outflows exceed inflows (ratio ~0.98), indicating accumulation.
Long-term holders steady, short-term holder realized price at 96,000 acts as support.
Whale activity mixed: some profit-taking, but accumulation persists below 97,000.
🌟☀ Market Sentiment Analysis
Retail sentiment neutral, cautious on X; no extreme greed or fear.
Institutional hesitancy (ETF outflows) offsets professional traders’ accumulation views.
🌟☀ Positioning
Support at 96,000, resistance at 98,500-99,000; liquidity pools suggest breakout potential.
RSI (~50) neutral, MACD shows fading bearish momentum.
🌟☀ Overall Summary Outlook
Short-term: Consolidation between 94,000-100,000, slight upward bias.
Medium-term: Bullish if macro aligns (104,000-110,000); downside risk to 90,000.
Long-term: Fundamentals favor 120,000 by mid-2025.
⚠️Trading Alert : News Releases and Position Management 📰 🗞️ 🚫🚏
As a reminder, news releases can have a significant impact on market prices and volatility. To minimize potential losses and protect your running positions,
we recommend the following:
Avoid taking new trades during news releases
Use trailing stop-loss orders to protect your running positions and lock in profits
📌Please note that this is a general analysis and not personalized investment advice. It's essential to consider your own risk tolerance and market analysis before making any investment decisions.
📌Keep in mind that these factors can change rapidly, and it's essential to stay up-to-date with market developments and adjust your analysis accordingly.
💖Supporting our robbery plan will enable us to effortlessly make and steal money 💰💵 Tell your friends, Colleagues and family to follow, like, and share. Boost the strength of our robbery team. Every day in this market make money with ease by using the Thief Trading Style.🏆💪🤝❤️🎉🚀
I'll see you soon with another heist plan, so stay tuned 🤑🐱👤🤗🤩

BTCUSDT 1WBTC ~ 1W Analysis
#BTC We hope there will be a lot of good news after this dips. To support the next increase to the top of Elliot Wave 5.

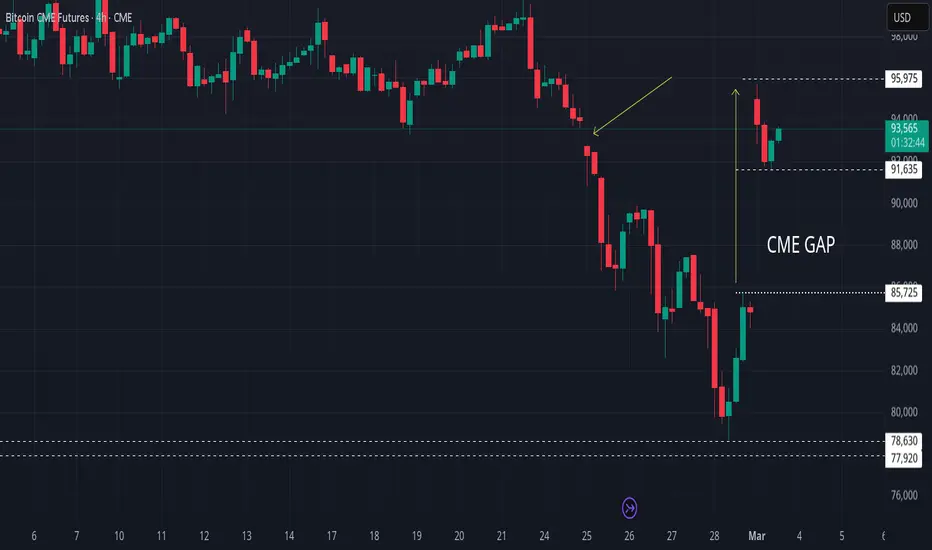
Bitcoin CME Gap Wars continue with a Bigger New Gap- what next ?
Last week we saw the Bitcoin PA Drop down and begin filling that existing CME gap, that had opened in Nov 2024
CME Gaps ALWAYS get filled I said. And they usualy do
PA got down to 78600 and bounced back up. It had NOT completely filled the Gap, leaving a gap from 78600 down to 77920.
This is a small gap But significant in that the BTC Bulls pushed PA up before the gap was filled....waving 2 fingers at he CME.
CME Closes for the Weekend and the price at close on Friday evening was around 85345
I thought we were going to see PA turn and drop back down to complete the Fill..I even had a Spot Buy order down there..
BUT NO - The Bulls arrived again and BANG-
When CME opened for the New weeks trading, Bitcoin was up at EXACTLY 95K
This had created a NEW gap, with the remains of the older one just below.
And so now, Whats next ?
Since then, PA dropped to 91635, Filling a more recent smaller gap and has since then, pushed back up higher.
When will the Bigger new Gap get filled ?
We have a number of possible scenarios and I think my preferred one is that we revisit the Lower levels, Fill the Gap and at the same time, continue to cool off that Still Bearish weekly MACD., whihc, once at Neutral, will have more than enough ability to push to s decent new Cycle ATH in Q4
Another option is that BTC PA ranges high, for Longer and Cools off that Weekly MACD, till around June, Leave the gap open for a later date
OR, PA Simply pushes to a New ATH now, exhausts itself and falls hard after, filling the Gap as it plunges to 65K or Lower.
Take your pick
The MACRO side of Xrypto now is noce but I do worry about how this cold all just make Bitcoin rise to Fast and go POP at the top
We need to continue the Slow Steady rise, maintain a balance and act like Adults..Not like Teenagers with a new Bag of Sweets.
Be REALLY careful righ tnow, But MAKE MONEY TOO But remain cautious.
This Gap WILL GET FILLED ONE DAY
Bitcoin's Reversal or Bull Trap? Decoding the Recent Price Surge📅 Date: March 3, 2025
📈 Asset: Bitcoin ( BINANCE:BTCUSD )
I. Market Overview: The Current Landscape
Bitcoin (BTC) has shown strong recovery after a sharp dip, currently trading around $92,070. This rebound raises the question: Is this a true reversal or a classic bull trap before another leg down?
Key macroeconomic factors influencing BTC include the Federal Reserve's monetary stance, ongoing institutional demand, and geopolitical tensions affecting global risk sentiment. With an increase in trading volume, traders are closely watching for confirmation of a bullish continuation.
II. Technical Analysis: Decoding the Charts
1. Daily Chart (D1) - Macro Trend Insights
Trend Analysis: Bitcoin rebounded from a low near $85,000, pushing above $92,000, indicating a possible bottom formation.
Support Levels: Strong support at $88,500, with deeper support at $85,000.
Resistance Levels: Immediate resistance at $94,500, with a major psychological level at $100,000.
RSI: At 38.62, showing that BTC was in an oversold condition but is now recovering.
MACD: Still in the bearish zone but showing signs of a possible crossover, which could indicate further upside.
Volume Analysis: A significant spike in volume, indicating strong buying interest in the dip.
2. 4-Hour Chart (H4) - Medium-Term Market Sentiment
Short-Term Trend: BTC has bounced aggressively from $85,000, forming a potential higher low structure.
RSI: 54.27, moving toward neutral-to-bullish territory.
MACD: Strong bullish crossover with momentum increasing.
Key Level to Watch: If BTC holds above $91,500, a move toward $94,500 is possible.
3. 1-Hour Chart (H1) - Intraday Trading Perspective
Short-Term Trend: BTC has surged above $92,000, showing strong intraday momentum.
RSI: 56.71, slightly overbought, suggesting some consolidation before another move.
MACD: Momentum is still bullish, but a minor correction could occur.
Volume Analysis: High buying volume indicates strong interest, but traders should watch for potential profit-taking.
III. Fundamental Analysis: Key Drivers Behind Bitcoin’s Movement
🔹 Macroeconomic Factors:
Federal Reserve Policy: A potential rate cut speculation is boosting risk appetite.
Institutional Buying: Large wallets and funds continue accumulating BTC.
Regulatory Developments: Positive sentiment from ETF flows is driving renewed interest.
🔹 On-Chain Metrics:
Whale Transactions: Large transactions suggest accumulation at lower levels.
Exchange Reserves: Bitcoin reserves on exchanges are declining, a bullish indicator.
IV. Market Sentiment Analysis: What Are Traders Thinking?
Fear & Greed Index:
Currently at 50 (Neutral), suggesting indecision but potential for bullish continuation.
Social Media & News Sentiment:
Increasing bullish discussions and calls for BTC hitting $100,000 soon.
Some skepticism remains over potential market manipulation.
V. Trading Strategy & Key Levels to Watch
1. Swing Trading Strategy
Entry (Buy) Zone: $90,500 - $91,500
Take Profit (TP) Levels:
First TP: $94,500
Second TP: $98,000
Stop Loss (SL): $89,000
2. Scalping Strategy (Short-Term)
Entry: Buy BTC above $92,000
Target: $93,500 - $94,500
Stop Loss: $90,500
3. Bearish Scenario (If BTC Drops Below $88,500)
Next Support Levels: $85,000 and $80,000
Potential Shorting Opportunity Below: $88,500 with TP at $85,000 and SL at $92,000
VI. Conclusion & Final Thoughts
Bitcoin’s recent recovery from $85,000 to $92,000 signals potential bullish strength, but traders should remain cautious of resistance near $94,500. If BTC holds above $91,500, we may see a continuation toward $100,000. However, a failure to maintain momentum could trigger another retest of $85,000.
📢 Follow FuInvest for Daily Market Insights!
👉 Stay updated with expert market analysis, trading strategies, and real-time signals to maximize your profits in the cryptocurrency market. 🚀🔥

Insane Growth Is Just Beginning For Bitcoin BTCHello, Skyrexians!
Recently we made two analysis on BINANCE:BTCUSDT . In the first one we pointed out that $80k is going to be the reversal point, in the second that bullish reversal bar has been confirmed at $85k. Now we are seeing how it is playing out. This is just the beginning of a pump. Here is why.
On the daily time frame we can see the green dot on the Bullish/Bearish Reversal Bar Indicator which has appeared when price bounced form. 0.5 Fibonacci. For us this is the clear sign that wave 2 has been finished and now Bitcoin is printing wave 3. This wave has the most realistic target next to $180k at 1.61 Fibonacci extension, but the strong resistance can be met at $140k.
Best regards,
Skyrexio Team
___________________________________________________________
Please, boost this article and subscribe our page if you like analysis!

Btcusd H1 outlook Target 95kBTCUSD is poised for a significant rebound after yesterday's pullback from $87,055. The current price of $80,474 represents a 50% Fibonacci correction level of the $52,600-$108,350 rise, providing a strong foundation for a bullish reversal.
Key points:
- The recent downturn has created a buying opportunity, with a potential target of $95,000.
- The $80,474 level serves as a crucial support, with a bounce expected to propel prices higher.
- The 50% Fibonacci correction level indicates a likely reversal, as the market seeks to retest recent highs.
- Bullish momentum is building, with a potential breakout above $87,055 paving the way for a rally to $95,000.
- Traders should be prepared to buy, as the current setup favors a significant upside move.
Best regards Travis ❤️

BTC Long Term OutlookWe may see a bullish correction to the upside - perhaps to 0.50 or 0.68 Fib retracement - and a strong a bearish impulse to the channel support area before a bullish continuation. This outlook could of course, turn out totally different.

Trump and Zelenskyy Clash | I Predicted BTC crash week ago
As I mentioned a week ago, Bitcoin (BTC) was poised for a correction, and we’ve now seen this play out over the past few days. On the 1D timeframe, Bitcoin tested its Fair Value Gap (FVG) and reversed from that zone. Today’s closing candle showed some bullish pressure, indicating a potential reversal toward the 90,000 – 92,000 range. The FVG was tested cleanly, and the reversal was strong.
What’s Next? Donald Trump and Zelenskyy Clash
While the market showed a healthy reversal from the FVG, recent news of a clash between Donald Trump and Zelenskyy at the White House has introduced uncertainty. Trump’s statement that “President Zelenskyy is not ready for peace” has created a negative sentiment in the market. If tensions escalate further, this could lead to a bearish impact on the market, as geopolitical instability often weighs on risk assets like Bitcoin.
Expected BTC Zones
Given the current situation, here are two possible scenarios:
Scenario 1: Bearish Impact from Geopolitical News
If the clash between Trump and Zelenskyy escalates and fear spreads in the market, Bitcoin could drop to the 73,500–76,000 zone in the coming days.
Scenario 2: Recovery Continues
If the news has a limited impact and the market stabilizes, Bitcoin could continue its reversal from the FVG and gradually move back toward the $92,000 zone.
Key Takeaways:
Trade with Caution:
Given the current geopolitical developments, it’s crucial to trade carefully and use stop losses to protect against sudden market moves.
Monitor News:
Keep an eye on further developments between Trump and Zelenskyy, as they could significantly influence market sentiment.
Note
My goal is to simplify the chart and help you understand the price action clearly. I avoid overloading the chart with unnecessary indicators or creating confusion. My analysis focuses on keeping the chart clean and straightforward.
Thank you!

BTCUSDT TRADING POINT UPDATE >READ THE CHAPTIAN Buddy'S dear friend 👋
SMC Trading Signals Update 🗾🗺️ crypto Traders SMC-Trading Point update you on New technical analysis setup for BTC USDT signals 🚀. BTC list 3 months. Drop 💧. moment close below 👇 big support level now. See tow Big support level. One said close that expect it buying or selling position. 80k close below 1D candle that expect more selling position 49k. ) if not close below 1D back up trand close above 82k 83k expect it more Bullish trend 📈 📈
Key Resistance level 104k
Key Support level 80k 49k
Mr SMC Trading point
Plaes support boost 🚀 analysis follow)

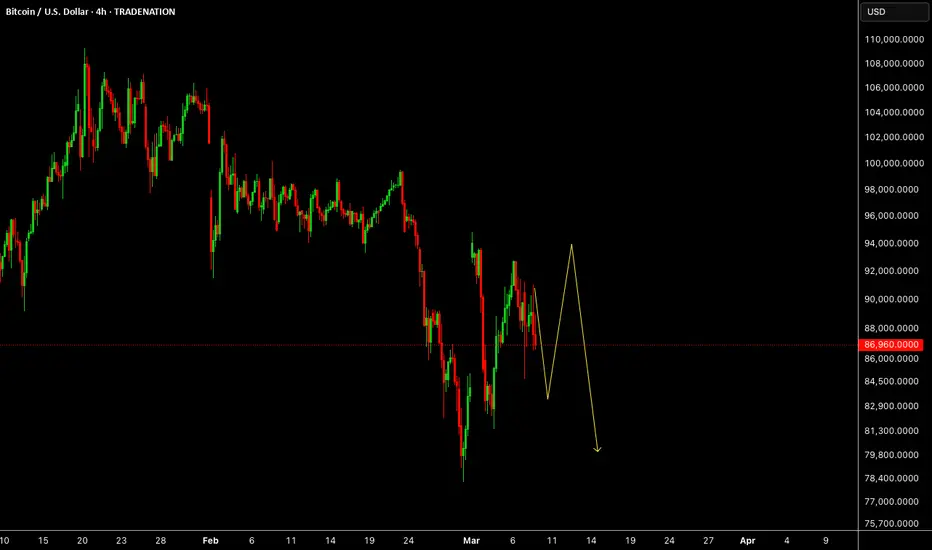
BTCUSDT, Bearish Scenarios for upcoming days ...Hello Traders, Hope you're great.
for Upcoming days, I anticipate 2 Bearish scenarios :
In First Scenario, I expect price does an upward correction to the nearest broken support level that became to an important supply zone around 91-93K and after that starts to drop.
in Second scenario, I expect price does a further upward correction and goes to the supply zone around 95-97K and after that start a major downward movement.
Targets are 85K, 82K and my final target is 77K.
Don't forget to use proper risk management.
And finally tell me what do you think about BTCUSDT, UP or DOWN ? comment your opinion below this post.

BTCUSDT 1WBTC ~ 1W Analysis
#BTC It's hard to say this, but this is the end.
We are still sure bullish isn't over yet.


Bitcoin Rebounds—But Is This the Start of a Rally or a Trap?Bitcoin has made a dramatic comeback, bouncing from $82,000 to over $86,000, after experiencing one of its sharpest declines in years. The move comes despite a $1 billion outflow from ETFs, with BlackRock alone offloading 4,200 BTC ($418M)—the largest single-day outflow recorded.
While some traders see this recovery as the start of a new bull run, others warn that it might be a classic bull trap, setting up for another sharp downturn. So, which is it?
The Case for a Bullish Reversal
📈 Demand Zone Approaching – Historically, major Bitcoin recoveries begin when traders’ realized losses hit -12%. Currently, it’s at -8.25%, suggesting BTC could be close to a bottoming phase.
📊 Strong Buying Interest – Bitcoin’s drop to GETTEX:82K triggered a surge in demand, showing that bulls are still active.
🔼 If BTC reclaims $100K, it could confirm a full reversal.
The Bearish Case: A Repeat of 2021?
📉 RSI Warning Sign – BTC’s weekly RSI is making lower highs, while price action is making higher highs—a pattern that preceded the 2021 bear market crash from $69K to $16K.
📌 Overleveraged Positions on Both Sides – Large liquidations are set up above $90K and below $80K, suggesting high volatility ahead.
🔽 If BTC fails to reclaim $100K, history suggests it could drop another 50%.
So, What’s Next for Bitcoin?
The next few days are critical. If BTC holds above $86K and reclaims $90K+, we could see a sustained recovery into Q2. But if selling pressure returns, Bitcoin could enter another downward spiral, with high volatility expected before the end of the month.
Are the bulls in control, or is this just a temporary bounce before another sell-off?

#BITCOIN DO OE DIE CONDITION!#BTC Market Update
BTC closed its daily candle well below the GETTEX:87K support, which is a bearish signal. Currently, it appears to be retesting this level.
If Bitcoin fails to reclaim GETTEX:87K + on a daily close, it could indicate further downside movement. However, if BTC manages a daily close above GETTEX:87K , this could be the last opportunity for bulls to regain control and push the market upward.
Keep an eye on the daily close for confirmation of the next major move.
Stay tuned for more updates.
DYOR, NFA
#Bitcoin

75k is INEVITABLE.I published my idea on BINANCE:BTCUSDT how it is forming Double Top pattern and indicators are making divergences in late January. Since BTC hit our first take profit point we might expect little bit of pullbacks and see if it is gonna react to 91k area, but Volume is not looking good that means we might see red candles all the way to 75k area. 75k area was major resistance zone which would work as support this time.

BTCUSDT Potentially BearishBINANCE:BTCUSDT took a really long time before finally loosing the 91,479.96 consolidation support zone, to this effect, I would expect to see price returning to retest that zone as a newly found resistance and if that holds, we just might see price dropping further to (potentially) the 70,000 area.
Results are not typical, do your due diligence before taking any trade as past results does not guarantee future results.
