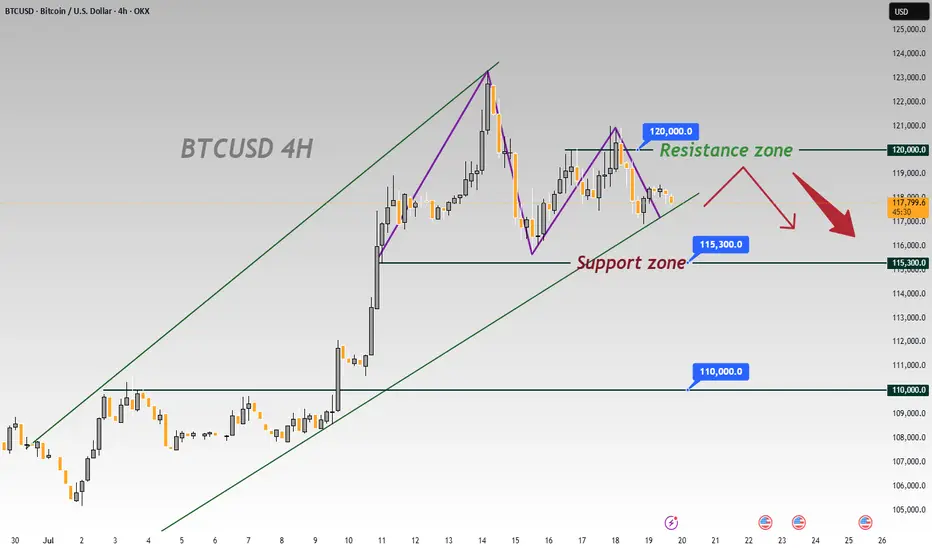
BTCUSD 4-Hour Chart Analysis: Range-Bound Trends & Key LevelsFrom the 4-hour chart of BTCUSD, the recent price movement shows obvious range-bound characteristics 📊. The upper zone around 120000 forms a key resistance level 🛑, where the bullish momentum has waned after encountering resistance 💨.
The lower level of 115300 is a significant support zone 🛡️. Previously, there was some buying support when the price retraced to this zone 👀. However, as the current price is pulling back from the resistance zone ↘️, if the bearish force takes the lead subsequently 🐻, the possibility of breaking below the 115300 support will increase ⬆️. Once it breaks below effectively 💥, the next key support level of 110000 will most likely become the target for the price to decline towards 🎯.
In terms of the short-term trend 📈, due to the obvious suppression from the resistance zone 🚧, the price will most likely continue the rhythm of testing the support downwards 🔽. In operation, one can pay attention to the breakdown situation of the support zone and layout trades accordingly 📝. Meanwhile, be alert to the possibility of a rebound after the price finds support in the support zone 🚀, and further confirmation of the direction needs to be combined with real-time K-line patterns 📊, trading volume 📈
🚀 Sell @119500 - 118500
🚀 TP 116500 - 115500
Accurate signals are updated every day 📈 If you encounter any problems during trading, these signals can serve as your reliable guide 🧭 Feel free to refer to them! I sincerely hope they'll be of great help to you 🌟 👇
Btcusdtanalysis
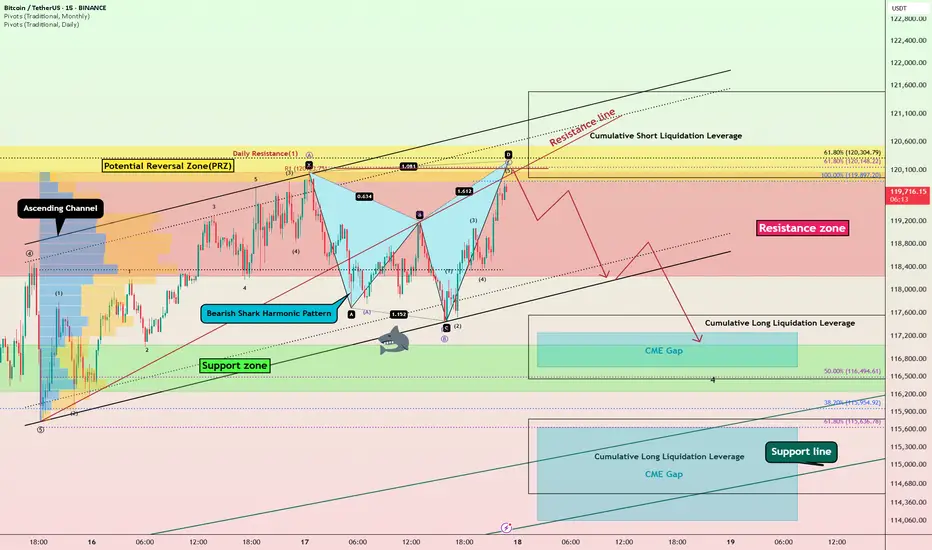
Bitcoin Bearish Shark Detected – CME Gap Below $115K in Sight?Today's analysis is on the 15-minute timeframe , following the previous analysis I shared with you on the 1-hour timeframe .
Bitcoin ( BINANCE:BTCUSDT ) is currently trading in the Resistance zone($120,100-$118,240) near the Potential Reversal Zone(PRZ) and Cumulative Short Liquidation Leverage($121,490-$119,965) .
From a technical perspective , it looks like Bitcoin is completing the Bearish Shark Harmonic Pattern on the 15-minute timeframe .
From an Elliott wave theory perspective, it looks like Bitcoin is completing the microwave 5 of wave C of the Zigzag Correction(ABC/5-3-5) .
I expect Bitcoin to start falling from the top of the ascending channel and at least decline to the lower line of the descending channel, and if the ascending channel breaks this time, we should wait for the CME Gap($117,255-$116,675)/CME Gap($115,060-$114,947) to fill.
Cumulative Long Liquidation Leverage: $117,556-$116,465
Cumulative Long Liquidation Leverage: $115,773-$114,513
Do you think Bitcoin can create a new ATH again?
Note: Stop Loss(SL)= $121,620
Please respect each other's ideas and express them politely if you agree or disagree.
Bitcoin Analyze (BTCUSDT), 15-minute time frame.
Be sure to follow the updated ideas.
Do not forget to put a Stop loss for your positions (For every position you want to open).
Please follow your strategy and updates; this is just my Idea, and I will gladly see your ideas in this post.
Please do not forget the ✅' like '✅ button 🙏😊 & Share it with your friends; thanks, and Trade safe.
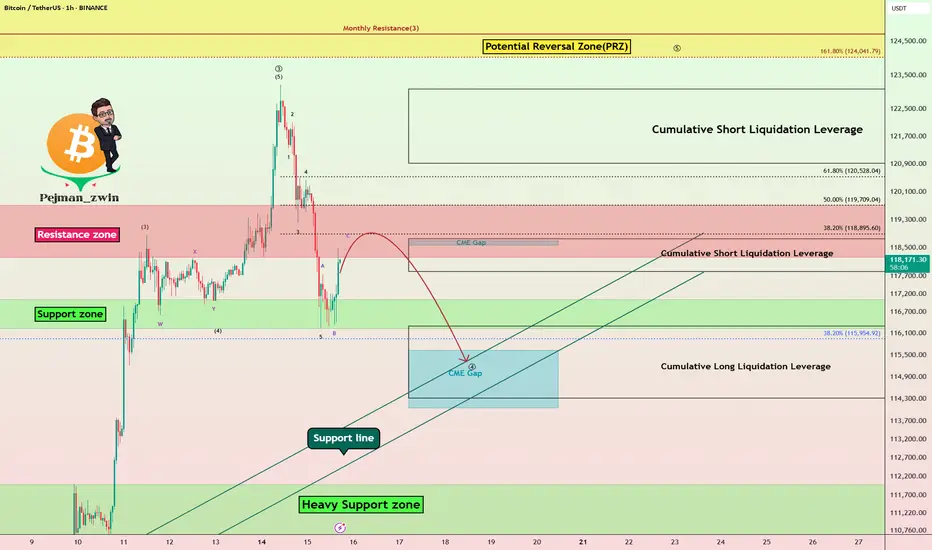
Bitcoin Struggles Below $120K:Will the CME Gap Pull Price Lower?Bitcoin ( BINANCE:BTCUSDT ) has been experiencing a high momentum bullish trend in recent days, which few people expected, especially when it crossed $120,000 . However, in the past 24 hours , Bitcoin has fallen back below $120,000 .
Bitcoin is currently trading in the Resistance zone($119,720-$118,240) and Cumulative Short Liquidation Leverage($118,757-$117,829) on the 1-hour time frame .
In terms of Elliott Wave theory , Bitcoin appears to be completing a main wave 4 . Main wave 4 is likely to have a Zigzag Correction(ABC/5-3-5) .
I expect Bitcoin to attack the Support lines and fill the CME Gap($115,060-$114,947) in the next hour.
Cumulative Short Liquidation Leverage: $123,087-$120,922
Cumulative Long Liquidation Leverage: $116,305-$114,325
Do you think Bitcoin can create a new ATH again?
Note: Stop Loss(SL)= $121,000
Please respect each other's ideas and express them politely if you agree or disagree.
Bitcoin Analyze (BTCUSDT), 1-hour time frame.
Be sure to follow the updated ideas.
Do not forget to put a Stop loss for your positions (For every position you want to open).
Please follow your strategy and updates; this is just my Idea, and I will gladly see your ideas in this post.
Please do not forget the ✅' like '✅ button 🙏😊 & Share it with your friends; thanks, and Trade safe.
BTC/USDT Heist Mode: Buy Low, Escape Rich🏴☠️"Bitcoin vs Tether" Crypto Market Robbery Blueprint 🔥 | Thief Trading Style (Swing/Day Plan)
🌍 Hey Money Makers, Chart Hackers, and Global Robbers! 💰🤑💸
Welcome to the new Heist Plan by your favorite thief in the game — this time targeting the "Bitcoin vs Tether" Crypto Market like a smooth criminal on the charts. 🎯📊
This is not your average technical analysis — it's a strategic robbery based on Thief Trading Style™, blending deep technical + fundamental analysis, market psychology, and raw trader instincts.
💼 THE SETUP — PREPARE FOR THE ROBBERY 🎯
We're looking at a bullish operation, setting up to break into the high-value vaults near a high-risk, high-reward resistance zone — beware, it's a high-voltage trap area where pro sellers and bearish robbers set their ambush. ⚡🔌
This plan includes a layered DCA-style entry, aiming for max profit with controlled risk. Chart alarms on, mindset ready. 🧠📈🔔
🟢 ENTRY: "The Robbery Begins"
📍 Zone-1 Buy: Near 116200.00 after MA pullback
📍 Zone-2 Buy: Near 112600.00 deeper pullback
🛠️ Entry Style: Limit Orders + DCA Layering
🎯 Wait for MA crossover confirmations and price reaction zones — don’t chase, trap the market.
🔻 STOP LOSS: "Plan the Escape Route"
⛔ SL for Pullback-1: 113000.00 (2H swing low)
⛔ SL for Pullback-2: 110000.00
📌 SL placement depends on your position sizing & risk management. Control the loss; live to rob another day. 🎭💼
🎯 TARGET ZONE: “Cash Out Point”
💸 First TP: 127000.00
🏁 Let the profit ride if momentum allows. Use a trailing SL once it moves in your favor to lock in gains.
👀 Scalpers Note:
Only play the long side. If your capital is heavy, take early moves. If you’re light, swing it with the gang. Stay on the bullish train and avoid shorting traps. Use tight trailing SL.
🔎 THE STORY BEHIND THE HEIST – WHY BULLISH?
"Bitcoin vs Tether" shows bullish momentum driven by:
💹 Technical bounce off major support
🌏 Macroeconomic & geopolitical sentiment
📰 Volume + sentiment shift (risk-on)
📈 Cross-market index confirmation
🧠 Smart traders are preparing, not reacting. Stay ahead of the herd.
👉 For deeper insight, refer to:
✅ Macro Reports
✅ COT Data
✅ Intermarket Correlations
✅ CHINA-specific index outlooks
⚠️ RISK WARNING – TRADING EVENTS & VOLATILITY
🗓️ News releases can flip sentiment fast — we advise:
❌ Avoid new positions during high-impact events
🔁 Use trailing SLs to protect profit
🔔 Always manage position sizing and alerts wisely
❤️ SUPPORT THE CREW | BOOST THE PLAN
Love this analysis? Smash that Boost Button to power the team.
Join the Thief Squad and trade like legends — Steal Smart, Trade Sharp. 💥💪💰
Every day in the market is a new heist opportunity — if you have a plan. Stay tuned for more wild robbery blueprints.
📌 This is not financial advice. Trade at your own risk. Adjust based on your personal strategy and capital. Market conditions evolve fast — stay updated, stay alert.

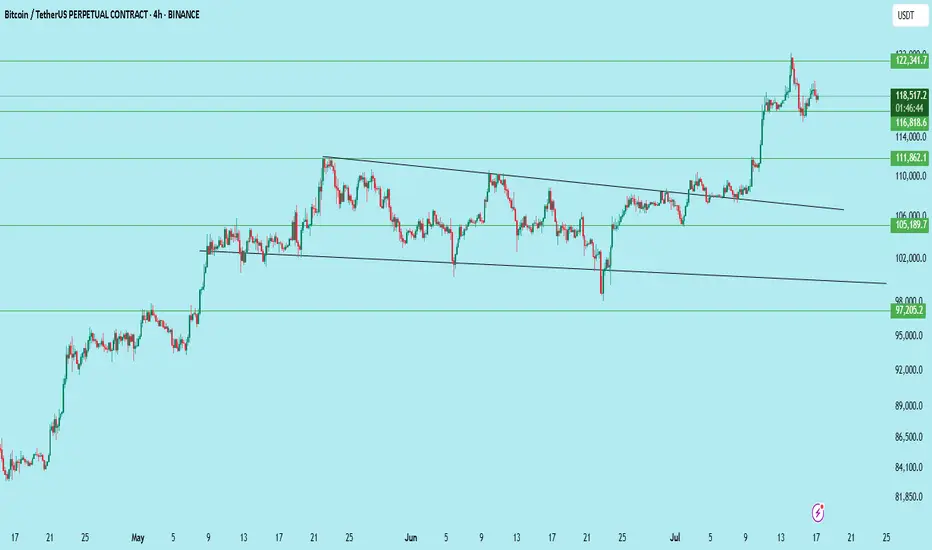
#BTCUSDT | Massive Breakout – Now What?Bitcoin has broken out of a multi-week descending wedge on the 4H chart — a classic bullish reversal pattern. Price is now consolidating just above $116,818 support, forming a base for the next leg up.
What Just Happened:
Clean breakout above the wedge resistance
Strong momentum candle above $111,862
Immediate rejection near $122,341
Currently retesting the previous breakout zone
Key Levels:
Resistance: $122,341
Support: $116,818 → key short-term level
Breakout Support: $111,862
Deeper Support: $105,189
Invalidation Level: $97,205
Bullish Outlook:
If BTC holds $116,818 and breaks above $122,341 with volume, the next leg could extend toward $128,000–$132,000.
Bearish Risk:
Losing $116,818 with volume → look for retest near $111,862 or even $105,189 for a stronger bounce.
Bias:
Bullish above $116,818 — watching for consolidation before continuation.
Trade Setup (if planning to enter):
Entry on retest of $116,818–$117,000
SL: Below $114,000
TP1: $122,341
TP2: $128,000
TP3: $132,000
DYOR | Not Financial Advice
Bitcoin -> The bullrun is not over!📣Bitcoin ( CRYPTO:BTCUSD ) is still totally bullish:
🔎Analysis summary:
A couple of months ago Bitcoin broke above the previous all time high. This was basically just the expected creation of new highs, perfectly following the underlying cycles. With respect to the long term rising channel formation, this bullrun on Bitcoin is just starting.
📝Levels to watch:
$100.000
🙏🏻#LONGTERMVISION
Philip - Swing Trader

#BTCUSDT(BITCOIN): Another Small Correction And Bounce Straight Bitcoin reached a record high of 125k, but then its price started to drop and is currently trading at 115k. We expect the price to reverse from the 110k area and continue its bull move towards the potential next target of 150k. Keep an eye on the price to see if it falls below our area of interest.
Good luck and trade safely!
Team Setupsfx_
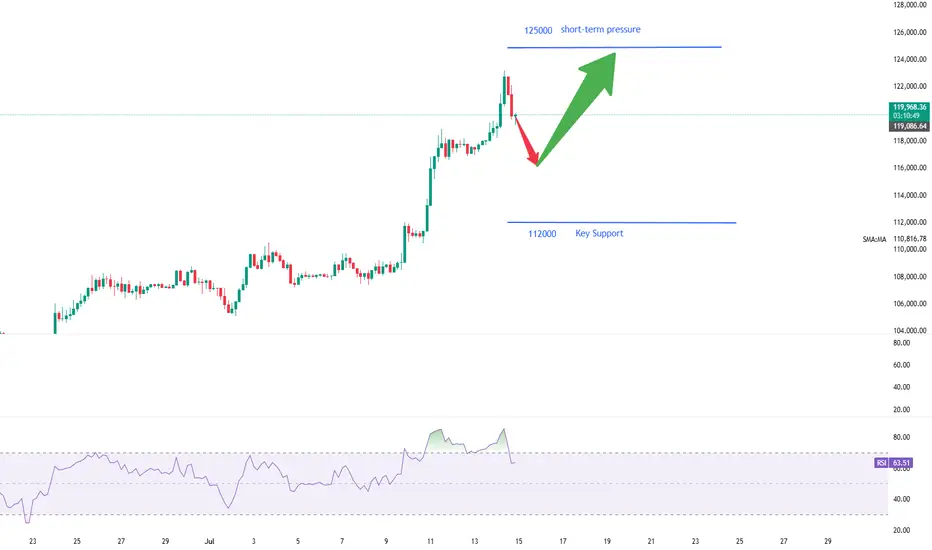
Analysis of the Latest Bitcoin Market。On July 14, Bitcoin's price surged sharply, with the highest level reaching $123,100. This breakthrough ended its eight-month-long consolidation phase within the $90,000 - $110,000 range.
The U.S. House of Representatives designated the week of July 14 as "Crypto Week" and plans to deliberate on a number of key bills. Among them, the Guiding and Establishing America's Stablecoin National Innovation Act aims to formulate federal regulations for stablecoins and is regarded as a "landmark legislation" in the cryptocurrency sector. The market expects the cryptocurrency industry to usher in policy dividends.
Market analysts are relatively optimistic about Bitcoin's prospects. The $125,000 level is seen as the next key psychological threshold, and a breakthrough above it would open up greater upside potential. Standard Chartered Bank predicts that Bitcoin will challenge $200,000 by the end of the year. Although the Relative Strength Index (RSI) is at a high level, there is no obvious overbought signal. The moving average system is clearly aligned, and the support level has moved up to $112,000. The market consensus holds that "any pullback represents a buying opportunity."
you are currently struggling with losses,or are unsure which of the numerous trading strategies to follow,You have the option to join our VIP program. I will assist you and provide you with accurate trading signals, enabling you to navigate the financial markets with greater confidence and potentially achieve optimal trading results.
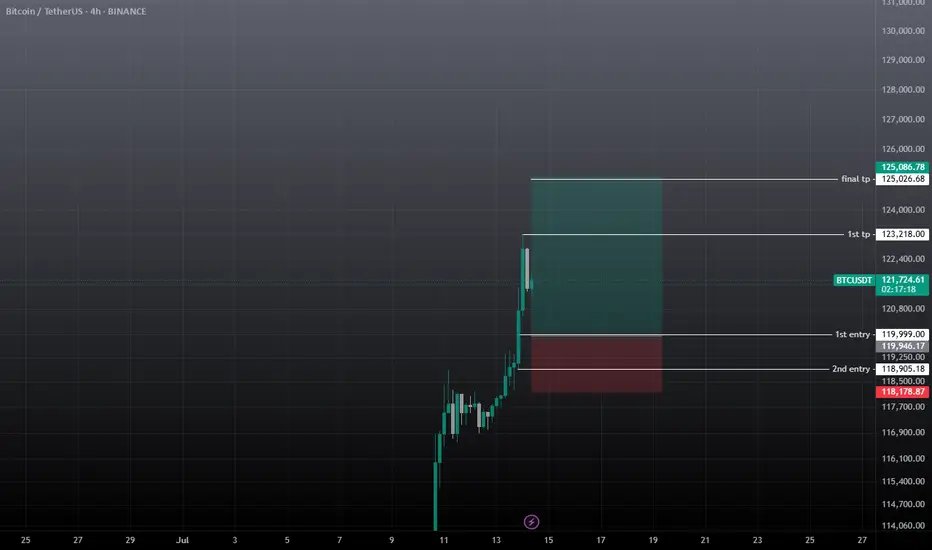
BTC BUY / LONG SCALP TRADEWait for the entry to be filled, must use SL and don't use high margin on any trade. If TPs achieved first then ignore the trade.

btcusdt buy / long scalp setupWait for the entry and must use sl on all trades, if tp achieves first then ignore it.
BTC/USD Heist Mode: Buy Low, Escape Rich🔓 BTC/USD Crypto Vault Breach: Thief Strategy for Long Entry Robbery (Swing/Day Setup) 🔓
🌟Hi! Hola! Ola! Bonjour! Hallo! Marhaba!🌟
Dear Money Makers & Robbers, 🤑💰💸✈️
🚨 Welcome to our next Thief Trading-style breakout mission — this time targeting the mighty BTC/USD vault. Using a fusion of technical precision and macro-level insight, we're charting a long entry blueprint for a profitable heist.
🔑 Entry Plan
"The vault is open!" 💥
Buy at current price or set Buy Limit near swing lows (15–30min timeframe pullback entries). We're timing the entry with stealth—precision over panic.
🛑 Stop Loss Setup
SL set near recent swing low (4H TF reference: ~104.000).
Adjust based on position sizing, risk appetite & multi-order tactics.
🎯 Take Profit Target
Targeting 115.000—or exit earlier if price action stalls. Get in, get out. Efficiency is the code.
👀 Scalpers' Notice
Only work the Long side. If your bag’s heavy, strike instantly. If light, ride with swing robbers. Use trailing SLs to protect your bag.
📈 Why We’re Bullish
Market momentum favors the bulls:
Overbought zones acting as lures
Bearish traps ready to flip
Key confluences from sentiment, COT, on-chain & macro analysis
➡️ Full supporting breakdown available 👉👉🔗🔗.
📢 Risk Note – Stay Sharp
Major news events = increased volatility ⚠️
Avoid entries during news. Trail stops to protect running profit. Rob smart.
💖 Boost the Crew
If this blueprint aligns with your mission, hit that Boost button. It fuels the team, and together, we profit like pros. One heist at a time. 💪🎉
🧠 Stay ready—next plan drops soon. Until then, rob safe, rob smart. 🐱👤
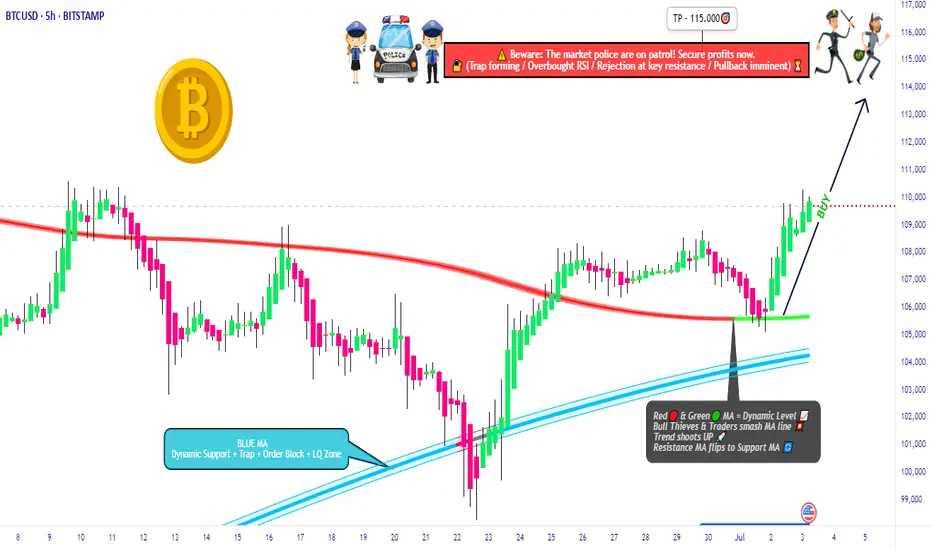
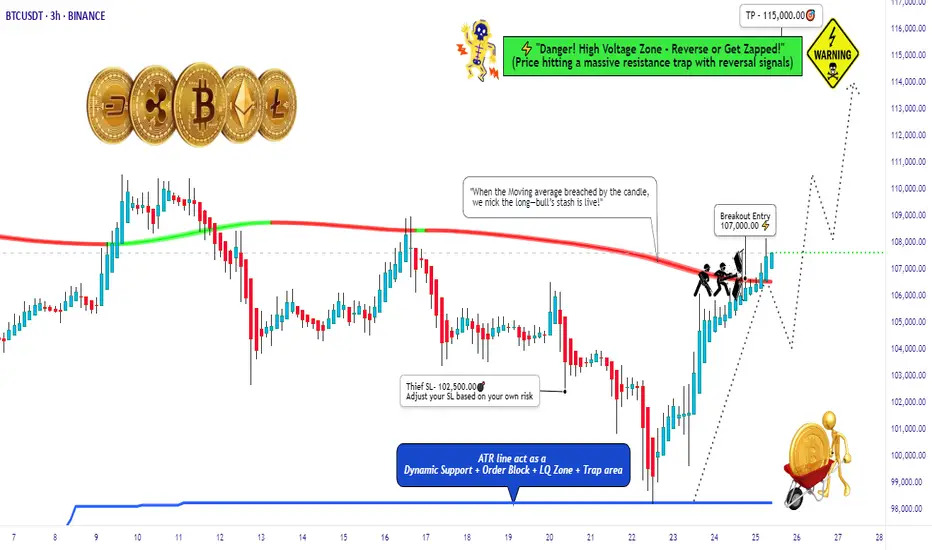
BTC/USD Thief Breakout at $107K – Eyeing $115K!🚨 Thief Entry Setup: BTC/USD Breakout Play 🚨
Overview:
Jump in after the $107 000 breakout—aiming for $115 000 with a tight “Thief SL” at $102 500. Adjust the stop‑loss to match your personal risk tolerance.
🧠 Setup Summary
Pair: BTC/USD
Entry trigger: Breakout above $107 000
Stop‑Loss: “Thief SL” at $102 500 (use your own risk‑based SL)
Target: $115 000
🎯 Why This Setup?
Clear breakout level at $107 000 = fresh momentum
Tight SL cushion (≈‑4.3%) = defined risk
Target ≈ +7.5% potential = strong reward-to-risk (~1.75:1)
📏 Risk Management Tips:
Only risk a small % of your capital—never exceed your comfort zone.
Move your SL to breakeven once mid‑target is hit to lock in profits.
Trailing your stop‑loss could secure bigger gains if BTC surges toward $115 000.
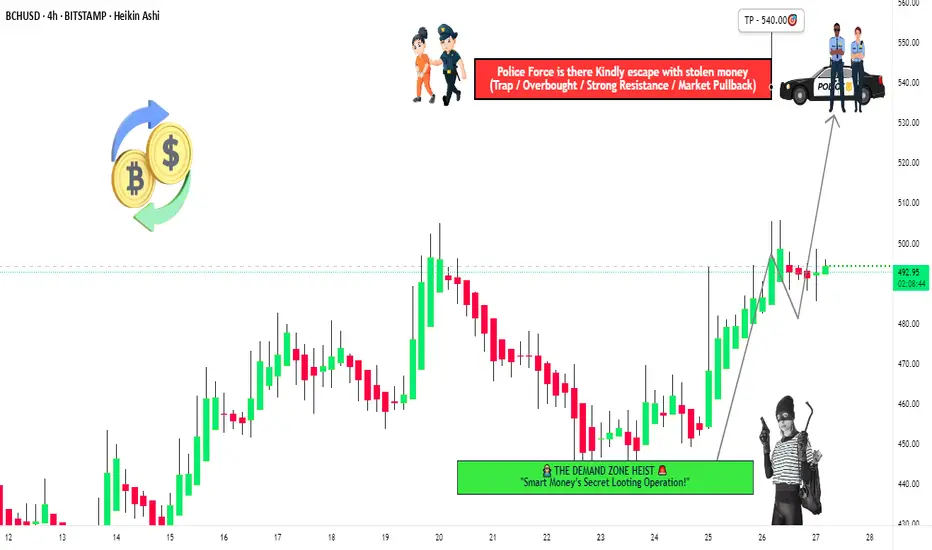
"BCH/USD Heist Mode: Enter Long, Exit Before Bears Strike!🚨 BCH/USD HEIST ALERT: Bullish Loot & Escape Plan! (Thief Trading Style) 🚨
🌟 Greetings, Market Bandits & Profit Pirates! 🌟
(Hola! Oi! Bonjour! Hallo! Marhaba!)
🔥 Mission Briefing:
Based on Thief Trading tactics (TA + FA), we’re plotting a bullish heist on BCH/USD. Time to swipe the loot & escape before the cops (bears) show up!
🔓 ENTRY: "The Vault is Open!"
📈 Buy Zone: Retest of recent low/high (15-30min timeframe).
💡 Pro Tip: Use limit orders for precision—don’t chase!
🛑 STOP LOSS: Live to Steal Another Day
📍 Thief SL: Recent swing low (~440.00 on 4H TF).
⚠️ Adjust based on your risk, lot size, & multi-order strategy.
🎯 TARGET: 540.00 (or Bail Early!)
🏴☠️ Escape before the red zone (overbought, reversal risk, bear traps!).
💰 "Take profit & treat yourself—you earned it!"
📢 WHY THIS HEIST? (Bullish Catalysts)
✅ Fundamentals: Strong macro + sentiment.
✅ Technicals: Pullback entry + bullish structure.
✅ Intermarket trends: Crypto momentum favors bulls.
(For full intel—COT reports, on-chain data, sentiment—check 👉🔗🔗!)
🚨 NEWS ALERT: Avoid the Police (Volatility Traps!)
🔹 Avoid new trades during high-impact news.
🔹 Trailing stops to lock profits & dodge reversals.
💥 BOOST THIS HEIST! (Let’s Get Rich Together!)
👍 Smash that "Like" & "Boost" button to fuel our next robbery!
🚀 Follow for daily heist plans—easy profits await!
See you at the next heist, bandits! 🤑💎
Are we on Super Bullish Express Highway ? Elliott Waves RoadmapHello friends,
Welcome to RK_Chaarts
Today we're attempting to analyze Bitcoin's chart, specifically the BTCUSD chart, from an Elliott Wave perspective. Looking at the monthly timeframe chart, which spans the entire lifetime of Bitcoin's data since 2011, we can see the overall structure. According to Elliott Wave theory, it appears that a large Super Cycle degree Wave (I) has completed, followed by a correction in the form of Super Cycle degree Wave (II), marked in blue.
Now, friends, it's possible that we're unfolding Super Cycle degree Wave (III), which should have five sub-divisions - in red I, II, III, IV, & V. We can see that we've completed red I & II, and red III has just started. If the low we marked in red II doesn't get breached on the lower side, it can be considered our invalidation level.
Next, within red III, we should see five primary degree sub-divisions in black - ((1)), ((2)), ((3)), ((4)) & ((5)). We can see that we've completed black ((1)) & ((2)) and black ((3)) has just started. Within black ((3)), we should see five intermediate degree sub-divisions in blue - (1) to (5). Blue (1) has just started, and within blue one, we've already seen red 1 & 2 completed, and red 3 is in progress.
So, we're currently in a super bullish scenario, a third of a third of a third. Yes, the chart looks extremely bullish. We won't commit to any targets here as this is for educational purposes only. The analysis suggests potential targets could be very high, above $150,000 or $200,000, if the invalidation level of $98,240 isn't breached. But again, friends, this video is shared for educational purposes only.
Many people think that the market doesn't move according to Elliott Waves. But friends, here we've tried to analyze from the monthly time frame to the overly time frame. We've definitely aligned the multi-time frame and also aligned it with the principal rules of Elliott Waves, without violating any of its rules.
I agree that the Elliott Wave theory can be a bit difficult, and for those who don't practice it deeply, it can be challenging. But yes, the market moves according to this methodology, following this pattern. This is a significant achievement.
I am not Sebi registered analyst.
My studies are for educational purpose only.
Please Consult your financial advisor before trading or investing.
I am not responsible for any kinds of your profits and your losses.
Most investors treat trading as a hobby because they have a full-time job doing something else.
However, If you treat trading like a business, it will pay you like a business.
If you treat like a hobby, hobbies don't pay, they cost you...!
Hope this post is helpful to community
Thanks
RK💕
Disclaimer and Risk Warning.
The analysis and discussion provided on in.tradingview.com is intended for educational purposes only and should not be relied upon for trading decisions. RK_Chaarts is not an investment adviser and the information provided here should not be taken as professional investment advice. Before buying or selling any investments, securities, or precious metals, it is recommended that you conduct your own due diligence. RK_Chaarts does not share in your profits and will not take responsibility for any losses you may incur. So Please Consult your financial advisor before trading or investing.

BTCUSD LONG TERMBTCUSD Live Trading Session/ BTCUSD analysis #forex #forextraining #forex
Hello Traders
In This Video BTCUSD HOURLY Forecast By World of Forex
today BTCUSD Analysis
This Video includes_ (BTCUSD market update)
BTCUSD Analysis today | Technical and Order Flow
#usdjpy #usdchftechnicalanalysis #usdjpytoday #gold
What is The Next Opportunity on BTCUSD Market
how to Enter to the Valid Entry With Assurance Profit?
This Video is For Trader's that Want to Improve Their Technical Analysis Skills and Their Trading By Understanding How To Analyze The Market Using Multiple Timeframes and Understanding The Bigger Picture on the Charts.
Disclaimer: Financial Trading Has Large Potential Rewards, But Also Large Potential Risk. You must be aware of the Risk and Be Welling to Accept Them in order to Trade the Financial Market . Please be Carefully With Your Money.
We are talking about future market, anything can Happen,Markets are Always like that.dnt Risky more Than 2% of your account
Now you can join with our "vip premium" service
Join us and let's make trading together


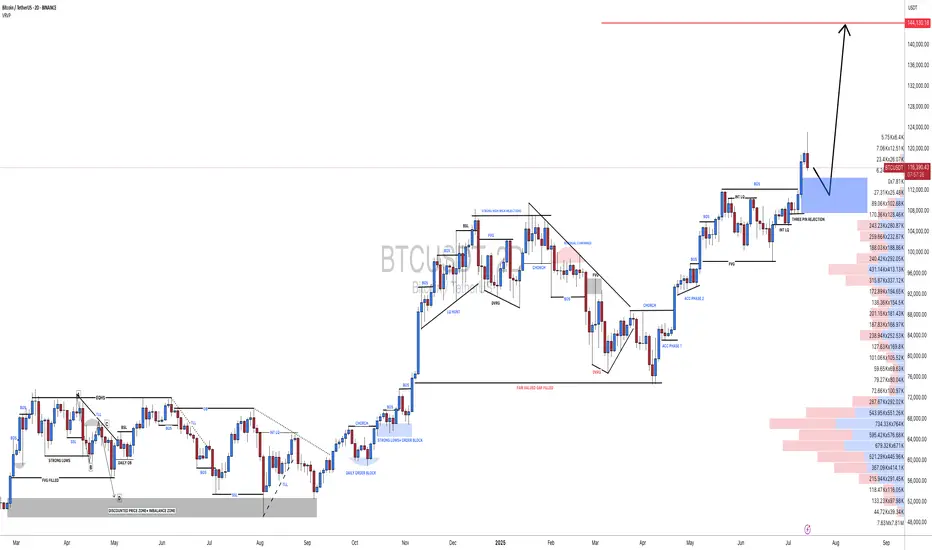
BTCUSDT[BITCOIN]:Price is Likely to be Heading Towards $144,000.Recently, Bitcoin has shown extreme bullish price behaviour, and there’s no sign of bearish influence in the market. After monitoring the price since May 4th, we believe there’s a high possibility of price hitting the 120k region first. This could be followed by a small correction around 105k, where a strong bullish price influence will lead the price to our final target at 140k. Both fundamental and technical factors support this view, but it doesn’t guarantee the price will follow our expectations.
Before investing or trading cryptocurrencies, do your own research as they carry significant financial risk. This chart analysis is for educational or secondary purposes only.
Good luck and trade safely.
If you want to support and encourage us, you can do the following: ❤️
-Like the idea
-Comment the idea
-Share ;)
Team Setupsfx_

#BTCUSDT(BITCOIN): Two Targets First $130,000 And Then $150,000Bitcoin is poised for significant distribution, with a potential price surge to $130,000, followed by a swing target of $150,000. The current accumulation phase is poised to transition into a substantial bullish move. We anticipate a surge in bullish volume in the coming days or weeks. Our analysis anticipates this transition to be completed by the end of the year or sooner.
It is important to note that this analysis does not guarantee a specific price movement and is provided solely for educational purposes.
We extend our best wishes for your successful trading endeavours. If our analysis has been of assistance, we would appreciate it if you could express your gratitude by liking and commenting.
For further insights, please follow our account.
Team Setupsfx_

#BITCOIN: Accumulated Volume, Time For $150,000Bitcoin has accumulated nicely, but we don’t expect the price to distribute strongly towards $150k. We have set two targets: 125k and a swing target at 150k. Remember to have a confirmation before entering.
Good luck and trade safely,
Team Setupsfx_

#BTCUSDT: Major Bearish Correction?Bitcoin is currently undergoing a correction following its recent peak. While the initial price decline appeared insignificant, it has since experienced a substantial drop, suggesting a substantial volume of selling activity in the market.
We anticipate two potential areas where the price could reverse and resume its upward trajectory. These areas could lead to a price of 110,000, followed by 120,000, and ultimately reaching 150,000.
We strongly recommend that you implement rigorous risk management measures and conduct your own analysis before making any investment decisions.
Best regards,
Team Setupsfx_

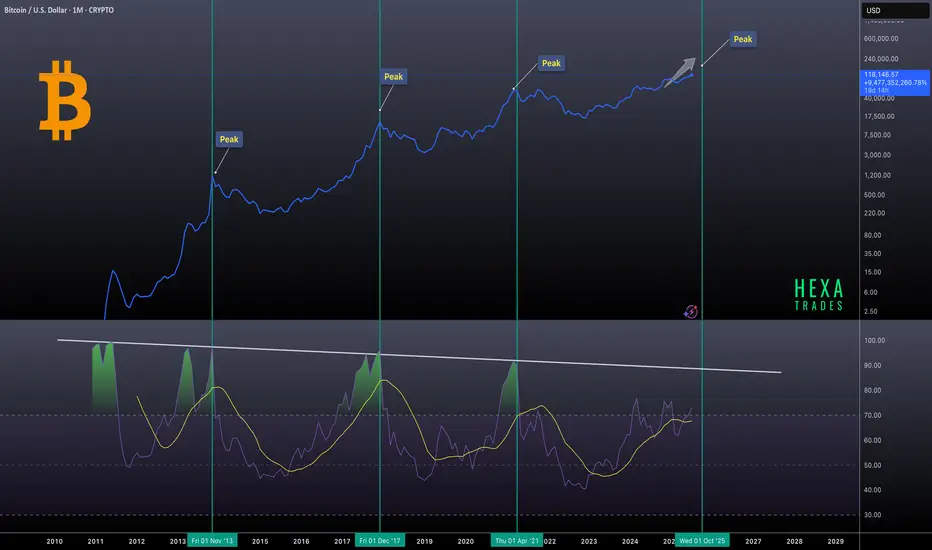
Bitcoin Macro Cycles: Sell Signal at RSI 90Bitcoin’s historical market cycles, using monthly RSI data to identify previous bull market peaks. Notable tops in 2013, 2017, and 2021 are highlighted, with the next potential peak projected around October 2025. A consistent pattern emerges where each market top aligns with the monthly RSI reaching or nearing the 90 level, indicating extremely overbought conditions.
Sell when the monthly RSI hits 90. This has consistently marked previous market tops and can serve as a reliable signal for long-term investors.
Can Bitcoin see $120,000?
Hi My Dears
If the Bitcoin price closes above $106,602, we can be optimistic about the specified targets.
I think Bitcoin has the potential to reach $120,000. We just have to wait.

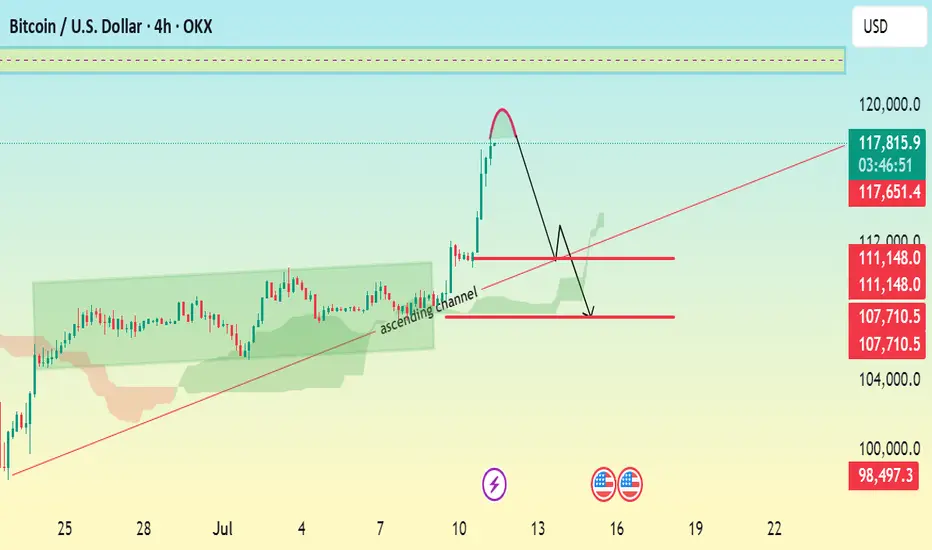
BTC/USD 4H CHART ANALYSIS \ BEARISH CORRECTION EXPECTED.Current Price: $117,755
Trend: Recently bullish, now facing a potential correction
Chart Pattern: Breakout above ascending channel, followed by a sharp projected correction.
🔍 Technical Breakdown:
> Ascending Channel:
Price was respecting an ascending channel (highlighted in green).
A bullish breakout occurred with strong momentum.
> Sharp Rejection & Correction Setup:
After the breakout, a steep rally seems to have peaked.
The red curved arrow suggests a completed bullish impulse, now setting up for a bearish correction.
> Key Levels:
Resistance Zone: $118,000 – $120,000
Immediate Support: $111,150
Next Major Support: $107,700
Bearish Target Support: $105,945
🎯 Trade Setup Suggestion:
Short Entry Zone: Around $111,150 if price gets rejected there.
Target: $105,945
Stop-Loss: Above $112,000 (tight risk control)