Bitcoin - Inverse Head & Shoulders on 4h (Neckline broken)Looking forward to a new ATH shortly IF the neckline holds.
BITSTAMP:BTCUSD
BINANCE:BTCUSD
COINBASE:BTCUSD
CRYPTOCAP:TOTAL
CRYPTOCAP:OTHERS
BINANCE:ETHUSD
COINBASE:ETHUSD
BINANCE:SOLUSD
OANDA:XAUUSD
FX_IDC:XAUUSD
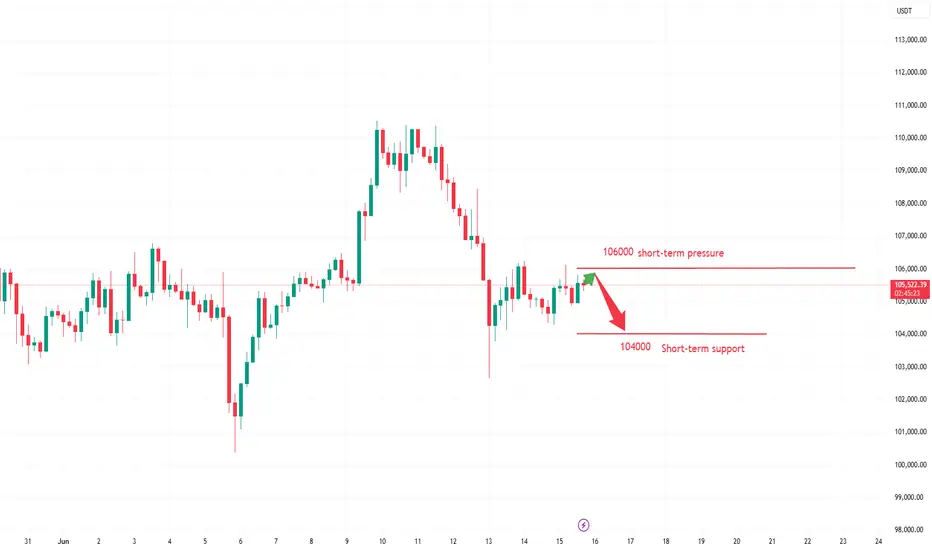
Btcusdtanalysis

Analysis of Next Week's Market TrendsBitcoin is trading in a narrow range, with an intraday volatility of only 1.7% and trading volume shrinking by 18%, indicating market wait-and-see sentiment after key geopolitical events.
After the Israel-Iran conflict triggered $1 billion in liquidations, market panic has eased. Israel's preemptive strike on Iran on the 13th caused Bitcoin to flash crash to $102,000, but by the 15th, the market had partially digested the risks. The Fear & Greed Index stabilized at 60 (greed zone), showing that funds did not massively flee to safe havens.
Bitcoin is in a critical accumulation phase on the eve of a breakthrough. The digestion of geopolitical risks and institutional buying constitute supporting forces, but short-term attention should be paid to the risk of breakdown in the triangular pattern. It is recommended to strictly guard the defense level of $104,200 and the breakthrough point of $106,300.
Humans need to breathe, and perfect trading is like breathing—maintaining flexibility without needing to trade every market swing. The secret to profitable trading lies in implementing simple rules: repeating simple tasks consistently and enforcing them strictly over the long term.
Trading Strategy:
sell@105900-106000
TP:104000-1045000
Middle East Tensions Drive Capital Shift: BTC May Test 100K SupCurrently, we can clearly see that BTC is in a downward trend 🔻. Due to the tense situation in the Middle East 😰, a large amount of capital has flowed into gold and crude oil markets. BTCUSD is likely to continue its downward movement on Monday ⬇️. Let's focus on the support level at 100,000. If it breaks below 100,000, it may continue to decline ⚠️.
⚡️⚡️⚡️ BTCUSD ⚡️⚡️⚡️
🚀 Sell@ 106500 - 105500
🚀 TP 102000 - 101000
Accurate signals are updated every day 📈 If you encounter any problems during trading, these signals can serve as your reliable guide 🧭 Feel free to refer to them! I sincerely hope they'll be of great help to you 🌟 👇

BTC/USD – Bearish Continuation from Rising Channel BTC/USD – Bearish Continuation from Rising Channel 🚨🧱
This chart indicates a bearish market structure with the following key technical features:
🔍 Chart Analysis:
Change of Character (CHoCH) 🔄
A shift from bullish to bearish was confirmed by a strong breakdown after the CHoCH marked at the top.
This breakdown invalidated previous bullish structure.
Bearish Flag Formation 📉📐
After the impulsive drop, price formed a bearish flag (rising channel), suggesting a potential continuation move to the downside.
Resistance Rejection 🚫
Price is currently testing and rejecting the 105,800–106,500 resistance zone, previously a support turned resistance.
The rejection from this level adds further bearish confluence.
Downside Projection ⬇️📍
If the pattern plays out, the projected move shows a potential drop toward the major support zone at 100,000–101,000.
📌 Key Levels:
Resistance Zones:
105,800–106,500 🧱
109,500–111,000 🧱
Support Zone:
100,000–101,000 💚
🧠 Conclusion:
The chart suggests that BTC/USD is in a bearish continuation phase, with strong rejection from key resistance and a confirmed breakdown from a bearish flag. Traders should watch for confirmation of continuation below 104,500 to target the 100k support level. Risk management is crucial near volatile zones.

BTC/USD Technical Outlook – Potential Bearish Continuation BelowBTC/USD Technical Outlook – Potential Bearish Continuation Below Resistance 📉🧊
Chart Overview:
The chart illustrates a clear bearish rejection from a major resistance zone (⚠️ 110,000–111,000 USD), followed by the emergence of a bearish engulfing candle 🔻 marked in orange. This move suggests selling pressure has returned after a short-term bullish rally.
Key Zones & Levels:
🔵 Resistance Zone: 110,000–111,000 USD
Price was rejected from this region with a strong bearish reaction.
🟣 Mid-level Support: 105,531 USD
Currently acting as an interim level — if broken, it may lead to deeper declines.
🔵 Support Zone: 100,500–101,500 USD
This is the next strong demand area — price previously rebounded strongly from here.
Technical Signals:
✅ Double Top Structure formation at the resistance zone, indicating trend exhaustion.
❌ Bearish Engulfing Candle near resistance, confirming reversal strength.
📉 Downward Momentum Arrow suggests possible continuation toward support.
🔻 Lower Highs Formation reinforces bearish sentiment after failed breakout attempts.
Projection 🎯:
If the price closes below 105,531, a bearish continuation is likely, targeting the support zone at 101,000–100,500.
Conversely, a strong bounce above this level could delay the drop, but upside is capped below 110,000 unless a breakout occurs.
Summary:
🧭 Bias: Bearish below 105,531
📍 Targets:
Immediate: 105,531 (key level)
Bearish Target: 101,000
Invalidated if: price reclaims and closes above 110,000 with strength
📊 Trader's Note: Look for confirmation of breakdown with volume or candle close before short entry. Set tight risk management due to volatility.

BTCUSDT – Bearish signs emerge below resistanceAfter a strong bullish run, BTCUSDT is now showing clear signs of weakness near the resistance zone around 109,600–112,000. Price action has formed a cluster of rejection candles at the top, failing to break above this key level – signaling that selling pressure is gaining control.
The current structure suggests a potential trend reversal, especially as the latest bearish candle came with rising volume, confirming selling interest from the supply zone. If the price breaks below the 101,500 support, BTC may continue dropping toward the 93,500–84,500 range – a high-liquidity area on the volume profile.
The previous bullish momentum appears to have lost strength, and this pullback may be confirming a shift after reaching its upper limit. As long as BTC remains below the 112,000 resistance, the bearish bias remains dominant.

"Accumulation Phase for Breakout"Bitcoin underwent high-level consolidation on June 11, with intraday volatility ranging from $108,800 to $110,200. It failed to effectively break through the previous high of $111,980. The 24-hour global liquidations amounted to $210 million (half of the previous day), with short positions accounting for 62%, indicating that bears still dominate short-term sentiment.
The Sino-US high-level talks in London originally scheduled for June 11 have been postponed to June 15, and the details of tariff reductions remain unclear, leading to a decline in risk asset appetite. The US Dollar Index rebounded by 0.8%, suppressing Bitcoin's breakthrough momentum. Bitcoin is currently in a accumulation phase for breaking through all-time highs, with policy regularization and institutional increasing holdings forming long-term support.
Humans need to breathe, and perfect trading is like breathing—maintaining flexibility without needing to trade every market swing. The secret to profitable trading lies in implementing simple rules: repeating simple tasks consistently and enforcing them strictly over the long term.
Trading Strategy:
buy@108000-108500
TP:110500-111000
Technical Analysis – BTC/USD Technical Analysis – BTC/USD
📅 Date: June 11, 2025
🔍 Key Observations:
🔴 Resistance Zone – $110,000 to $111,800
Price has tested this resistance block twice (🔴 red arrows) and rejected both times, indicating strong selling pressure in this zone.
Rejection candles show long upper wicks, suggesting failed attempts by bulls to break above.
🟢 Support Zone – $101,800 to $103,500
This demand zone has been respected multiple times (🟢 green arrows), showing a solid base for potential bounces.
Price action previously rallied strongly after touching this level.
📦 Supply to Demand Play
Price made a sharp bullish move from support to resistance (📘 blue box shows the impulsive move).
After reaching resistance, the price is failing to break above, indicating possible exhaustion of bullish momentum.
📉 Potential Move:
🔽 Short-Term Bearish Bias
If price fails to hold current levels and breaks below the small consolidation (after blue box), we may see a drop to ~$105,583 (🔵 purple line = key level).
If that breaks, next likely destination is the support zone around $102,000 (⬇️ downward arrow path).
⚠️ Risk Notes:
🔁 Watch for any false breakouts or liquidity grabs above resistance.
📉 If bearish momentum increases below $105,583, sellers may take control in the short term.
✅ Trade Idea (Hypothetical):
Sell/Short near resistance (⚠️ confirmation needed like bearish engulfing or failed breakout)
Target 1: $105,583
Target 2: $102,000 zone
Stop-loss: Above $111,800 (invalidates setup)
📌 Summary:
BTC/USD is currently stuck between a well-defined resistance and support range. Unless bulls break above $111,800 with strong momentum, the structure favors a potential pullback toward the demand zone. ⚖️

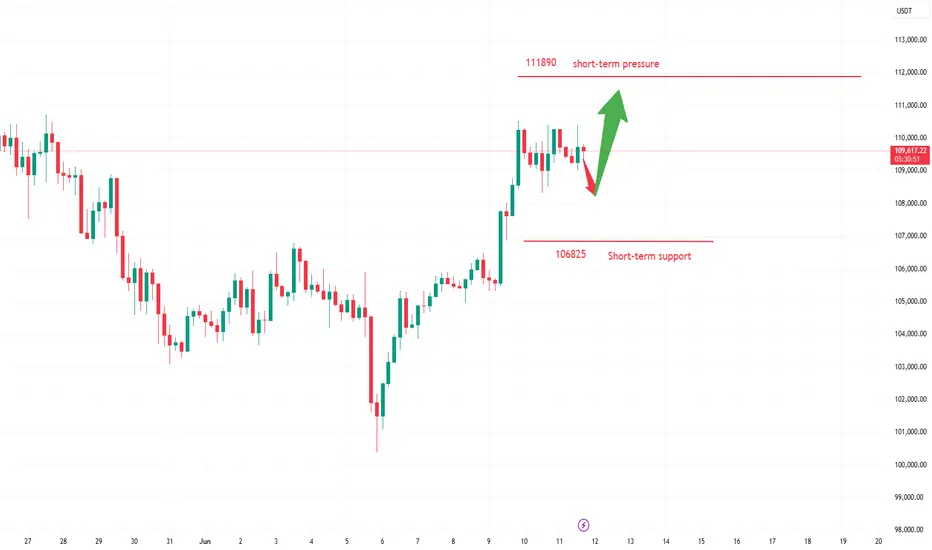
The bulls' strong momentum drives a new all-time high.hour gain stands at 4%, and the weekly increase expands to 6.7%. The total market capitalization has rebounded above $2.5 trillion. Three major positive factors have resonated: the expectation of (eased) Sino-US trade tensions, the SEC's policy shift to support on-chain innovation, and the continuous inflow of institutional capital (notably, Ethereum ETFs have seen 15 consecutive days of net inflows).
For the next 24 hours, the focus will be on the breakthrough of the all-time high at $111,980. The first resistance level is $112,500 (a dense short liquidation zone).
Humans need to breathe, and perfect trading is like breathing—maintaining flexibility without needing to trade every market swing. The secret to profitable trading lies in implementing simple rules: repeating simple tasks consistently and enforcing them strictly over the long term.
Trading Strategy:
buy@107000-107500
TP:109000-1095000

BTCUSDT Hello traders. I’ve spotted an ideal entry opportunity on the BTCUSDT pair. I’ve taken the trade and wanted to share it with you as well.
🔍 Trade Details
✔️ Timeframe: 15-Minute
✔️ Risk-to-Reward Ratio: 1:2
✔️ Trade Direction: Buy
✔️ Entry Price: 109,357.89
✔️ Take Profit: 110,502.43
✔️ Stop Loss: 108,768.53
🔔 Disclaimer: This is not financial advice. I’m simply sharing a trade I’ve taken based on my personal trading system, strictly for educational and illustrative purposes.
📌 Interested in a systematic, data-driven trading approach?
💡 Follow the page and turn on notifications to stay updated on future trade setups and advanced market insights.

BTC Bears Eye 100000 Break; Short at 107000 -108000 ResistanceBTC's downward movement failed to break through 100,000📉, but there is a clear downward trend, and breaking below 100,000 is only a matter of time⏳. In the short term, shorting at high levels can be considered📉. The upward resistance currently has difficulty breaking through 110,000🚧, and shorting can now be considered in the resistance range of 107,000-108,000📉
⚡️⚡️⚡️ BTCUSD ⚡️⚡️⚡️
🚀 Sell@ 107000 - 106000
🚀 TP 102000 - 98000
Accurate signals are updated every day 📈 If you encounter any problems during trading, these signals can serve as your reliable guide 🧭 Feel free to refer to them! I sincerely hope they'll be of great help to you 🌟 👇

BITCOIN Support & Resistance Levels🚀 Here are some key zones I've identified on the H4/H1 timeframe.
These zones are based on real-time data analysis performed by a custom software I personally developed.
The tool is designed to scan the market continuously and highlight potential areas of interest based on price action behavior and volume dynamics.
Your feedback is welcome!

BTCUSDT - at CUT n REVERSE AREA ? Holds or not??#BTCUSDT.. market just reached near to his ultimate aea that is around 104300
keep close that area because should holds above that if there is further buying scnerios.
otherwise below that not at all.
good luck
trade wisely

"A volatile pattern of seesawing between bulls and bears"The recent inflows into spot Bitcoin ETFs have slowed down, but institutions such as Standard Chartered still remain bullish on the long-term trend, with price targets potentially raised above $120,000. Meanwhile, institutions like Japanese listed company Metaplanet continue to increase their holdings of Bitcoin, demonstrating institutional recognition of Bitcoin's long-term value. However, it is worth noting that large wallets and old wallets showed synchronized selling in May, indicating some profit-taking pressure in the market. From the perspective of market sentiment indicators, the current market sentiment is rather complex, with both bulls and bears seeking direction and no strong unilateral tendency.
Humans need to breathe, and perfect trading is like breathing—maintaining flexibility without needing to trade every market swing. The secret to profitable trading lies in implementing simple rules: repeating simple tasks consistently and enforcing them strictly over the long term.
BTC/USD: The Big Player’s Pullback Strategy – Steal Profits!🚨 BITCOIN HEIST ALERT! 🚨 The Ultimate Bullish Raid on BTC/USD (Master Plan Inside)
🌟 Hola! Bonjour! Hallo! Marhaba! Money Makers & Market Robbers! 🤑💸🔥
Based on the 🔥Thief Trading Style🔥 (technical + fundamental analysis), we’re plotting the GREAT BTC/USD HEIST! Time to LONG & escape near the Red Zone—where bears lurk & traps snap shut! Overbought? Risky? Perfect for a slick exit. 🎯 Take profits & treat yourself—you’ve earned it! 💰🏆
🔑 Heist Blueprint:
🎯 Entry: "The raid begins!"
Buy MA Pullback near Big Players’ Zone (102,000)
OR Buy above pullback—bullish momentum = green light! 📈
🛑 Stop Loss:
Thief’s SL = Nearest swing low (or under wick) → 4H candle rules!
Adjust based on risk, lot size & multiple orders.
🏴☠️ Target: 115,000 (Cha-ching! 💵)
⚡ Scalpers’ Quick Strike:
LONG ONLY!
Rich? Strike hard. Not? Join swing robbers!
Trailing SL = Your money’s bodyguard. 🔒
💥 Why BTC/USD?
Bullish fuel pumping! Fundamentals + Macro + COT + On-Chain Data = 📈🚀
👉 Full analysis? Check our bio links! 🔗
⚠️ WARNING: News = Market Chaos!
Avoid new trades during news.
Trailing SL = Profit protector!
💖 Support the Heist!
💥 BOOST THIS IDEA! 💥 Help us steal more profits & grow stronger!
🚀 Daily market heists = Easy money. Stay tuned—next raid coming soon! 🤑🐱👤

btcusd sell signal. Don't forget about stop-loss.
Write in the comments all your questions and instruments analysis of which you want to see.
Friends, push the like button, write a comment, and share with your mates - that would be the best THANK YOU.
P.S. I personally will open entry if the price will show it according to my strategy.
Always make your analysis before a trade

Continue to push higher!The current price of Bitcoin is 106,400. Short-term market sentiment is optimistic, with some rebound momentum. However, a Dark Cloud Cover candlestick pattern near the recent high indicates short-term pullback risks. Nevertheless, a Three White Soldiers pattern at the bottom suggests subsequent upward potential, creating a short-term tug-of-war between bulls and bears. Factors such as continuous inflows of institutional funds, policy "green lights," and the halving effect have laid the foundation for a Bitcoin bull market, and there is still long-term upward potential. The short-term resistance level is near 108,000 USD. If this level is broken through, the key resistance level above is 112,000 USD. A successful breakthrough of the 112,000 USD resistance level could open up further upside space.
Humans need to breathe, and perfect trading is like breathing—maintaining flexibility without needing to trade every market swing. The secret to profitable trading lies in implementing simple rules: repeating simple tasks consistently and enforcing them strictly over the long term.
Trading Strategy:
buy@105000-105500
TP:107000-107500

earish trand analysis Read The ChaptianSMC trading point update
Technical analysis of (BTC/USDT) based on the 4-hour timeframe. Here’s a detailed breakdown of the analysis and the idea behind it:
---
Key Components of the Analysis:
1. Resistance Zone (FVG - Fair Value Gap):
The yellow zone marked as “fvg resistance level” indicates an area where price previously dropped quickly, suggesting inefficiency or imbalance in the market.
Price is approaching this zone again, which acts as a strong resistance.
2. Trendline & Lower Highs:
A descending trendline (with red arrows) shows consistent lower highs, indicating ongoing bearish pressure.
Each rejection from the trendline reinforces sellers’ dominance.
3. CHOCH (Change of Character):
The label “choch” signifies a market structure break, where bullish structure turned bearish.
This marks the transition to a downtrend.
4. EMA 200 (Exponential Moving Average):
The EMA (currently around 102,753) acts as dynamic support.
Price is currently trading above it, but a rejection from the resistance may push it below.
5. Target Zone:
A yellow box near 100,817.99 is labeled “target point”, indicating a possible short-term bearish target if price gets rejected at resistance.
6. RSI (Relative Strength Index):
RSI is around 47.11, slightly below neutral (50), suggesting bearish momentum could be building.
No clear oversold or overbought conditions yet.
---
Trade Idea Summary:
Bias: Bearish
Scenario:
If price reaches the resistance zone (~106,800–107,500) and fails to break above, a sell-off is expected.
First target: 100,800–101,000 zone
Price may also dip below EMA 200 confirming bearish strength.
Confirmation:
Rejection candle or bearish engulfing pattern near resistance.
RSI staying below 50 and starting to dip.
Invalidation:
Clean breakout and close above the resistance zone and trendline (~108,000+).
Mr SMC Trading point
---
Conclusion:
This chart sets up a high-probability short trade around the resistance area, leveraging both structural and momentum indicators. It suggests waiting for confirmation of rejection before entering, targeting the previous support and imbalance zone below.
Pales support boost 🚀 analysis follow)

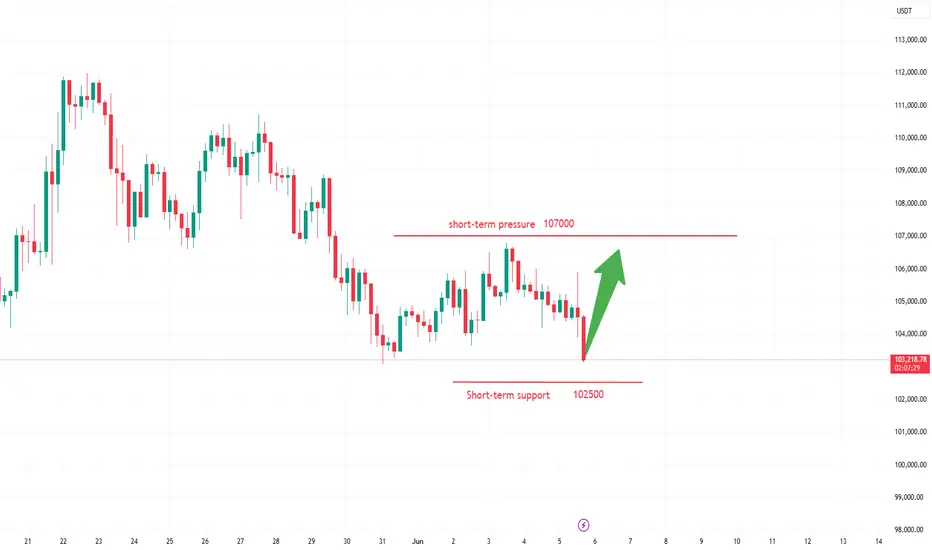
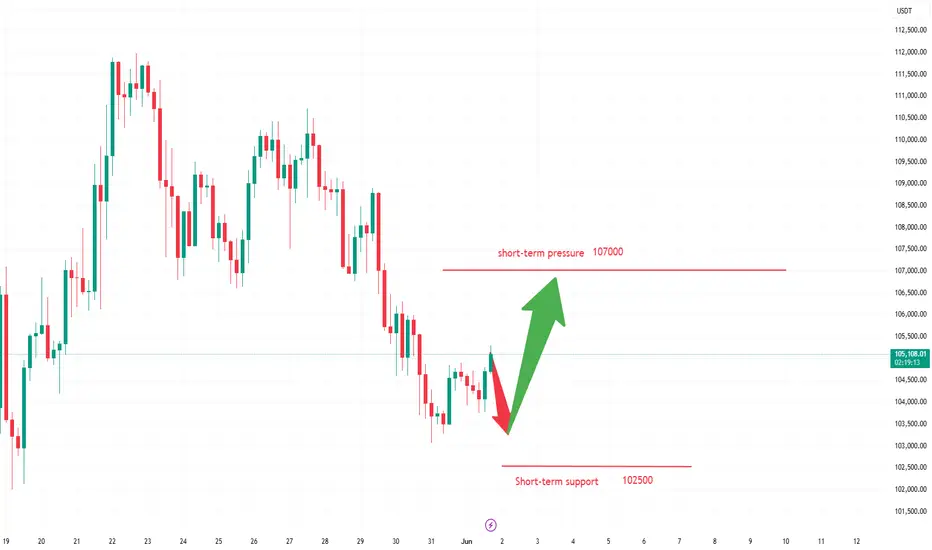
The inflow of funds provides momentum for the rise of Bitcoin.If market bullish sentiment surges and is fueled by new positive catalysts (such as increased institutional capital inflows or positive regulatory policy signals), the price of Bitcoin could break above the resistance level of $106,000. A successful breakout would open up new upside potential, with upward targets potentially reaching $107,500 or even higher.
Humans need to breathe, and perfect trading is like breathing—maintaining flexibility without needing to trade every market swing. The secret to profitable trading lies in implementing simple rules: repeating simple tasks consistently and enforcing them strictly over the long term.

Will it break the all-time high again?
Over the past week, the Bitcoin market has seen volatile trends, attracting widespread attention. In terms of price performance, Bitcoin carried forward the upward momentum from the previous week, opening at $103,500 and continuing its upward trend. On May 22nd, Bitcoin reached a high point, breaking through the $110,000 mark and hitting a record high of $112,000. Its market capitalization also surged to over $2.15 trillion, ranking among the top five global asset market capitalizations.
In terms of market capital flows, Bitcoin ETF products saw a total net outflow of up to $616 million on May 30th, with IBIT alone experiencing an outflow of $431 million, ending a consecutive 10-day net inflow trend. However, BlackRock's iShares Bitcoin ETF recorded a total net inflow of over $6.35 billion in May, with assets under management exceeding $71 billion, indicating that institutional investors maintain a long-term optimistic view of Bitcoin, and the short-term outflows are mostly profit-taking.
Humans need to breathe, and perfect trading is like breathing—maintaining flexibility without needing to trade every market swing. The secret to profitable trading lies in implementing simple rules: repeating simple tasks consistently and enforcing them strictly over the long term.
BTCUSDT 4H AnalysisBTC ~ 4H Analysis
#BTC On the 4H Time frame Bitcoin is retesting this multi support level. Let's see how far this support can hold.

BTCUSDT - UniverseMetta - Analysis#BTCUSDT - UniverseMetta - Analysis
Current market context:
BTC has completed the 5th wave, reaching the 2.618 Fibonacci extension and printing a new ATH. A correction phase now appears likely — and may serve as the foundation for the next bullish impulse.
📆 W1 – Weekly Timeframe
🔹 Price reached $112,200 (2.618 Fibo extension)
🔹 A top fractal has formed – a potential early signal for a short- to medium-term correction
🔹 Key correction zone:
• $97,700 – $93,250 – $88,860
🔹 Weekly close will be important for confirmation — especially if we see a close below the channel
📉 D1 – Daily Timeframe
🔹 A 3-wave corrective structure appears to be forming
🔹 Potential breakdown from the rising channel
🔹 Watch for retracement levels:
• $97,700 (0.618)
• $93,250 (0.5)
• $88,860 (0.382)
🔁 These areas are ideal zones for re-entry and long setups in trend continuation
⏳ H4 – Tactical Entry Opportunity
🔹 Wave 3 is forming to the downside
🔹 Entry possible on channel retest or breakout confirmation
🎯 Trade idea parameters:
Entry: 106,493.44 (or retest confirmation on H4)
Take Profits (TP):
• 103,135.48
• 97,721.82
• 93,250.02
• 88,963.55
Stop Loss: 112,341.18

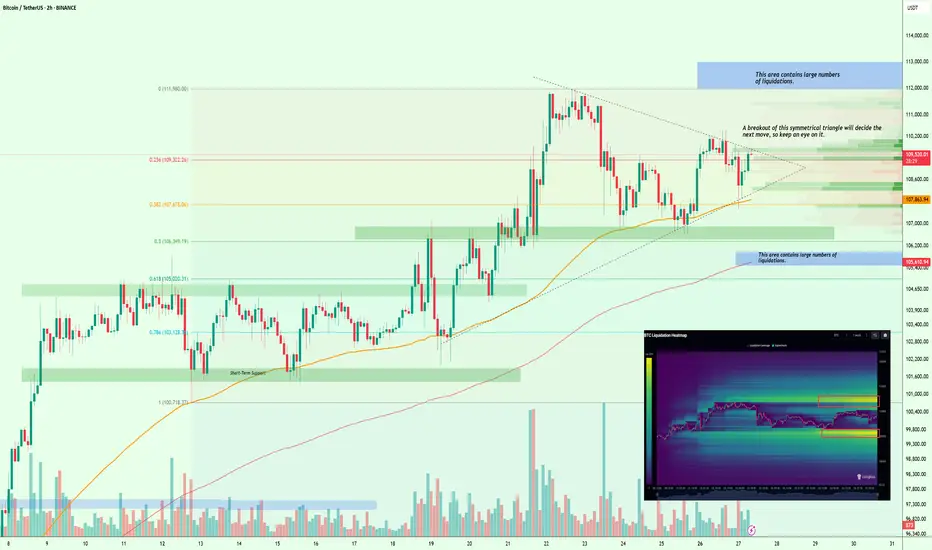
$BTC Liquidity Squeeze Incoming – Breakout or Breakdown?#Bitcoin
According to the liquidation heat map, CRYPTOCAP:BTC is building a large cluster of liquidations on both the upside and downside, creating some confusion in the market. However, the nearest major liquidation zone is around $112K–$113K, which increases the chances of a move toward that range.
Technically, BTC is forming a symmetrical triangle, and the breakout from this pattern will likely determine the next major move.
So keep a close eye on it.
I’ll keep you posted as things unfold.
If you find my updates helpful, don’t forget to like and follow for more!