Buy@9500096000: This represents the resistance level adjacent to the upper trend-line of the current ascending wedge. The price has repeatedly probed this zone but hasn't managed to achieve a decisive breakthrough, underscoring significant selling pressure at this crucial juncture 💥.
97500: It stands as a more elevated resistance milestone. Should the price powerfully breach the 96000 resistance barrier and sustain its upward momentum, it could potentially challenge this level 🎯.
⚡⚡⚡ BTCUSD ⚡⚡⚡
🚀 Buy@95000
🚀 TP 96000 - 97000
Accurate signals are updated every day 📈 If you encounter any problems during trading, these signals can serve as your reliable guide 🧭 Feel free to refer to them! I sincerely hope they'll be of great help to you 🌟
Btcusdtanalysis

BTCUSDT 1W UpdateYes, history is likely to repeat itself, making it possible for Bitcoin to reach a new all-time high in the range of $130K to $150K this year.
Are you ready?

#BTCUSDT: From $74,000 to $88,000 Moving Well! More Growth CominIt’s been on a steady climb from $74,000 to $88,000. We’re expecting even more growth in the coming weeks. The price has finally broken free from its consolidation phase and is now on the rise. We think it’ll reach $94,000, then $100,000, and maybe even go up to $120,000 by the end of the year.
What do you think? Let me know in the comments below!
Thanks!
Team Setupsfx_

Bitcoin Technicals & FundamentalsBitcoin/US Dollar (BTC/USD)
Price Action Observations:
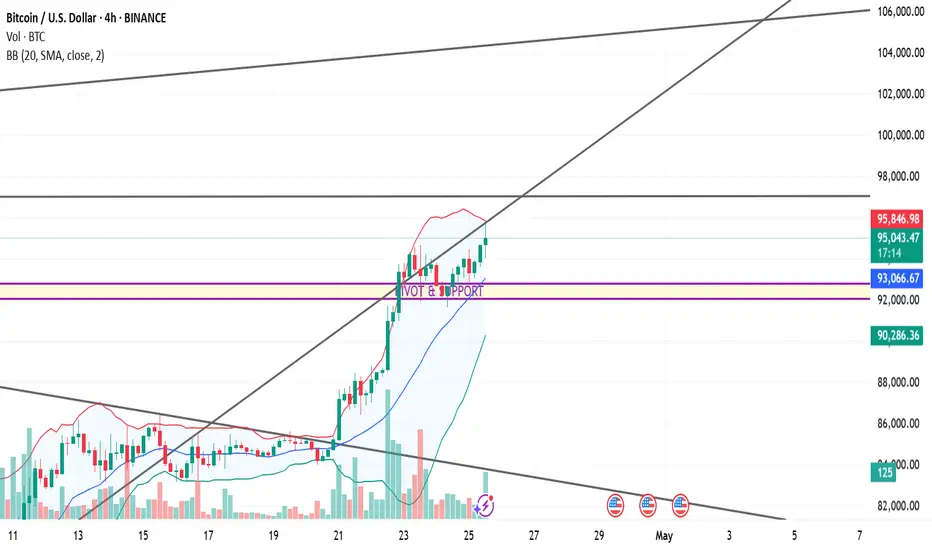
Trend: Strong bullish trend — price is above the middle Bollinger Band and riding the upper band.
Current Price: ~$95,410 (as of the chart time).
Immediate resistance near the upper Bollinger Band (~$95,921).
A major horizontal resistance is at around $98,000 (thick black line).
Local pivot/support zone marked around $92,400 – $93,100 (purple horizontal lines).
20-SMA (middle BB) acts as dynamic support (~$93,085).
Stronger support around $90,200 (lower BB).
Volume increasing on the bullish candles after the breakout around the 21st-22nd April.
Higher volume on green candles suggests genuine buying interest — not just a low-volume rally.
Bollinger Bands: Bands are expanding — classic signal for a volatile move.
Price is walking the upper band → continuation pattern as long as price doesn't break below the 20-SMA.
Trendlines: Ascending trendline beneath the current price → confirming higher lows.
There is a larger upper channel line sloping upwards targeting ~$105,000–$106,000.
Bias: Strong Bullish
Above 92,400–93,100 pivot zone = bullish structure maintained.
Immediate target: $98,000
Stretch target: $100,000 - $105,000 (upper channel resistance)
Invalidation: If price closes below ~$92,000 (break below pivot + mid-BB).
Fundamental Analysis (as of April 25, 2025):
If US Dollar (DXY) is weakening, it favors Bitcoin.
Fed policies — if there’s talk of rate cuts or holding rates steady, Bitcoin rallies.
Halving hype: Bitcoin halving happened earlier in 2024. Historically, it leads to a delayed but strong rally about 12-18 months later — we are now entering that "parabolic" zone.
ETF Inflows: BTC ETFs launched earlier have been drawing huge institutional interest.
Supply Shock: Fewer Bitcoins available on exchanges post-halving = price pressure upwards.
Global uncertainty (recession fears, wars, bank failures) = safe-haven demand for BTC.
Bitcoin being seen as "digital gold" strengthens its position.
My Final View:
Bitcoin remains in a strong bullish structure technically and fundamentally.
As long as it holds above ~$92,000–$93,000 zone, expect moves toward $98,000–$100,000+. A deeper retrace to $90,200 could still maintain the bull trend, but below that would signal weakness.
BTCUSDT 1W AnalysisBTC ~ 1W Analysis
#BTC It is necessary to wait until this pattern is successfully broken to confirm a sustained bullish trend.

Market Analysis: #BTCUSDT💰 On the BYBIT:BTCUSDT.P chart, a clear symmetrical triangle pattern has formed and already broken down, leading to a confirmed bearish impulse. Price has now returned below the POC level at $93,370.4 (Point of Control by volume), indicating weakness from buyers.
📊 Key Levels
🔴 POC BYBIT:BTCUSDT.P $93,370.4
— This is the highest volume area, now acting as strong resistance. As long as price remains below, short bias is favored.
🔵 Support BYBIT:BTCUSDT.P $91,905.5
— A short-term target if the bearish momentum continues.
🎯 Lower Target Zone
— Indicates the full depth of the breakdown move, aiming at the $90,800–$91,000 range.
📈 Volume
➡️ Volume increased during the breakdown, then dropped as price revisited the $93,000 zone — this signals a weak retest and seller control.
📍 Important Notes
➡️ Currently, BYBIT:BTCUSDT.P is trading between two key zones — the POC above and the $91,900 support below.
➡️ Failure to break and hold above $93,370 keeps the bearish scenario in play.
➡️ A move below $92,600 will confirm continuation of the downtrend.
📢 Strategy Recommendations:
🚨 SHORT Scenario BYBIT:BTCUSDT.P
Entry: on a retest of $93,000–$93,200 and rejection
Stop Loss: above POC ($93,450)
Targets: $92,100 → $91,900 → $90,800
🚨 Alternative LONG Scenario BYBIT:BTCUSDT.P (only if POC is broken):
Entry: after a solid breakout and hold above $93,400 with volume
Target: $94,200–$94,800
Stop Loss: below $93,000
🚨 Conclusion :
BYBIT:BTCUSDT.P has completed the triangle pattern and is now in a retest phase. So far, signs still point to bearish continuation, with final confirmation coming from a break below $92,600.

BTCUSDT TRIANGLE PATTERN IN 30-MI Created This BTCUSDT Chart Analysis In 30-M Tf
ENTRY LEVEL. 84600
Resistance zone : 84800
Target Well Be : 82800
BTCUSDT made Triangle Pattern, It's Take Resistance BTC went to Downtrend Soon

Bitcoin 15-Minute Chart – Projected Target PriceCurrently, the trend appears to be upward.
If the bullish trend continues, the price is expected to rise toward approximately 90,452.
On the other hand, if it declines, a drop toward around 83,808 is expected.
However, considering the current time of day, the market seems to be losing some momentum, so it's more reasonable to expect a short-term uptrend or sideways movement for now.

BTCUSDT at daily resistance, likely to head to 84kThe price has hit the daily resistance as expected in the quoted post. I see a pullback here which is already started. A short trade setup is favorable gere, We take a short in this zone and target towards daily support DS1. The correction can go upto weekly suppor WS1 but lets focus on this short trade first. risking 1.5% for 4.5% win.

BTCUSDT 1D Analysis UpdateBTC ~ 1D Analysis Update
#BTC Alright let's continue this bullish, a minimum of $ 130,000 - $ 150,000 in 2025.

BTC/USD "Bitcoin vs U.S.Dollar" Crypto Market Heist (Swing/Day)🌟Hi! Hola! Ola! Bonjour! Hallo! Marhaba!🌟
Dear Money Makers & Robbers, 🤑💰✈️
Based on 🔥Thief Trading style technical and fundamental analysis🔥, here is our master plan to heist the BTC/USD "Bitcoin vs U.S.Dollar" Crypto Market. Please adhere to the strategy I've outlined in the chart, which emphasizes long entry and short entry. 🏆💸Be wealthy and safe trade.💪🏆🎉
Entry 📈 :
"The loot's within reach! Wait for the breakout, then grab your share - whether you're a Bullish thief or a Bearish bandit!"
🏁Buy entry above 89000
🏁Sell Entry below 81000
📌However, I recommended to place buy stop for bullish side and sell stop for bearish side.
Stop Loss 🛑:
🚩Thief SL placed at 84000 for Bullish Trade
🚩Thief SL placed at 88000 for Bearish Trade
Using the 4H period, the recent / swing low or high level.
SL is based on your risk of the trade, lot size and how many multiple orders you have to take.
Target 🎯:
🏴☠️Bullish Robbers TP 99000 (or) Escape Before the Target
🏴☠️Bearish Robbers TP 72000 (or) Escape Before the Target
BTC/USD "Bitcoin vs U.S.Dollar" Crypto Market Heist Plan is currently experiencing a neutral trend,., driven by several key factors.
📰🗞️Get & Read the Fundamental, Macro, COT Report, On Chain Analysis, Sentimental Outlook, Intermarket Analysis, Future trend targets.. go ahead to check 👉👉👉🔗
⚠️Trading Alert : News Releases and Position Management 📰 🗞️ 🚫🚏
As a reminder, news releases can have a significant impact on market prices and volatility. To minimize potential losses and protect your running positions,
we recommend the following:
Avoid taking new trades during news releases
Use trailing stop-loss orders to protect your running positions and lock in profits
💖Supporting our robbery plan 💥Hit the Boost Button💥 will enable us to effortlessly make and steal money 💰💵. Boost the strength of our robbery team. Every day in this market make money with ease by using the Thief Trading Style.🏆💪🤝❤️🎉🚀
I'll see you soon with another heist plan, so stay tuned 🤑🐱👤🤗🤩
BTCUSDT – Big Move Incoming, Key Level To watch!Bitcoin is approaching a key decision area after a few months of downward pressure. The chart shows a clear bearish structure with lower highs and lower lows. Recently, a possible double top has formed just below the major resistance near 88.668, which could suggest a short-term pullback if buyers don't step in.
If the double top plays out, a retest of the support zone between 78.576 and 82.000 is likely. This zone has held well in the past and could act as a strong base again.
However, if price manages to break and hold above 88668, that would be a strong signal of strength. It could mark a shift back to a bullish trend, with the next major target being the all-time high area around 108.360.
Key areas to watch:
Support: 78.576 to 82.000
Resistance: 88.668 and 108.360
Right now, Bitcoin is at a make-or-break point. A breakout could trigger a strong rally, while rejection may lead to another dip. Stay patient, watch how price reacts at these levels, and let the market confirm the next move.

Bitcoin: The Tides are Shifting BULLISH Based on Price Action Based on price action analysis utilizing market structure and a variety of trend change confirmation tools, I am looking to long dips in Bitcoin.

Keep a close eye on the downward movement of BTC at all times.Today, BTC is in a sideways trend, with its price fluctuating in the range of 83,000 to 86,000. 📊
At present, there are no significant new developments in the area of tariffs. 👍
However, what we need to be vigilant about is that if the tariff situation deteriorates and triggers the market's safe - haven mechanism, a large amount of capital is highly likely to flow into the relatively stable gold and foreign exchange markets. 😟
This, in turn, could lead to a large - scale sell - off in the Bitcoin market. 💥
Therefore, it is recommended to consider short - selling at relatively high price points. 📉
The accuracy rate of our daily signals has remained above 98% throughout a month 📈! You are warmly welcome to follow us and join in on the success 🌟.
💰💰💰 BTCUSD 💰💰💰
🎯 Sell@84500 - 85500
🎯 TP 82500 - 81500
Traders, if you're fond of this perspective or have your own insights regarding it, feel free to share in the comments. I'm really looking forward to reading your thoughts! 🤗

BTCUSDT - UniverseMetta - Analysis#BTCUSDT - UniverseMetta - Analysis
📆 W1 (Weekly Timeframe)
🔹 Will the 5th wave formation come to an end soon?
🔹 Best to wait for a confirmed bottom fractal — price action will become clearer by the end of this week.
🔹 If a fractal forms, then:
• Watch for a breakout and close above the channel
• Look for entry opportunities into the next bullish impulse
🎯 Potential upside targets: $91,500 – $112,200
📉 D1 (Daily Timeframe)
🔹 Price is testing the upper boundary of a narrowing channel
🔹 To confirm a short-term reversal, it's ideal to wait for a top fractal
🔹 From the last impulse, there’s a correction opportunity toward:
• $81,700 – $77,320 (40–80% retracement)
⚠️ Avoid increasing position size / exposure
🔁 Upon reaching the support zone — watch for bullish entries
⏳ H4 (4-Hour Timeframe)
🔹 Potential beginning of a 3rd wave down from the upper channel
🔹 A short setup could be valid if the 1st wave low is broken
🔹 Stop loss should be placed above the high of wave 1 or above the channel level
🎯 Short-term targets: 61% – 23% Fibonacci levels from the last bullish impulse
📈 Trade Setup (H4 idea):
Entry: 84,154.92 – *82,895.64
Take Profits (TP):
1. 81,702.63
2. 80,399.17
3. 79,029.42
4. 77,328.29
Stop Loss: 86,209.53
📌 Conclusion:
BTCUSDT is in a critical zone — potentially ending its 5th wave on the weekly chart.
The key is to wait for confirmation via fractals (bottom on W1, top on D1).
Meanwhile, H4 offers a chance to engage in a controlled short setup, with tight risk and clear invalidation.

"Bitcoin vs Tether" Crypto Market Heist Plan (Swing/Day)🌟Hi! Hola! Ola! Bonjour! Hallo! Marhaba!🌟
Dear Money Makers & Robbers, 🤑 💰💸✈️
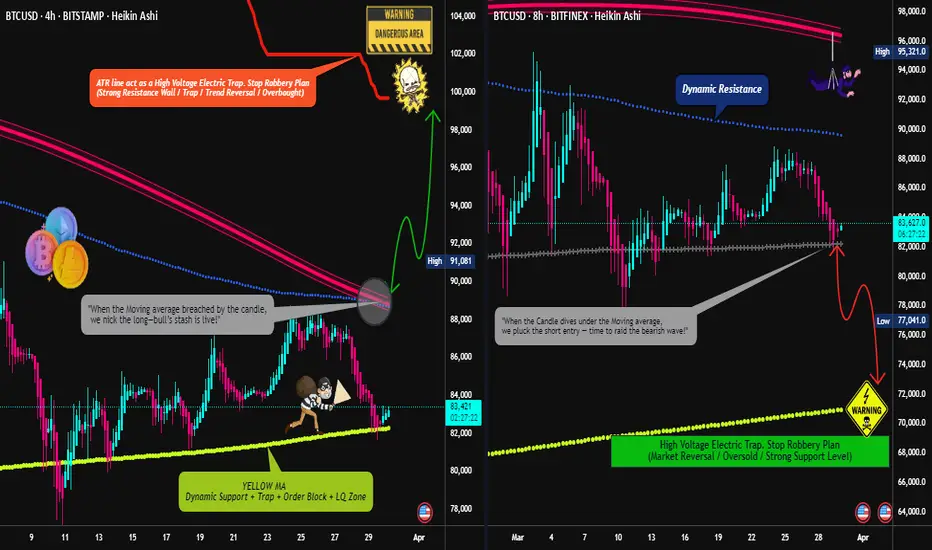
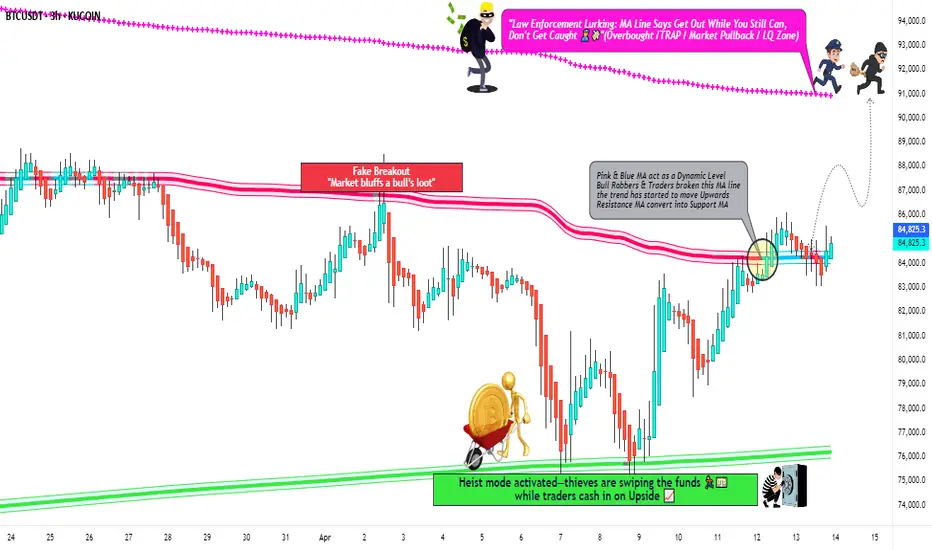
Based on 🔥Thief Trading style technical and fundamental analysis🔥, here is our master plan to heist the BTC/USDT "Bitcoin vs Tether" Crypto Market. Please adhere to the strategy I've outlined in the chart, which emphasizes long entry. Our aim is the high-risk MA Zone. Risky level, overbought market, consolidation, trend reversal, trap at the level where traders and bearish robbers are stronger. 🏆💸"Take profit and treat yourself, traders. You deserve it!💪🏆🎉
Entry 📈 : "The vault is wide open! Swipe the Bullish loot at any price - the heist is on!
however I advise to Place buy limit orders within a 15 or 30 minute timeframe nearest or swing low or high level for pullback entries.
Stop Loss 🛑:
Thief SL placed at the recent/swing low level Using the 30mins timeframe (81000) Day trade basis.
SL is based on your risk of the trade, lot size and how many multiple orders you have to take.
🏴☠️Target 🎯: 91000 (or) Escape Before the Target
🧲Scalpers, take note 👀 : only scalp on the Long side. If you have a lot of money, you can go straight away; if not, you can join swing traders and carry out the robbery plan. Use trailing SL to safeguard your money 💰.
BTC/USDT "Bitcoin vs Tether" Crypto Market Heist Plan (Swing/Day) is currently experiencing a bullishness,., driven by several key factors. 👇👇👇
📰🗞️Get & Read the Fundamental, Macro, COT Report, On Chain Analysis, Sentimental Outlook, Intermarket Analysis, Future trend targets... go ahead to check 👉👉👉🔗
⚠️Trading Alert : News Releases and Position Management 📰 🗞️ 🚫🚏
As a reminder, news releases can have a significant impact on market prices and volatility. To minimize potential losses and protect your running positions,
we recommend the following:
Avoid taking new trades during news releases
Use trailing stop-loss orders to protect your running positions and lock in profits
💖Supporting our robbery plan 💥Hit the Boost Button💥 will enable us to effortlessly make and steal money 💰💵. Boost the strength of our robbery team. Every day in this market make money with ease by using the Thief Trading Style.🏆💪🤝❤️🎉🚀
I'll see you soon with another heist plan, so stay tuned 🤑🐱👤🤗🤩
BTC Breakout or Bull Trap? Key Confirmation Levels Ahead
If you're leaning bullish, it's more prudent to wait for a confirmed breakout above 88,000, followed by a weekly close above the 86,000 level. Ideally, a successful retest should hold within the 85,000–86,000 range to validate the breakout structure. Any failure to hold this zone on the retest would likely signal a fake out which, given current price action and resistance pressure, remains a high-probability scenario in my view.
Bitcoin faced a sharp decline to the 75,000 level following the announcement of tariffs, which triggered panic and heightened uncertainty across the crypto market. Currently, BTC is attempting to reclaim the key 85,000 resistance zone. However, a descending trendline is capping upward momentum, adding to the difficulty of a clean breakout. A decisive weekly close above 86,000 could invalidate the bearish setup and open the door for bullish continuation till 100-108K. Conversely, failure to break and close above this level would likely lead to a swift drop toward the 71,000 support zone, with minimal structural support in between.
A weekly close below the 85,000 level would confirm bearish continuation, opening the door for a retest of the 72,000 support zone — a key structural level that previously acted as a demand area. Failure to hold above 72,000 could invalidate the current range and trigger a deeper correction toward the prior macro support around 55,000. Based on current momentum and price structure, a move toward the 55,000 region appears increasingly probable in the near term.

Tariff Shock Sends BTC to 75K — Can Bulls Reclaim 86K?Greetings...
Bitcoin faced a sharp decline to the 75,000 level following the announcement of tariffs, which triggered panic and heightened uncertainty across the crypto market. Currently, BTC is attempting to reclaim the key 85,000 resistance zone. However, a descending trendline is capping upward momentum, adding to the difficulty of a clean breakout. A decisive weekly close above 86,000 could invalidate the bearish setup and open the door for bullish continuation. Conversely, failure to break and close above this level would likely lead to a swift drop toward the 71,000 support zone, with minimal structural support in between.
A weekly close below the 85,000 level would confirm bearish continuation, opening the door for a retest of the 72,000 support zone — a key structural level that previously acted as a demand area. Failure to hold above 72,000 could invalidate the current range and trigger a deeper correction toward the prior macro support around 55,000. Based on current momentum and price structure, a move toward the 55,000 region appears increasingly probable in the near term.

BITCOIN SENTIMENTPrice recently broke structure to the upside but is now showing signs of a pullback. I’m expecting a drop toward the support zone, which is highlighted with the white marker. This area aligns with a volume cluster and previous structure, making it a strong candidate for a bullish reaction.
Higher timeframe sentiment remains bullish, so I’ll be watching this level for a potential bounce and continuation to the upside. If this zone fails, deeper support levels come into play.

BTCUSD Daily Trend Analysis is BullishAccording to my momentum analysis, BTCUSD confirmed Bullish trend on April 12, 2025 with entry price at 83624 and stop-loss at 74373. It is likely to continue the trend till 91980 and if breaks and closes above 91980, there is a possibility of hitting the target at 102754.

BTC/USDT Monthly Outlook📊 BTC/USDT Monthly Outlook – Smart Money Perspective
Bitcoin is currently trading around $83,565, with price consolidating after a Market Structure Shift (MSS) on the higher time frame.
🔹 Key Highlights:
A strong bullish impulse led to a break of monthly structure (MSS), creating Fair Value Gaps (FVG) both above and below.
Price is currently within a monthly FVG, showing indecision and potential for either continuation or deeper retracement.
Liquidity buy side rests near $110,000, marking a logical target if price respects current FVG support.
On the downside, a deeper retracement could aim for the lower FVG and sweep sell-side liquidity around $48,000–52,000.
📌 Scenarios:
Bullish case: Rejection from current FVG zone, followed by continuation toward the buy-side liquidity.
Bearish case: Break below current FVG, targeting the next zone and filling imbalances below.
🧠 Watch how price reacts to the current FVG. Smart money will likely seek liquidity before committing to a clear direction.
⚠️ This analysis is for educational purposes only and not financial advice.

BTCUSDT 1DBTC ~ 1D Analysis
#BTC Let us now hope for a decisive breakout of the bullish pattern, signaling a potential end to this downtrend.

#BTCUSDT shows signs of reversal📉 SHORT BYBIT:BTCUSDT.P from $82,125.0
🛡 Stop loss: $82,976.0
🕒 Timeframe: 4H
✅ Overview:
➡️ The BYBIT:BTCUSDT.P chart shows a rising wedge — a typical bearish pattern.
➡️ Price hit the upper wedge boundary and started to decline, breaking support.
➡️ A second top (Top 2) has formed on weakening volume, signaling a possible reversal.
➡️ The POC at $82,490.8 has been broken — price is holding below it, strengthening the bearish case.
🎯 TP Targets:
💎 TP 1: $81,430.0
💎 TP 2: $80,887.0
💎 TP 3: $80,485.0
📢 Additional scenario notes:
📢 Entry activates upon breakdown and consolidation below $82,125.
📢 Watch for increased volume at key TP levels for confirmation.
📢 A move above $82,976.0 invalidates the setup — stop placed just above key resistance and wedge top.
🚀 BYBIT:BTCUSDT.P shows signs of reversal — a corrective move to the downside is expected.
