BTCUSD BTCUSD still expecting some good run within to the up side as there’s a new higher price that’s not been touched
Btcusdtbuy
BTC/USDT Heist Mode: Buy Low, Escape Rich🏴☠️"Bitcoin vs Tether" Crypto Market Robbery Blueprint 🔥 | Thief Trading Style (Swing/Day Plan)
🌍 Hey Money Makers, Chart Hackers, and Global Robbers! 💰🤑💸
Welcome to the new Heist Plan by your favorite thief in the game — this time targeting the "Bitcoin vs Tether" Crypto Market like a smooth criminal on the charts. 🎯📊
This is not your average technical analysis — it's a strategic robbery based on Thief Trading Style™, blending deep technical + fundamental analysis, market psychology, and raw trader instincts.
💼 THE SETUP — PREPARE FOR THE ROBBERY 🎯
We're looking at a bullish operation, setting up to break into the high-value vaults near a high-risk, high-reward resistance zone — beware, it's a high-voltage trap area where pro sellers and bearish robbers set their ambush. ⚡🔌
This plan includes a layered DCA-style entry, aiming for max profit with controlled risk. Chart alarms on, mindset ready. 🧠📈🔔
🟢 ENTRY: "The Robbery Begins"
📍 Zone-1 Buy: Near 116200.00 after MA pullback
📍 Zone-2 Buy: Near 112600.00 deeper pullback
🛠️ Entry Style: Limit Orders + DCA Layering
🎯 Wait for MA crossover confirmations and price reaction zones — don’t chase, trap the market.
🔻 STOP LOSS: "Plan the Escape Route"
⛔ SL for Pullback-1: 113000.00 (2H swing low)
⛔ SL for Pullback-2: 110000.00
📌 SL placement depends on your position sizing & risk management. Control the loss; live to rob another day. 🎭💼
🎯 TARGET ZONE: “Cash Out Point”
💸 First TP: 127000.00
🏁 Let the profit ride if momentum allows. Use a trailing SL once it moves in your favor to lock in gains.
👀 Scalpers Note:
Only play the long side. If your capital is heavy, take early moves. If you’re light, swing it with the gang. Stay on the bullish train and avoid shorting traps. Use tight trailing SL.
🔎 THE STORY BEHIND THE HEIST – WHY BULLISH?
"Bitcoin vs Tether" shows bullish momentum driven by:
💹 Technical bounce off major support
🌏 Macroeconomic & geopolitical sentiment
📰 Volume + sentiment shift (risk-on)
📈 Cross-market index confirmation
🧠 Smart traders are preparing, not reacting. Stay ahead of the herd.
👉 For deeper insight, refer to:
✅ Macro Reports
✅ COT Data
✅ Intermarket Correlations
✅ CHINA-specific index outlooks
⚠️ RISK WARNING – TRADING EVENTS & VOLATILITY
🗓️ News releases can flip sentiment fast — we advise:
❌ Avoid new positions during high-impact events
🔁 Use trailing SLs to protect profit
🔔 Always manage position sizing and alerts wisely
❤️ SUPPORT THE CREW | BOOST THE PLAN
Love this analysis? Smash that Boost Button to power the team.
Join the Thief Squad and trade like legends — Steal Smart, Trade Sharp. 💥💪💰
Every day in the market is a new heist opportunity — if you have a plan. Stay tuned for more wild robbery blueprints.
📌 This is not financial advice. Trade at your own risk. Adjust based on your personal strategy and capital. Market conditions evolve fast — stay updated, stay alert.

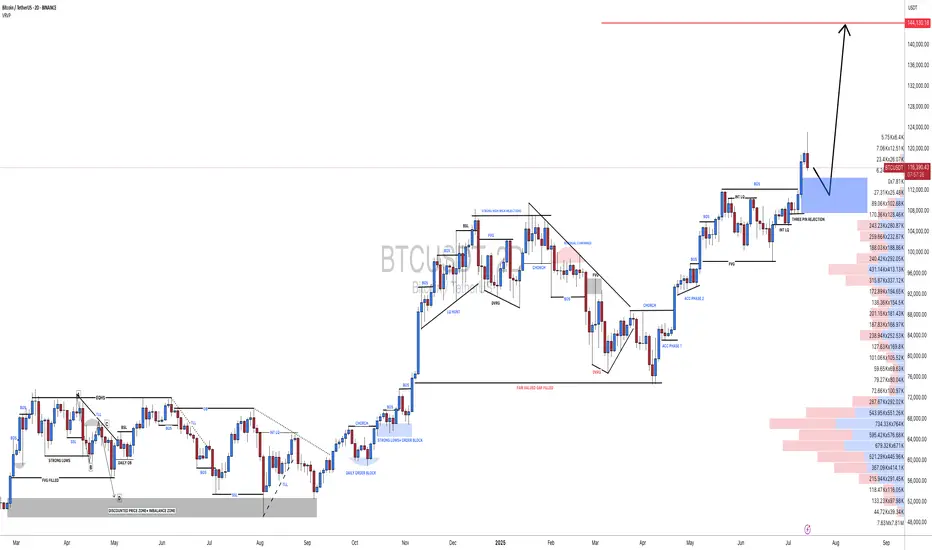
#BTCUSDT(BITCOIN): Another Small Correction And Bounce Straight Bitcoin reached a record high of 125k, but then its price started to drop and is currently trading at 115k. We expect the price to reverse from the 110k area and continue its bull move towards the potential next target of 150k. Keep an eye on the price to see if it falls below our area of interest.
Good luck and trade safely!
Team Setupsfx_
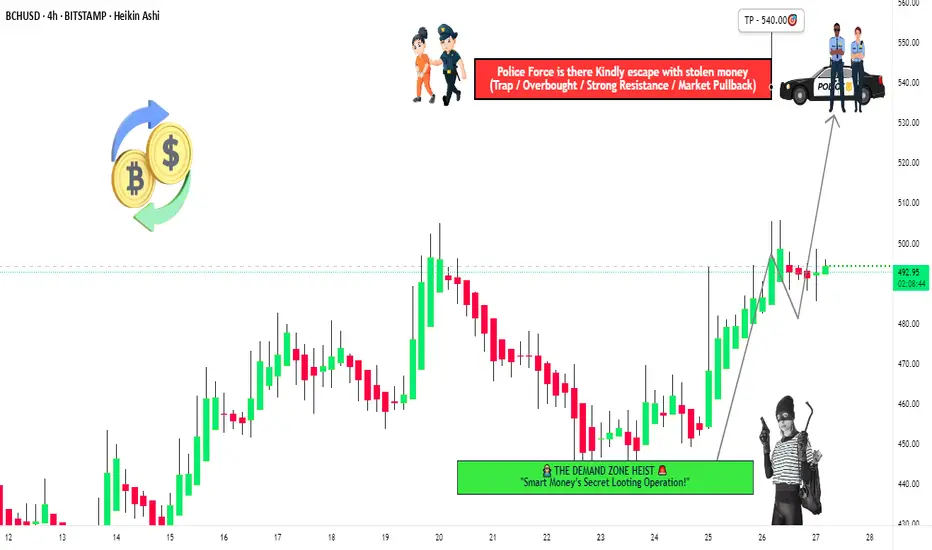
"BCH/USD Heist Mode: Enter Long, Exit Before Bears Strike!🚨 BCH/USD HEIST ALERT: Bullish Loot & Escape Plan! (Thief Trading Style) 🚨
🌟 Greetings, Market Bandits & Profit Pirates! 🌟
(Hola! Oi! Bonjour! Hallo! Marhaba!)
🔥 Mission Briefing:
Based on Thief Trading tactics (TA + FA), we’re plotting a bullish heist on BCH/USD. Time to swipe the loot & escape before the cops (bears) show up!
🔓 ENTRY: "The Vault is Open!"
📈 Buy Zone: Retest of recent low/high (15-30min timeframe).
💡 Pro Tip: Use limit orders for precision—don’t chase!
🛑 STOP LOSS: Live to Steal Another Day
📍 Thief SL: Recent swing low (~440.00 on 4H TF).
⚠️ Adjust based on your risk, lot size, & multi-order strategy.
🎯 TARGET: 540.00 (or Bail Early!)
🏴☠️ Escape before the red zone (overbought, reversal risk, bear traps!).
💰 "Take profit & treat yourself—you earned it!"
📢 WHY THIS HEIST? (Bullish Catalysts)
✅ Fundamentals: Strong macro + sentiment.
✅ Technicals: Pullback entry + bullish structure.
✅ Intermarket trends: Crypto momentum favors bulls.
(For full intel—COT reports, on-chain data, sentiment—check 👉🔗🔗!)
🚨 NEWS ALERT: Avoid the Police (Volatility Traps!)
🔹 Avoid new trades during high-impact news.
🔹 Trailing stops to lock profits & dodge reversals.
💥 BOOST THIS HEIST! (Let’s Get Rich Together!)
👍 Smash that "Like" & "Boost" button to fuel our next robbery!
🚀 Follow for daily heist plans—easy profits await!
See you at the next heist, bandits! 🤑💎
Evening BTC Trend Analysis and Trading SuggestionsLet's review this afternoon's market performance. The BTC price, as we anticipated, rebounded to around 109,000 in the afternoon before plummeting sharply. Living up to "Black Friday", this violent drop was well within our expectations. In the afternoon's live trading, we also reminded everyone that as long as there was a rebound to the upper zone, it was a good opportunity to go short. This drop has created a space of nearly 1,500 points. Currently, the BTC price has pulled back to around 107,800.
From the current 4-hour K-line chart, after a strong upward surge, the market encountered significant resistance near the upper track of the Bollinger Bands. As bullish momentum gradually faded, the price started to come under pressure and decline, suggesting that the short-term upward trend may come to a temporary halt. At present, the market has recorded multiple consecutive candlesticks with large bearish bodies. The price has not only effectively broken below the key support level of the Bollinger Bands' middle track but also caused the Bollinger Bands channel to switch from expanding to narrowing, indicating that market volatility is decreasing. In terms of trading volume, it showed a moderate increase during the price pullback, which further confirms the authenticity of the bearish selling pressure.
BTCUSD
sell@108000-1085000
tp:107000-106000
Investment itself is not the source of risk; it is only when investment behavior escapes rational control that risks lie in wait. In the trading process, always bear in mind that restraining impulsiveness is the primary criterion for success. I share trading signals daily, and all signals have been accurate without error for a full month. Regardless of your past profits or losses, with my assistance, you have the hope to achieve a breakthrough in your investment.
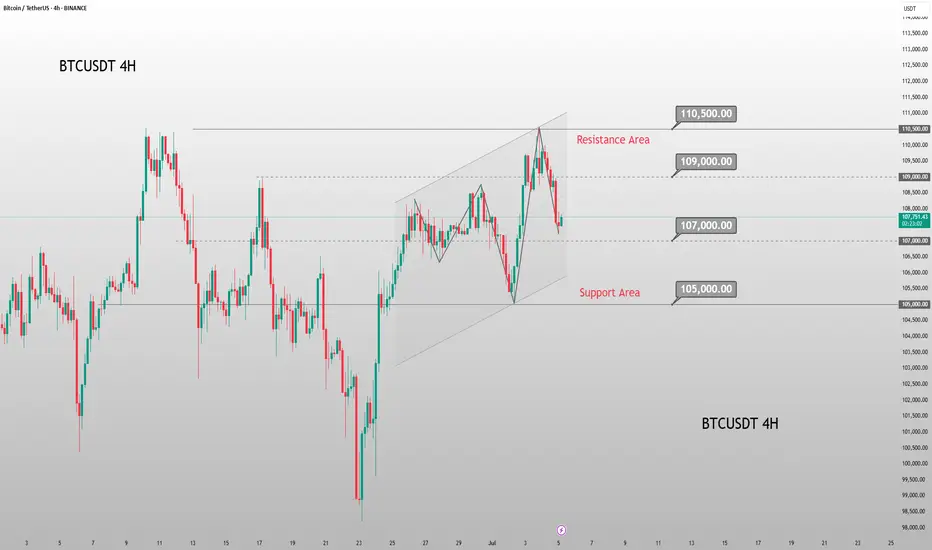
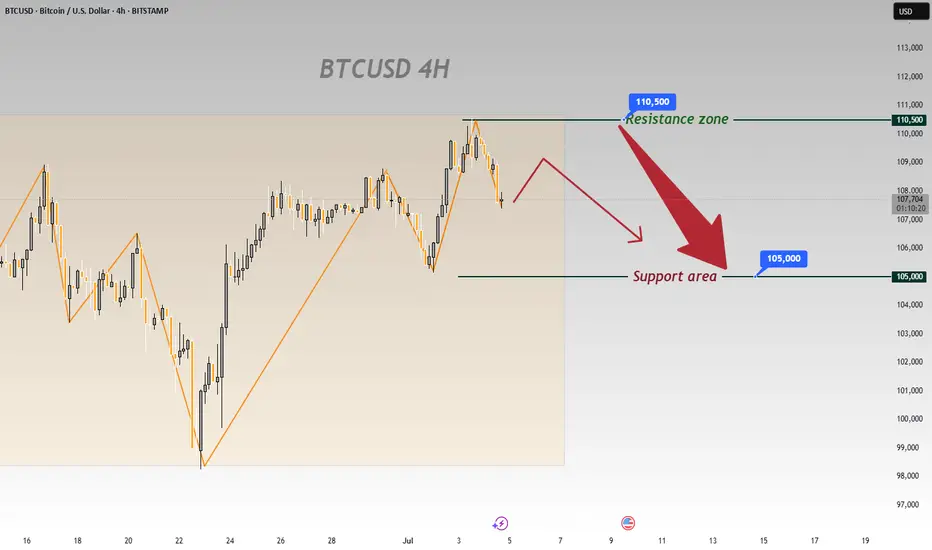
On BTCUSD’s 4 - hour chart, downside risks prevailOn BTCUSD’s 4 - hour chart, downside risks prevail:
Resistance Holds
Price failed to break 110,500, showing strong selling pressure that caps bulls 🚫. A pullback is likely.
Downtrend Signals
Post - resistance, price is retracing. Candlesticks and chart arrows point to a drop toward 105,000 support, fueled by building bearish momentum ⬇️.
Support Test Looms
105,000 is the next key level 🔑. Even if support slows the fall, the setup favors downside—bullish reversals seem unlikely after resistance failure.
Trend Weakness
Orange trendlines show the prior uptrend is fragile 🧊. Failing at 110,500 signals fading bullish force, setting up for a bearish correction.
In short, the 4 - hour chart is bearish. Watch for drops to 105,000; 110,500 will likely block bulls 🛑. Trade cautiously with this bias.
🚀 Sell@108500 - 107500
🚀 TP 106500 - 105500
Accurate signals are updated every day 📈 If you encounter any problems during trading, these signals can serve as your reliable guide 🧭 Feel free to refer to them! I sincerely hope they'll be of great help to you 🌟 👇
Evening BTC Market Analysis and Trading RecommendationsToday, U.S. markets are closed, leading to light trading activity and relatively limited overall market volatility. From a technical analysis perspective, the 4-hour K-line chart currently shows prices trading below the middle band of the Bollinger Bands, exhibiting a classic range-bound consolidation pattern. Bulls and bears are locked in a tug-of-war between key support and resistance levels, with K-line formations alternating between bullish and bearish patterns.
In terms of chart structure, the lower support zone has demonstrated strong buying conviction, while the upper resistance level has exerted clear restrictive force. Multiple failed upward breakouts have formed a short-term top. This box consolidation—characterized by resistance above and support below—is expected to sustain sideways trading through Friday.
Against the backdrop of no major positive catalysts, bearish momentum may gradually dominate if no substantial bullish triggers emerge. Maintain a trading strategy of selling into strength.
BTCUSDT
105000-105500
tp:104000-103000
Investment itself is not the source of risk; it is only when investment behavior escapes rational control that risks lie in wait. In the trading process, always bear in mind that restraining impulsiveness is the primary criterion for success. I share trading signals daily, and all signals have been accurate without error for a full month. Regardless of your past profits or losses, with my assistance, you have the hope to achieve a breakthrough in your investment.

Current BTC Trend Analysis and Trading RecommendationsThe daily candlestick chart of BTC shows a three - day consecutive bearish retracement, having fallen back to the vicinity of the starting point of the previous pinbar rebound and currently remaining in a recent low - level sideways consolidation zone. However, the 4 - hour trend is pressured by the middle band of the Bollinger Bands, staying within a downward channel and forming a rebound - retracement wave pattern.
For short - term strategies, anticipate a further retracement first. Long positions should be initiated only after the support level is confirmed valid. This retracement represents a necessary consolidation phase before the bullish trend continues, and the current adjustment range does not pose a substantial threat of trend reversal to the overall uptrend. With the core upward trend intact and the direction remaining clear, BTC is expected to resume its upward momentum after a brief consolidation. The operational approach remains to go long on retracements.
BTCUSD
buy@103500-104000
tp:105500-106500
Investment itself is not the source of risk; it is only when investment behavior escapes rational control that risks lie in wait. In the trading process, always bear in mind that restraining impulsiveness is the primary criterion for success. I share trading signals daily, and all signals have been accurate without error for a full month. Regardless of your past profits or losses, with my assistance, you have the hope to achieve a breakthrough in your investment.

BTCUSDT Trend Analysis and Trading RecommendationsToday's overall BTC market rebounded after hitting a low of 102,614 in the early trading session, with Bitcoin's price maintaining a slow upward trend throughout the day. The intraday high reached 105,912 but encountered resistance. As the weekend approaches, historical market data shows limited volatility during weekends, so range-bound fluctuations are expected for the weekend.
From the current overall market rhythm, the price has rebounded slightly today after the previous decline. The hourly chart shows consecutive upward candles, though the price movement remains relatively slow. As time progresses, the price is expected to sustain an upward trend after pullbacks, and breaking through the short-term resistance level is only a matter of time. In terms of short-term structure and pattern, despite slight resistance and minor pullbacks, the downward momentum has weakened. We can still focus on long positions at lower levels, paying attention to the 106,000 resistance level.
BTCUSD
buy@104000-104500
tp:106000-107000
Investment itself is not the source of risk; it is only when investment behavior escapes rational control that risks lie in wait. In the trading process, always bear in mind that restraining impulsiveness is the primary criterion for success. I share trading signals daily, and all signals have been accurate without error for a full month. Regardless of your past profits or losses, with my assistance, you have the hope to achieve a breakthrough in your investment.

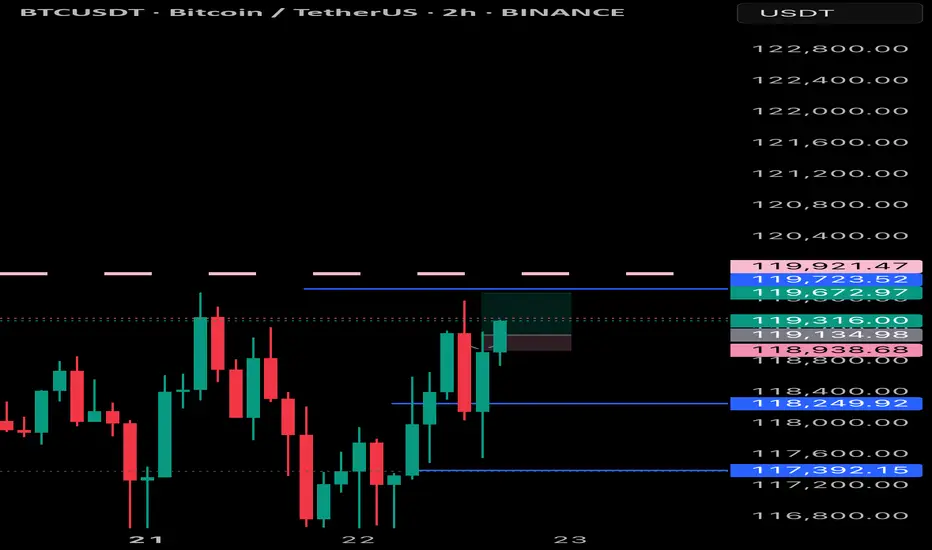
Bitcoin Breakout Imminent Key Buy&Sell Zones Signal $110K TargetThis chart provides a technical analysis of Bitcoin (BTC/USDT) on the 1-hour timeframe, highlighting key buy and sell points. Strong support and resistance zones are marked with orange bands, guiding traders through critical decision levels. Notable bullish momentum has been observed following the May 24 buy-point, with a projected price target of $110,318.88. The chart includes trendlines, Ichimoku elements, and momentum analysis for precision forecasting. Traders should watch the resistance near $109,796.21 and support at $106,000, as market reactions around these zones could dictate short-term direction.
Here’s a breakdown of the Bitcoin (BTC/USDT) chart analysis based on the image you provided:
---
1. Current Price Action
Price at time of chart: ~$109,000
Recent change: Upward movement of +1.57% (+$1,682.47)
Trend: Overall bullish momentum with higher lows forming a clear ascending trendline.
---
2. Key Levels
Support Zones:
Around $106,000: Marked as a recent "Buy-point", supported by historical consolidation.
Lower support near $102,000: Last strong bounce area.
Resistance Zones:
$109,574 – $109,796: This tight band has acted as resistance previously and coincides with a "Sell-point."
Target zone: $110,318.88: The projected breakout target if price clears immediate resistance.
---
3. Buy & Sell Points
Buy-Points: Well-timed after significant pullbacks into support zones. Each resulted in a strong rally.
Sell-Points: Identified at local peaks where momentum slowed and minor corrections occurred.
---
4. Indicators & Tools Used
Ichimoku Cloud / Bands: The green/red shaded zones likely reflect momentum and volatility bands.
Trendline: Ascending trendline confirms bullish structure — higher lows are intact.
Projection Arrow: Shows a likely scenario of short-term pullback and breakout toward $110K+.

Having a Mini ALT pump -but it may not last much Longer -CAUTION
The main chart is the Daily BTC PA and the BTC DOMINANCE ( BTC.D ) super imposed below, for the same period.
When BTC.D Drops and BTC PA remains stable, we see ALTS increase in Value, Mostly.
On the main chart, you can see that in Nov 2024, Till Dec, we had a mini ALT seasons and we are having another now
But will this last ?
If we look in more detail at the BTC.D chart below, we can get some ideas
Will it Last ? I do not think so.
We are on two areas of strong support right now.
The 618 Fib extension has provided support already and PA bounced. In fact, at time of writing, Many ALTS are in the RED on an hour chart. We need to watch and see where we go in the next 7 hours
Should this Fib extension Fail, Just below is a longer term line of support.
SO, I would head towards a High rate of Caution with the ALTS right now.
Does this mean that Bitcon will push higher ?
The potential is there, YES
High Level of Caution for th eALTS right now

#BITCOIN: Another drop and then Swing Bounce $125,000The current market sentiment is bearish, indicating a potential further decline towards the 65k price point. However, we anticipate a rebound towards the 125k region. As we approach the 65k threshold, we expect a substantial price increase.
To make informed investment decisions, it is crucial to observe a strong bullish trend before considering any bullish entries.
For more insights and market analysis, please like and comment.🚀❤️
Team Setupsfx_

BTCUSDT LONG/BUYBy utilizing Fibonacci retracement levels, historical patterns, , we can formulate a hypothesis that the market might follow a similar trajectory if bullish sentiment prevails.

In - depth Analysis of BTC: Can the 97,000 Target be Achieved?96000: This is the resistance level near the upper trend - line of the current ascending wedge. The price has tested this area several times but failed to break through effectively, indicating strong selling pressure at this level 💥.
⚡⚡⚡ BTCUSD ⚡⚡⚡
🚀 Buy@92000 - 93000
🚀 TP 95000 - 96000 - 97000
Accurate signals are updated every day 📈 If you encounter any problems during trading, these signals can serve as your reliable guide 🧭 Feel free to refer to them! I sincerely hope they'll be of great help to you 🌟

BTCUSD Trading StrategyBTCUSD has experienced a significant decline. While the indicators have yet to show signs of stabilization or a trend reversal, the price action on the candlestick chart indicates that there is support in the range of 82,000-80,000. Therefore, I believe it is an opportune moment to position for a long trade within this range, exercising patience as we await a price rebound to achieve the TP1/TP2 targets.

U.S. Econ Shocks: Bitcoin & Profit SignalsThe latest U.S. economic data has brought significant impacts. The core PCE inflation witnessed a 0.4% month - on - month increase, hitting the highest growth in a year, with a year - on - year rise of 2.8%, exceeding market anticipations. Meanwhile, the long - term inflation expectation from the University of Michigan has soared to a 32 - year high, intensifying market concerns about inflation's resurgence. Currently, the market remains enveloped in macro - risks, pending a softening of market sentiment.
Turning to the Bitcoin market, as depicted in today's price trend (the current BTCUSDT price is $82,338.01, dropping by $2,086.37, a 2.47% decline), the K - line chart analysis indicates a downward trend. The Williams indicator signals an oversold condition. Additionally, trading volume has contracted recently, with both price and volume decreasing, suggesting a sluggish and inactive market.
Nevertheless, if Bitcoin can stabilize above $82,000 and there are signs of capital reflux, gradual position - building may be considered, with a target price set above $90,000. Investors must recognize that the Bitcoin market brims with uncertainties. Variables such as forthcoming U.S. economic data, regulatory policies, and geopolitical scenarios will all sway Bitcoin prices. In this volatile financial landscape, meticulous analysis and judicious decision - making are of utmost importance for investors navigating the Bitcoin market.
BTCUSDT
buy@82000-83000
tp:84500-86500
I will share trading signals every day. All the signals have been accurate for a whole month in a row. If you also need them, please click on the link below the article to obtain them.

Bitcoin Nears Breakout: Can Bulls Push Past $89K?Currently, the key support level for the price of Bitcoin is around $86,000. This level has played a supporting role several times in the recent price fluctuations. If the price can hold this position, it will provide strong support for subsequent upward movements. The key resistance level above is at $89,000. If the price of Bitcoin can break through and firmly stand above this resistance level, it is highly likely to initiate a new round of upward market; if it fails to break through, the price may continue to experience small - scale oscillatory rebounds within the current range.
From a technical indicator perspective, the moving average indicates that Bitcoin has a short - term upward trend. The price has broken through the area where the signal line is located, indicating that the pressure from "digital gold" buyers is relatively high, and the asset value is likely to continue the upward momentum from the current level. However, the MACD indicator experienced a bearish crossover at the beginning of this week. Although the signal line is currently downward, the MACD line has started to move upward. Nevertheless, a trend reversal is unlikely to occur in the short term. In terms of the Relative Strength Index (RSI), this indicator has moved out of the oversold area and is currently in the neutral zone, indicating that the seller's market may have ended. The price of Bitcoin is expected to maintain its current position and may further rise within the next 5 - 7 days.
BTCUSDT
buy@86000-86500
tp:87500-88500
I will share trading signals every day. All the signals have been accurate for a whole month in a row. If you also need them, please click on the link below the article to obtain them.

BTCUSD:BTCUSD: SHORT, TP86600-85600BTCUSD now has an obvious double-head pattern, and the short opportunity is worth a try. There is support near 86600, followed by 85800. These can be used as two targets. If the support is strong during the fluctuation process, the order can be closed in advance.

BTC Rejected at $89K, Uptrend Holds. Bullish Bets?BTC faced rejection at the $89,000 resistance level yesterday, triggering a pullback. However, the overall uptrend remains intact. Investors may consider long positions on signs of stabilization after this corrective move.
BTCUSDT
buy@84500-85500
tp:87000-88000
I will share trading signals every day. All the signals have been accurate for a whole month in a row. If you also need them, please click on the link below the article to obtain them.

BTCUSDT Rally: From $85K to $88K+, What's NextToday, the price of BTCUSDT has shown a robust upward trend. Bullish forces are extremely active, steadily propelling the price to continuously climb, demonstrating a sharp offensive momentum.
From a technical perspective, upon in - depth analysis, the current price is gradually approaching the crucial resistance range of 89,000 - 90,000.
This range has played a significant role in past price movements. Its breakthrough situation will be a pivotal turning point determining the subsequent price trend.
Once a successful breakthrough occurs, it is highly likely to attract more capital inflows, driving the price to initiate a new round of upward price action.
I will share trading signals every day. All the signals have been accurate for a whole month in a row. If you also need them, please click on the link below the article to obtain them.

3/24 BTCUSD Trading Signal: LongThis is a relatively healthy rebound. After breaking through the first resistance, it slowly rose to the second resistance, where it has been tested many times. The current shape is good and there is room for further rise.
Therefore, in the current transaction, it is recommended to take long as an important reference direction, and the target is near the resistance of 86K.
When the price rises to this point, the market is likely to confirm the validity of the area near the 85K support. If the support is confirmed to be valid, the price may rise to 86.8K-88K.

BTC Nears Key Breakout: Can It Push Past 84.5K?Right then, BTC/USDT is at a bit of a crucial point at the moment. The buying range we flagged earlier, 82,000 - 83,500, has been left behind, with the price now sitting at 84,139.51 – up 0.06% on the day.
The target for taking profits is still 84,500 - 86,000, and we’re currently hovering near the lower end of that at 84,500. If it manages to break through that level, there’s a decent chance it could push higher – but it’s worth keeping an eye on whether the rally’s got enough steam to keep going.
Things to watch:
84,500 Breakout: If it cracks this level and holds, we could be in for more upside.
Momentum: Keep tabs on volume and market sentiment to see if this move’s got legs.
Pullback Risk: If it doesn’t break through, don’t be surprised if we see a bit of a dip.
BTCUSDT
Buy82000-83500
tp:84500-86000
I will share trading signals every day. All the signals have been accurate for a whole month in a row. If you also need them, please click on the link below the article to obtain them.

BTCUSDT Long StrategyThe BTC/USDT price is currently consolidating within a range.
You can focus on the 82,000-83,000 zone; if the price retraces to this area and finds support, consider entering a small long position.
The target take-profit levels are between 84,500 and 86,000. If the price reaches 84,500, consider partially closing the position to lock in some profits. If it breaks through this level, the next target is 86,000.
Given the high volatility of the crypto market, it is crucial to manage your position size carefully and avoid overtrading.
BTCUSDT
buy@82000-83000
tp:84500-86000
I will share trading signals every day. All the signals have been accurate for a whole month in a row. If you also need them, please click on the link below the article to obtain them.
