1 Year of Bitcoin Bull Run Remaining? In the chart above, we’re analyzing Bitcoin’s historical cycles to see if the current cycle follows a similar pattern.
Bear Run (1 Year): In each of the last three cycles, Bitcoin experienced a bear market lasting exactly 1 year from the all-time high (ATH). This phase saw a significant drop in price as the market corrected.
Bull Run from Bottom (1,064 Days): In the last two cycles, once the bottom was established, Bitcoin entered a consistent bull market that lasted approximately 1,064 days. During this period, the price gradually climbed, eventually reaching new highs.
Current Bitcoin Cycle:
So far, the current cycle appears to be following the same pattern as previous cycles. We’ve already experienced a 1-year bear market after reaching the previous all-time high (ATH).
Currently, we have completed 2 years of a bull run from the bottom, aligning with the 1,064-day bull run observed in past cycles. Based on this historical pattern, we may have 1 year of bull run remaining, which could potentially push Bitcoin to new highs by late 2025.
If this trend continues, it suggests a strong opportunity for growth over the next year, mirroring the end phase of past cycles.
BINANCE:BTCUSDT BITSTAMP:BTCUSD CRYPTOCAP:BTC
Regards
Hexa
Btcusdtlong

Here is an analysis of the latest Bitcoin market trendBitcoin has surged to around $106,700 at its peak and hovered around $104,800 at its low. Overall, the trend remains relatively stable, continuing to stay at a relatively high level. What is driving the market?
First, institutional funds have flowed in again. Recently, many investors have bought Bitcoin through ETFs, with substantial capital inflows, which has formed support for this price level.
Second, the technical outlook is promising. Various technical indicators suggest that it is still a bullish market, meaning the price may continue to rise.
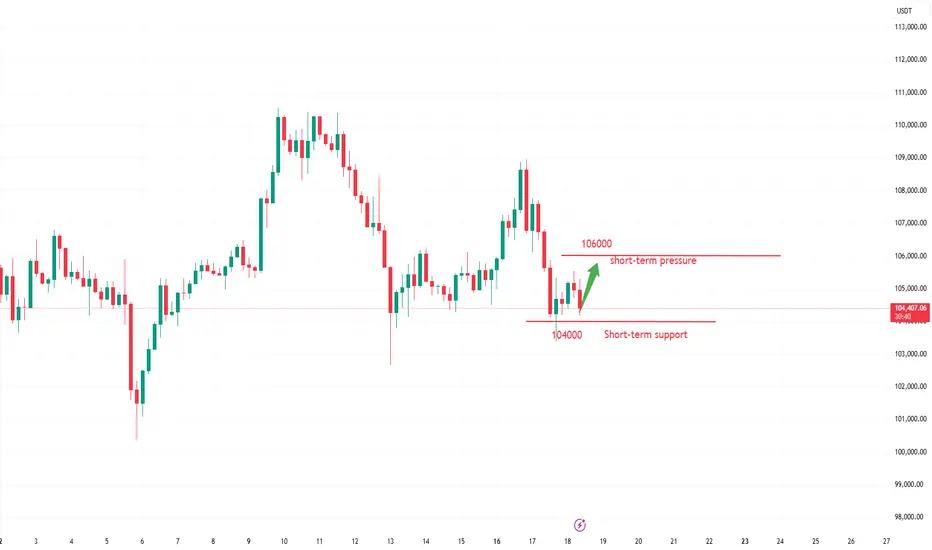
Third, regarding support and resistance levels: if the price declines, it may first find support near $104,000. If it breaks upward, the next target is roughly between $108,000 and $110,000.
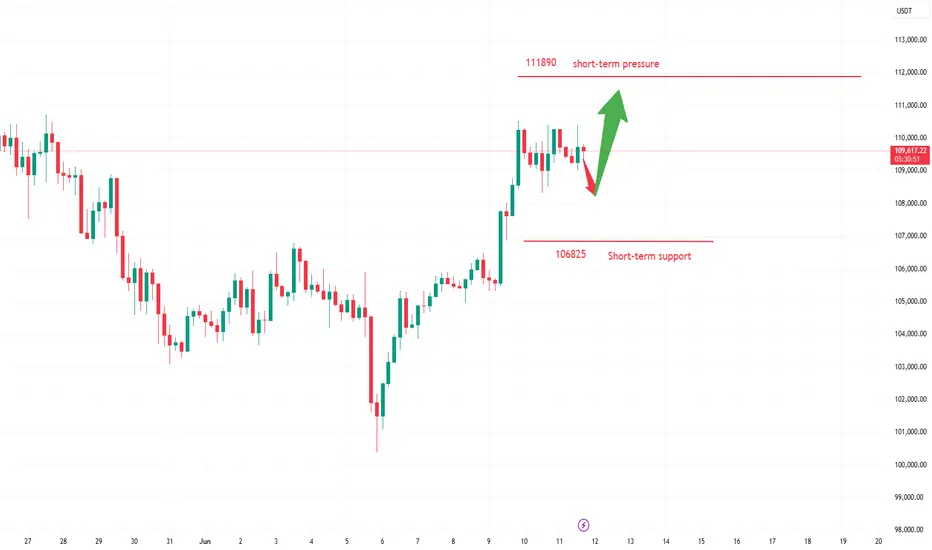
What about the short-term trend? If it can break through $107,000, it may then surge toward $109,000 or even the high of $112,000. If it fails to break through, it may fluctuate repeatedly within the range of $104,000 to $106,000 for a period.
you are currently struggling with losses,or are unsure which of the numerous trading strategies to follow,You have the option to join our VIP program. I will assist you and provide you with accurate trading signals, enabling you to navigate the financial markets with greater confidence and potentially achieve optimal trading results.
Trading Strategy:
buy@104300-104800
TP:107000-107500

Bitcoin Reclaims Momentum: War Fears Fading, Bulls Eye $125K! MARKETSCOM:BITCOIN just delivered a powerful bounce right off the critical $100K level. A key psychological and technical support zone tested multiple times in recent sessions. This time, the bounce came with strong volume confirmation, signaling renewed buyer interest. As geopolitical tensions in the Middle East begin to ease, market confidence is returning, fueling bullish sentiment across the board.
CRYPTOCAP:BTC now looks poised to retest the $110K resistance zone, where some short-term rejection could occur. However, a decisive breakout above $110K opens the gates for a potential rally toward the next major target at $125K. Stay sharp, always manage your risk, and don’t forget to set a proper stop loss. The trend is strong, and momentum is building!
Follow Our Tradingview Account for More Technical Analysis Updates, | Like, Share and Comment Your thoughts
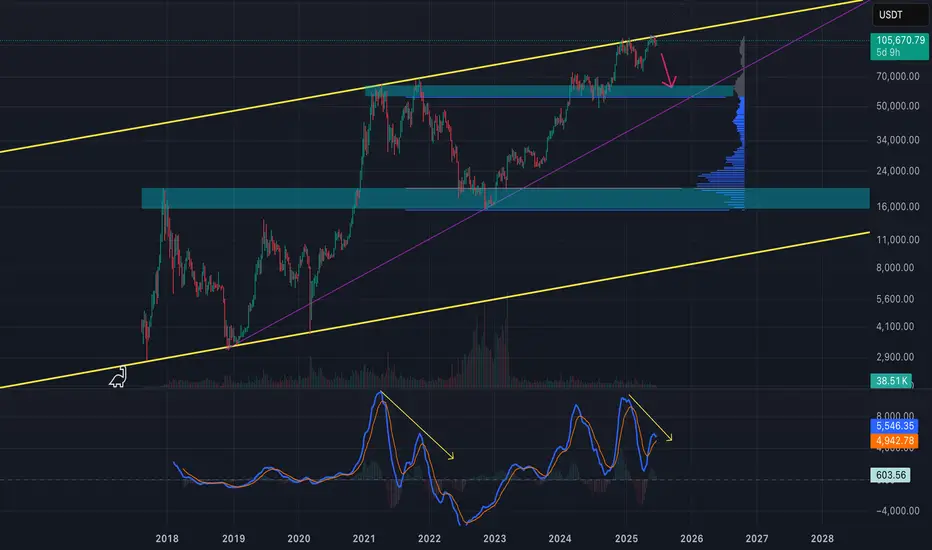
BTC - Getting 2021 Double Top/Bearish VibesLooking at the weekly chart for BTC, I'm seeing similar price action from when we double topped in 2021. We hit the top of the channel, corrected, and then had a slightly higher high before going down hard. Again we hit the top of the channel, had a strong correction, only to hit it again for a slightly higher high. But the signs of market weakness are showing in the indicators and price action. Not to mention war is looming between Israel and Iran. I'm taking a defensive posture here. I think if the bears take control, we could hit the $60k liquidity area that we missed on the last correction. We can reassess the market better at the time based on the price action and current events.
How to Tell BITCOIN is BULLISH using MOVING AVERAGES OnlyBTC is trading sideways and it sparks a lot of debate whether or not we are at the beginning of a new bearish cycle, or if there is still a push upwards waiting to happen.
Here's how you can use the Moving Averages to determine whether or not BTC is bullish.
Don't miss this update on my stance on the market and why I think ALT Season is waiting:
______________________
BINANCE:BTCUSDT

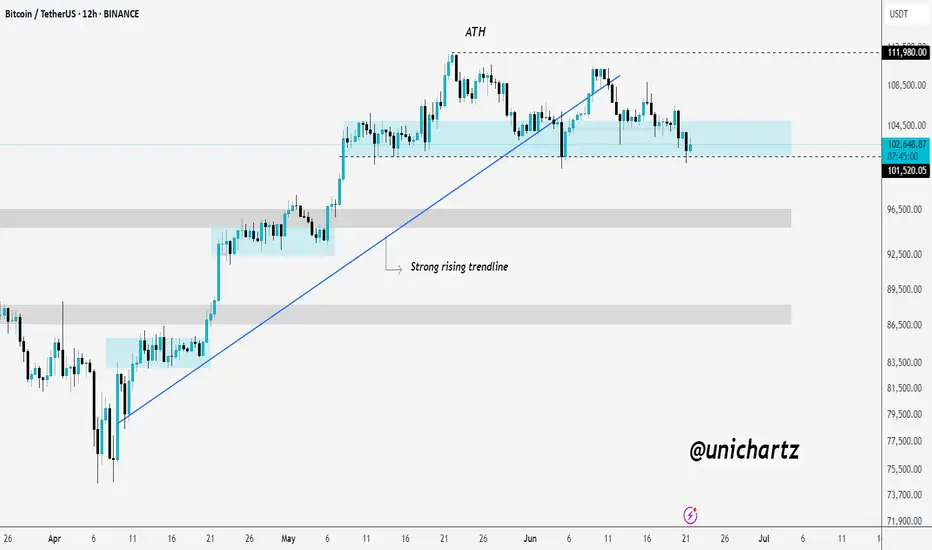
Support Tested: Can Bitcoin Withstand Global Fear?CRYPTOCAP:BTC is struggling to hold above the key support zone after losing its rising trendline.
This weakness comes as the Israel-Iran conflict intensifies, shaking global market confidence. While BTC has often acted as a hedge, rising geopolitical tension is pushing investors toward safety, causing hesitation even at critical support levels.
A breakdown here could trigger deeper downside.
DYOR, NFA
BTCUSDT - major support, Cut n Reverse Area??#BTCUSDT... market just r ached at his one of the most expensive area of the week and month
Keep close 101200
That is our ultimate supporting area.
Note: below 101200 we will cut n reverse on confirmation.
Good luck
Trade wisely

Evening BTC Market Analysis and Trading RecommendationsToday, U.S. markets are closed, leading to light trading activity and relatively limited overall market volatility. From a technical analysis perspective, the 4-hour K-line chart currently shows prices trading below the middle band of the Bollinger Bands, exhibiting a classic range-bound consolidation pattern. Bulls and bears are locked in a tug-of-war between key support and resistance levels, with K-line formations alternating between bullish and bearish patterns.
In terms of chart structure, the lower support zone has demonstrated strong buying conviction, while the upper resistance level has exerted clear restrictive force. Multiple failed upward breakouts have formed a short-term top. This box consolidation—characterized by resistance above and support below—is expected to sustain sideways trading through Friday.
Against the backdrop of no major positive catalysts, bearish momentum may gradually dominate if no substantial bullish triggers emerge. Maintain a trading strategy of selling into strength.
BTCUSDT
105000-105500
tp:104000-103000
Investment itself is not the source of risk; it is only when investment behavior escapes rational control that risks lie in wait. In the trading process, always bear in mind that restraining impulsiveness is the primary criterion for success. I share trading signals daily, and all signals have been accurate without error for a full month. Regardless of your past profits or losses, with my assistance, you have the hope to achieve a breakthrough in your investment.

Bitcoin's Latest Market AnalysisThe recent escalation of the situation in the Middle East has triggered a surge in risk - aversion sentiment across global financial markets. As a risk - on asset, Bitcoin has faced certain selling pressure in a market environment dominated by risk - off sentiment.
From a technical chart perspective, Bitcoin has made multiple attempts to break through the key resistance range of $108,800 - $110,000 in the recent period, but has encountered significant selling pressure each time. On the other hand, the area between $105,000 - $103,000 forms an important support zone. When the price drops to this area, it attracts some bargain - hunting capital inflows, which provides a certain degree of support for the price.
The price of Bitcoin is expected to fluctuate within a relatively narrow range. If it can hold the key support level of $105,000 and the bulls can regain strength, the price is likely to rebound to the range of $106,000 - $108,000. However, if the $105,000 support level is effectively breached, it may trigger additional selling pressure, potentially driving the price down further to $103,000. In extreme cases, if market panic sentiment spreads further, it may test the psychological threshold of $100,000.
you are currently struggling with losses,or are unsure which of the numerous trading strategies to follow,You have the option to join our VIP program. I will assist you and provide you with accurate trading signals, enabling you to navigate the financial markets with greater confidence and potentially achieve optimal trading results.

Technical Analysis of Bitcoin
From a market analysis perspective, the daily chart of the large cycle has closed with consecutive declines, the price is below the moving averages, and the indicator is in a death cross, indicating a bearish trend. However, it is necessary to be wary of the stimulation from the news and data caused by the current unstable national situation. In operation, risk control should be paid attention to, and the moving average pressure level near 106,000 on the daily chart should be focused on.
In the hourly chart of the short cycle, the decline continued in the European session after the morning decline yesterday, the U.S. session broke the low of the previous day, and the price rebounded and corrected at the support in the early morning. Currently, it is still in a corrective trend. Today, focus on the high pressure level in the 106,000 area, as well as the impact of the strength of the European session and the unemployment benefit data in the evening on the trend.
you are currently struggling with losses,or are unsure which of the numerous trading strategies to follow,You have the option to join our VIP program. I will assist you and provide you with accurate trading signals, enabling you to navigate the financial markets with greater confidence and potentially achieve optimal trading results.
Current BTC Trend Analysis and Trading RecommendationsThe daily candlestick chart of BTC shows a three - day consecutive bearish retracement, having fallen back to the vicinity of the starting point of the previous pinbar rebound and currently remaining in a recent low - level sideways consolidation zone. However, the 4 - hour trend is pressured by the middle band of the Bollinger Bands, staying within a downward channel and forming a rebound - retracement wave pattern.
For short - term strategies, anticipate a further retracement first. Long positions should be initiated only after the support level is confirmed valid. This retracement represents a necessary consolidation phase before the bullish trend continues, and the current adjustment range does not pose a substantial threat of trend reversal to the overall uptrend. With the core upward trend intact and the direction remaining clear, BTC is expected to resume its upward momentum after a brief consolidation. The operational approach remains to go long on retracements.
BTCUSD
buy@103500-104000
tp:105500-106500
Investment itself is not the source of risk; it is only when investment behavior escapes rational control that risks lie in wait. In the trading process, always bear in mind that restraining impulsiveness is the primary criterion for success. I share trading signals daily, and all signals have been accurate without error for a full month. Regardless of your past profits or losses, with my assistance, you have the hope to achieve a breakthrough in your investment.


BTCUSDT - UniverseMetta - Signal#BTCUSDT - UniverseMetta - Signal
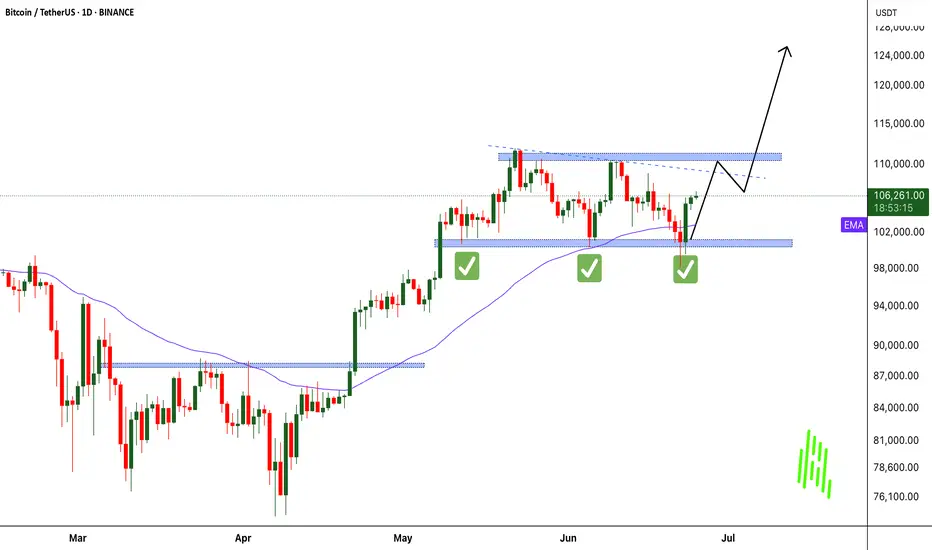
D1 - Retest of the trend line + formation of a potential 3rd wave in continuation of the uptrend. Stop behind the minimum of the 2nd wave.
Entry: 106342.27
TP: 112508.54 - 116913.01 - 123639.84 - 130847.16
Stop: 102578.45

BTCUSDT Trend Analysis and Trading RecommendationsToday's overall BTC market rebounded after hitting a low of 102,614 in the early trading session, with Bitcoin's price maintaining a slow upward trend throughout the day. The intraday high reached 105,912 but encountered resistance. As the weekend approaches, historical market data shows limited volatility during weekends, so range-bound fluctuations are expected for the weekend.
From the current overall market rhythm, the price has rebounded slightly today after the previous decline. The hourly chart shows consecutive upward candles, though the price movement remains relatively slow. As time progresses, the price is expected to sustain an upward trend after pullbacks, and breaking through the short-term resistance level is only a matter of time. In terms of short-term structure and pattern, despite slight resistance and minor pullbacks, the downward momentum has weakened. We can still focus on long positions at lower levels, paying attention to the 106,000 resistance level.
BTCUSD
buy@104000-104500
tp:106000-107000
Investment itself is not the source of risk; it is only when investment behavior escapes rational control that risks lie in wait. In the trading process, always bear in mind that restraining impulsiveness is the primary criterion for success. I share trading signals daily, and all signals have been accurate without error for a full month. Regardless of your past profits or losses, with my assistance, you have the hope to achieve a breakthrough in your investment.

"Accumulation Phase for Breakout"Bitcoin underwent high-level consolidation on June 11, with intraday volatility ranging from $108,800 to $110,200. It failed to effectively break through the previous high of $111,980. The 24-hour global liquidations amounted to $210 million (half of the previous day), with short positions accounting for 62%, indicating that bears still dominate short-term sentiment.
The Sino-US high-level talks in London originally scheduled for June 11 have been postponed to June 15, and the details of tariff reductions remain unclear, leading to a decline in risk asset appetite. The US Dollar Index rebounded by 0.8%, suppressing Bitcoin's breakthrough momentum. Bitcoin is currently in a accumulation phase for breaking through all-time highs, with policy regularization and institutional increasing holdings forming long-term support.
Humans need to breathe, and perfect trading is like breathing—maintaining flexibility without needing to trade every market swing. The secret to profitable trading lies in implementing simple rules: repeating simple tasks consistently and enforcing them strictly over the long term.
Trading Strategy:
buy@108000-108500
TP:110500-111000
The bulls' strong momentum drives a new all-time high.hour gain stands at 4%, and the weekly increase expands to 6.7%. The total market capitalization has rebounded above $2.5 trillion. Three major positive factors have resonated: the expectation of (eased) Sino-US trade tensions, the SEC's policy shift to support on-chain innovation, and the continuous inflow of institutional capital (notably, Ethereum ETFs have seen 15 consecutive days of net inflows).
For the next 24 hours, the focus will be on the breakthrough of the all-time high at $111,980. The first resistance level is $112,500 (a dense short liquidation zone).
Humans need to breathe, and perfect trading is like breathing—maintaining flexibility without needing to trade every market swing. The secret to profitable trading lies in implementing simple rules: repeating simple tasks consistently and enforcing them strictly over the long term.
Trading Strategy:
buy@107000-107500
TP:109000-1095000

BTCUSDT Hello traders. I’ve spotted an ideal entry opportunity on the BTCUSDT pair. I’ve taken the trade and wanted to share it with you as well.
🔍 Trade Details
✔️ Timeframe: 15-Minute
✔️ Risk-to-Reward Ratio: 1:2
✔️ Trade Direction: Buy
✔️ Entry Price: 109,357.89
✔️ Take Profit: 110,502.43
✔️ Stop Loss: 108,768.53
🔔 Disclaimer: This is not financial advice. I’m simply sharing a trade I’ve taken based on my personal trading system, strictly for educational and illustrative purposes.
📌 Interested in a systematic, data-driven trading approach?
💡 Follow the page and turn on notifications to stay updated on future trade setups and advanced market insights.

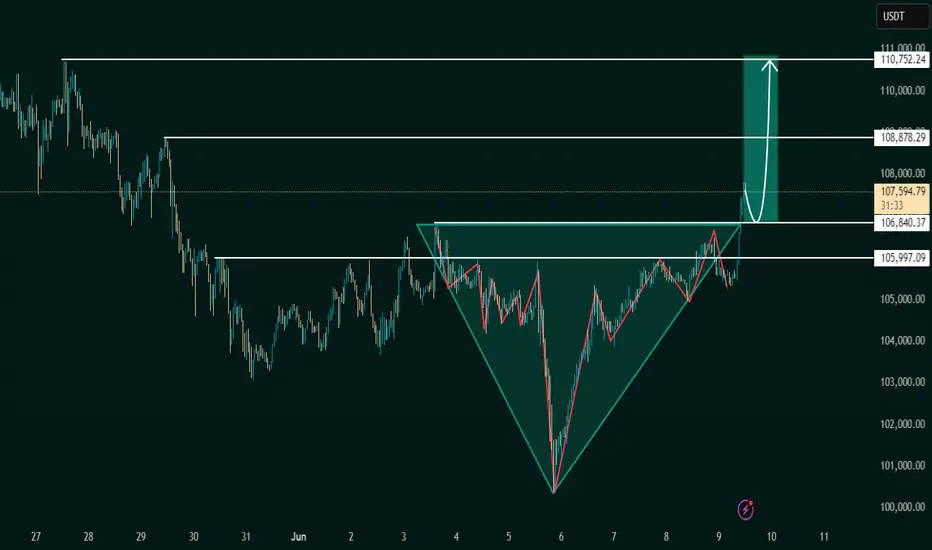
Inverse Head and Shoulders Breakout Signals BullishThe chart under review presents a classic Inverse Head and Shoulders pattern, a reliable and widely recognized bullish reversal formation in technical analysis. This structure typically forms after a downtrend, indicating a potential shift in market sentiment from bearish to bullish.
The pattern is composed of:
Left Shoulder: A modest price decline followed by a temporary upward correction.
Head: A deeper price decline forming the lowest point in the pattern.
Right Shoulder: A higher low that mirrors the left shoulder, followed by another upward movement.
The neckline, which acts as a critical resistance level, is clearly illustrated at approximately 106,840.37 USDT. A confirmed breakout above this neckline suggests the completion of the reversal pattern and validates the potential for a sustained bullish movement.
2. Breakout Confirmation
The current price action confirms a successful breakout above the neckline, with the market currently trading around 107,586.58 USDT. This breakout is a key signal for bullish continuation, provided it is supported by increased volume and follow-through price action.
From a technical standpoint, the breakout is reinforced by:
A clean violation of neckline resistance
Price consolidation near breakout zone before a strong upward thrust
Higher lows preceding the breakout, indicative of growing buying pressure
This confluence of technical signals strengthens the case for an upward price trajectory in the near term.
3. Projected Price Targets
Upon confirmation of the Inverse Head and Shoulders breakout, target levels can be derived using the measured move technique. This involves projecting the vertical distance from the head to the neckline upward from the breakout point.
Target 1 (Initial Resistance):
108,878.29 USDT – This level represents a potential short-term resistance where price may consolidate or retrace slightly before continuing.
Target 2 (Measured Move Completion):
110,752.24 USDT – This is the ultimate price target derived from the height of the head-to-neckline structure. Reaching this level would represent the full realization of the reversal pattern.
4. Key Support and Risk Levels
Risk management is a critical component of any trading strategy. The following support levels should be closely monitored:
106,840.37 USDT (Neckline Support):
Former resistance turned support. Holding above this level post-breakout is essential for sustaining bullish momentum.
105,997.09 USDT:
Acts as a secondary support level and potential stop-loss region for conservative traders.
If price fails to hold above the neckline and falls back below these levels, the breakout could be classified as a false breakout, warranting caution.
5. Strategic Implications for Traders
This setup provides a favorable risk-to-reward ratio for long entries, particularly for traders seeking to capitalize on momentum-based patterns. An optimal trading approach could involve:
Entry: Near the neckline breakout or on a minor retest of 106,840.37 USDT
Stop-Loss: Below 105,997.09 USDT or under the right shoulder to account for volatility
Take-Profit Zones: Partial profits near 108,878.29 USDT, with final target at 110,752.24 USDT
6. Final Remarks
This chart illustrates a textbook example of a bullish reversal pattern in play. While the technical outlook is favorable, traders should remain cautious of potential invalidation scenarios, especially in highly volatile or news-driven markets. Confirmation through volume analysis and supportive macro/fundamental conditions can further enhance confidence in the bullish thesis.
Overall, the current setup indicates a well-structured opportunity for upward price movement, with a clearly defined entry, risk, and reward framework.
Let me know if you'd like this tailored for a trading journal, client report, or automated strategy setup
BTCUSDT: Your Next Move? The Blue Box OpportunityAlright, focusing on BTCUSDT. This blue box is a critical buying zone.
The market's recent moves demand clarity. You need to know where genuine opportunity lies, avoiding the traps that catch most traders.
I've identified this blue box as a prime area where demand could ignite. But don't just jump in. Here's the plan:
Watch the Volume Footprint: Is there real accumulation, or just noise?
Spot CDV Divergences: Hidden strength often appears here, even if price looks weak.
Confirm on LTF: A clear breakout above minor resistance, followed by a retest as support, is your green light.
Be vigilant for liquidity hunts – those quick dips that shake out weak hands before a real move. If this blue box holds, and we get these confirmations, my bias is firmly upwards.
I only focus on assets with sudden, significant volume increases. BTCUSDT's current setup, combined with this potential volume, makes it a high-interest play.
Keep a very close eye on this blue box. Understanding these subtle signals means you can navigate these intricate dynamics, securing your position for potential gains. Miss this, and you might regret it.
📌I keep my charts clean and simple because I believe clarity leads to better decisions.
📌My approach is built on years of experience and a solid track record. I don’t claim to know it all but I’m confident in my ability to spot high-probability setups.
📌If you would like to learn how to use the heatmap, cumulative volume delta and volume footprint techniques that I use to determine very accurate demand regions, you can send me a private message. I help anyone who wants it completely free of charge.
🔑 On my profile, you can find an extensive track record spanning hundreds of analyses and many examples of my strategies in action. To keep things concise here, I'm sharing just a few of my most recent successful calls as a small snapshot of my ongoing work:
📊 FLOKIUSDT - +%100 From Blue Box!
📊 TRXUSDT - I Do My Thing Again
📊 OGNUSDT | One of Today’s Highest Volume Gainers – +32.44%
📊 TIAUSDT | Still No Buyers—Maintaining a Bearish Outlook
📊 Simple Red Box, Extraordinary Results
Feel free to check out my TradingView profile for all of them; listing everything here would genuinely take too long! 😉

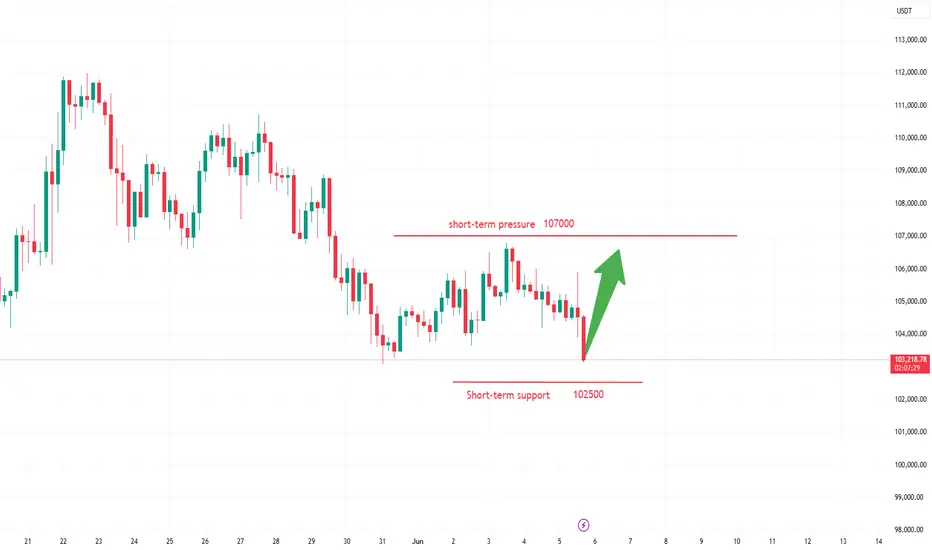
Bitcoin Trading Strategy for Monday's OpeningThe Bitcoin market as a whole showed a volatile trend this week. The price opened near $105,000 at the beginning of the week, and then fluctuated up and down under the combined influence of news and market sentiment. The highest touched $107,000, and the lowest fell to $101,000. From a daily chart perspective, the price hovered near key levels multiple times, indicating a fierce game between bulls and bears in the market. In terms of trading volume, it decreased compared to last week, suggesting that market participants have a certain wait-and-see attitude at the current price level.
Comprehensive analysis shows that the Bitcoin market will continue to maintain a pattern of multi-empty games next week. If macroeconomic data is positive, there are no major negative news on the policy front, and market sentiment remains stable, the Bitcoin price is expected to break through the short-term resistance level of $105,500 and challenge the resistance level of $107,000 or even higher.
Humans need to breathe, and perfect trading is like breathing—maintaining flexibility without needing to trade every market swing. The secret to profitable trading lies in implementing simple rules: repeating simple tasks consistently and enforcing them strictly over the long term.

Bitcoin Analysis – Possible Scenarios🟠 Price is consolidating around 104,500, sitting right on the short-term ascending trendline. No clear breakout yet.
🔴 Supply Zones:
1️⃣ OB 1H:📍 107,800 – 108,600📌 Strong rejection zone that led to the current decline.
2️⃣ OB 4H:📍 106,100 – 107,500📌 Key resistance zone – a valid break above may trigger bullish continuation.
3️⃣ Upper OB 1H:📍 110,700 – 111,400📌 Higher resistance to watch in case of strong breakout.
🟢 Demand Zones:
1️⃣ FVG 1H:📍 103,900 – 104,300📌 Price is nearing this imbalance zone – bullish reaction expected if support holds.
2️⃣ Lower FVG 1H:📍 99,900 – 100,700📌 If current support fails, this is the next strong liquidity zone.
📊 Possible Scenarios:
1️⃣ Bounce from current trendline & FVG → move toward OB 4H (buy setup with confirmation)
2️⃣ Break below trendline → deeper pullback into 100K zone
3️⃣ Breakout above OB 4H → target next resistance at 108,600 and above
‼️ Wait for confirmation before jumping in – price action is at a decision point.
🔍 Insight by ProfitaminFX
If this outlook aligns with your bias, or if you see it differently, feel free to share your perspective in the comments. Let’s grow together 📈

"A volatile pattern of seesawing between bulls and bears"The recent inflows into spot Bitcoin ETFs have slowed down, but institutions such as Standard Chartered still remain bullish on the long-term trend, with price targets potentially raised above $120,000. Meanwhile, institutions like Japanese listed company Metaplanet continue to increase their holdings of Bitcoin, demonstrating institutional recognition of Bitcoin's long-term value. However, it is worth noting that large wallets and old wallets showed synchronized selling in May, indicating some profit-taking pressure in the market. From the perspective of market sentiment indicators, the current market sentiment is rather complex, with both bulls and bears seeking direction and no strong unilateral tendency.
Humans need to breathe, and perfect trading is like breathing—maintaining flexibility without needing to trade every market swing. The secret to profitable trading lies in implementing simple rules: repeating simple tasks consistently and enforcing them strictly over the long term.
Continue to push higher!The current price of Bitcoin is 106,400. Short-term market sentiment is optimistic, with some rebound momentum. However, a Dark Cloud Cover candlestick pattern near the recent high indicates short-term pullback risks. Nevertheless, a Three White Soldiers pattern at the bottom suggests subsequent upward potential, creating a short-term tug-of-war between bulls and bears. Factors such as continuous inflows of institutional funds, policy "green lights," and the halving effect have laid the foundation for a Bitcoin bull market, and there is still long-term upward potential. The short-term resistance level is near 108,000 USD. If this level is broken through, the key resistance level above is 112,000 USD. A successful breakthrough of the 112,000 USD resistance level could open up further upside space.
Humans need to breathe, and perfect trading is like breathing—maintaining flexibility without needing to trade every market swing. The secret to profitable trading lies in implementing simple rules: repeating simple tasks consistently and enforcing them strictly over the long term.
Trading Strategy:
buy@105000-105500
TP:107000-107500
