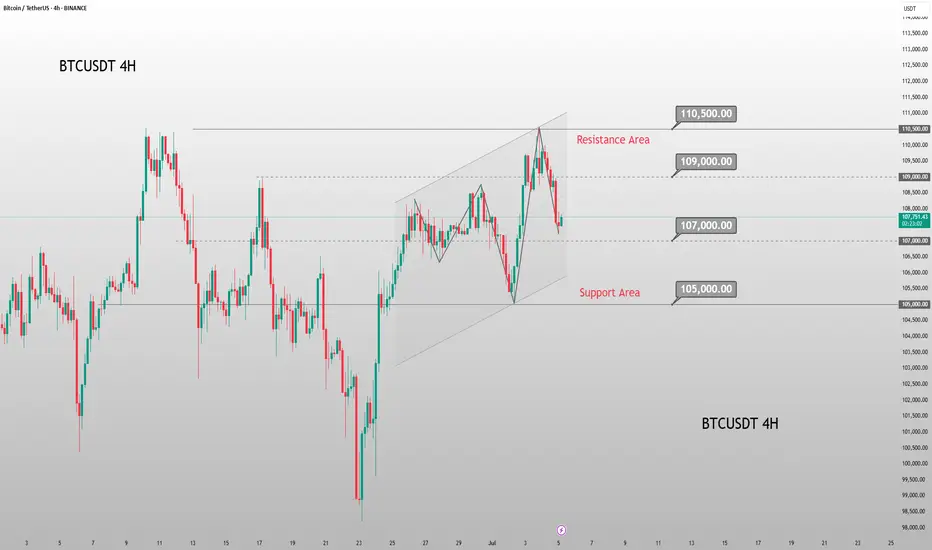
Evening BTC Trend Analysis and Trading SuggestionsLet's review this afternoon's market performance. The BTC price, as we anticipated, rebounded to around 109,000 in the afternoon before plummeting sharply. Living up to "Black Friday", this violent drop was well within our expectations. In the afternoon's live trading, we also reminded everyone that as long as there was a rebound to the upper zone, it was a good opportunity to go short. This drop has created a space of nearly 1,500 points. Currently, the BTC price has pulled back to around 107,800.
From the current 4-hour K-line chart, after a strong upward surge, the market encountered significant resistance near the upper track of the Bollinger Bands. As bullish momentum gradually faded, the price started to come under pressure and decline, suggesting that the short-term upward trend may come to a temporary halt. At present, the market has recorded multiple consecutive candlesticks with large bearish bodies. The price has not only effectively broken below the key support level of the Bollinger Bands' middle track but also caused the Bollinger Bands channel to switch from expanding to narrowing, indicating that market volatility is decreasing. In terms of trading volume, it showed a moderate increase during the price pullback, which further confirms the authenticity of the bearish selling pressure.
BTCUSD
sell@108000-1085000
tp:107000-106000
Investment itself is not the source of risk; it is only when investment behavior escapes rational control that risks lie in wait. In the trading process, always bear in mind that restraining impulsiveness is the primary criterion for success. I share trading signals daily, and all signals have been accurate without error for a full month. Regardless of your past profits or losses, with my assistance, you have the hope to achieve a breakthrough in your investment.
Btcusdtlongs
BTCUSDT on daily support, likely to head to 109kWe have the price revisiting the daily support DS1.
This presents a long opportunity for us.
The price is likely to find support in this zone and bounce from here.
The target of this long trade shall be the daily resistance DR1 marked on the chart. This resistance zone DR1 sits around 109k area.
In case the price reaches there, it is likely to experience some pullback there.
We will reevaluate the price action on DR1 once it reaches there and decide about the next steps.
What do you think about BTC price and this trade setup presented? Share it with me in the comments.

BTCUSDT to head towards 106kBTCUSDT is currently trading inside weekly resistance zone WR1 and currently holding inside this zone. However, since it has not been rejected outrightly from there showing the strength and a high probability of it breaking this resistance and moving to the upside towards 106k area. Later we can see pullback from there towards WR1+DS1 zone testing as support and then bounce again from there towards clear sky as depicted on the chart. This structure will also create a giant inverse head and shoulder fueling the upward move later on. However, those we will assess later after more price action is there. But for now, lets focus on this long trade from weekly resistance zone WR1 to 106k.

BTCUSDT hitting daily resistance but eying weekly resisatnce 98kBTCUSDT has bounced well from weekly support WS1 and currently heading towards daily resistance DR1 around 87k-88k zone. Once it breaks this, the next target would be weekly resistance WR1 which is the next resistance on its way. This resistance is sitting around 95k-98k zone. I think, the price is eying that zone and in coming days and week we will see the price trading there. However, this WR1 zone would definitely make the price push back on firts hit. But the price will definitely make another go there before either breaking of giving up for a while again. The resistance WR1 will be the only obstacle before the price can hit all time high and beyond again. Therefore, this weekly resistance will not give the way easy as this will be a strong supply zone. But I would not worry much once the price reaches there. This will evnetually signal that we are going beyond ATH and further higher. It would be just a bit of struggle there and some consolidation and some boring price action for a while, and then there will be clear sky.

📈Quick BTCUSDT Setup using Bollinger Band📉BINANCE:BTCUSDT
COINBASE:BTCUSD
Hello Traders.
In this setup, our goal is to enter a buy or sell position based on price movements next to the middle line of the Bollinger band and pitchfork.✍
The price reacted negatively when it first touched this line and is now trying to stabilize above the middle line of the pitchfork.✍
The stabilization of the price above the pitchfork and its crossing of the middle Bollinger line starts the bullish scenario.✍
Otherwise, the downward scenario begins.✍
Tip: The 4-hour trend is still strongly bearish and there is a possibility that the price of Bitcoin will reach $69,000 and then fall again. Keep in mind, along with Bollinger, it is also important to analyze the overall structure of the trend in your timeframe.✍
Which scenario do you see as the winner in the current structure?💥
My Structural Analysis: The market will experience a bullish retracement and then return to low support levels.

BTC USDT 4 HR TF Outlook. BINANCE:BTCUSDT
According to my 4-hour BTC USDT analysis, the price is showing the same pattern as ETH. BTC is expected to move upwards from the current level of 26,598. The stop-loss for this trade is 26,350, and the target is 27,000-27,300. The last two 4-hour candles have shown a rejection on the downside, which indicates that buyers are pushing the price upwards.
In other words, the price is currently in a range, but there is bullish momentum building. Buyers are expected to push the price higher to hunt the stop-losses of sellers and to take out the liquidity on the upside.
Please note that this is just my analysis and is not financial advice. Please do your own research before making any investment decisions.

BTCUSDT long favorable at this levelNow is again a level to long bitcoin. The first target is the last level before this drop.

Bitcoin Long - Still Strong!BYBIT:BTCUSDT.P
Bitcoin is still looking strong for continued upside.
Possible Bearish Divergence printed - opportunity for slight pullback providing ideas for:
1. Entry if you missed the move
2. Adding to positions
Wait for entry trigger on pullbacks - when BTC is hot, most of the times you will not get perfect pullbacks as the
market has a habit to front run ideas and buy the pullback early.
NB: A break below the 28.8k level (zone) would provide ideas to short to the possible pullback of 25.2k.
Always having Plan A and Plan B scenarios so we can react once the markets provide an opportunity to execute our edge.
If you liked this idea or if you have your own opinion about it, write in the comments.
The information and publications are not meant to be, and do not constitute, financial, investment, trading, or other types of advice or recommendations.

BTC: Is it about to start a decline?
After a long period of fluctuation, the market has finally started to experience a downward adjustment. If you have a short position, you can now breathe a sigh of relief. My personal recommendation is to take advantage of this opportunity to reduce your position on dips.
As for long positions, we can start building positions now. The key support level is at 25K. Conservative traders can wait for the market to adjust to around 25-25.5K before entering the market, while those with large funds and aggressive strategies can directly buy on dips below 27K. Control your position size and aim for a breakout above 30K. I will continue to update my views and strategies on Bitcoin.
I have already started a million-dollar challenge, where I will operate an account and aim to earn a profit of 10 million within a month. A viewing account will be provided to allow everyone to experience how large capital positions can generate profits in the market. Let's witness it together!

BTCUSDT right on its way to monthly resistance of 35k-37k zoneLet again have a look at the monthly view. We are on the right path on the monthly resistance around 35k-37k zone. This was also mentioned in one of the posts on 29th January.
There will be some pullbacks in between but I think the probability favors that the price hits the monthly resistance.

BTCUSDT heading for next weekly resistance at 29700Weekly candle looking very strong and good. Next weekly resistance sits around 29700. Looks like price is headed first for that weekly resistance. As mentioned in one of the previous posts on jan 29th, the significant target is monthly resistance at 35k-37k range. But let us focus on the weekly first.

BTCUSD heading higher after retesting 4h support at 22860So the last post talked about getting the support around 22860 and bounce. It bounced yesterday and again today from that level which is 4 hour support area. Now it has blasted through the recent 4 hour resistance sitting at 23200.
Price is also trading currently above the monthly resistance and inside the weekly resistance zone. Lets watch the price action but it is looking promising. I think it is going to cross the recent high as it has higher probability but before that there could be a retest of 23200 level.

BTCUSDT Weekly Close UpdateIt seems, BTCUSDT could not push price through the weekly resistance. There was not enough demand at this level and now it has been put back into the old range. It seems it needs to gain some more momentum before it can break out through this weekly resistance level at 24336 level. The price has fallen also below the monthly resistance. Usually it will not be that relevant if there are many days for the monthly candle to close. But here we have only a day left and that can become a cause of concern as that may trigger a larger pullback before any further upward move. However, there is still possibility of price to put a bit further upward into the weekly resistance and consolidate there during the monthly close and a breakout later through weekly resistance after some more consolidation. Let us see how the price action develops today and tomorrow.

BTC Ready for MTRAfter quite some down trend BTC is looking like preparing the foundation for start a huge uptrend. I'd say this is the last chance to see BTC at this price. Huge pumps coming!
NFA

BTC long-term: POTENTIAL SCENARIO!!Hi guys, This is CryptoMojo, One of the most active trading view authors and fastest-growing communities.
Do consider following me for the latest updates and Long /Short calls on almost every exchange.
I post short mid and long-term trade setups too.
Let’s get to the chart!
I have tried my best to bring the best possible outcome in this chart, Do not consider it as FINANCIAL ADVICE.
#BTC LONG-TERM UPDATE:
BTC took a massive dip of about 85% again to reach a new bottom within a duration of about 396days (About 1 Year) of Bear market. The drop ended in the month of January 2019 which make the January to be a special month from my research.
After, the achieved bottom of 3081$ in January 2019, Bitcoin price begins to rally for a new ATH again, which break the previous high. This rally so far had taken about 1035days (2yrs, 8months) with a fresh ATH of 69270$. This ATH was achieved in November 2021.
This was one of the reasons why fear entered the market and the price entered a downward trend
In the third cycle, the price enters an upward trend. Banks and institutions intensively buy. Finally, the price grows by about 130% during the two ascending swings and forms a new ATH. Finally, buyers tend to buy in the range of 60,000 to 68,000. The dollar is completely lost, and organizations and institutions try to save profits and exit their transactions with a profit. Eventually, the price falls and continues to fall for a period of up to $ 33,000.
Buyers see the price range as an opportunity to invest and buy for a short time. The war between Russia and Ukraine has been going on for nearly 7 months, plunging the entire financial market into fear. Secured assets, such as gold or oil , are why we are seeing them grow these days
In general, I do not see good conditions for risky financial markets. On the other hand, the price is currently moving within a trading range, which is also a sign of the end of the downtrend and the beginning of a new cycle.
If the price wants to move as it did in the past, we should see an increase in the price of bitcoin in the coming days.
Next ATH is expected to happen in the next 2years within November to December 2024.
This chart is likely to help you in making better trade decisions if it did consider upvoting this chart.
Would also love to know your charts and views in the comment section.
Thank you

Btcusdt will Pump to 32500 Bullish peanut posible breakout Btcusdt ll pump soon becarefull enjoy
Btcusdt will Pump to 32500 Bullish peanut posible breakout
not a finanancial Advice

Bitcoin BreakoutBitcoin has been broken out from the falling wedge now the technical target is around 40,800 where we do have a massive resistance failing to breakthrough might result another dip to the downside.

BTCUSDTlast chart has hit the target beautifully .it has reached nearest structure and have turn the nvironment to bear. and Yellen is try to yell this makes uncertainty in this market i think. negetive impact of hydra ,singapore, india, ofcourse for time bieng it will be bearish. maybe for a till next week. After that its gng to to reach atleast 50K .
Enjoy the ride. managing the trades are more important than doing TA. you can gamble the market easily if you can harness the how to play around with SL and TP you will loose less . When it is blue forget about getting a negative out from it.

#BTC/USDT 2HOUR UPDATE BY CRYPTOSANDERSWelcome to this quick BTC/USDT analysis.
Firstly guy please support me by smashing the like button, commenting your thoughts about this chart, and sharing with your friends.
Let's get back to the chart as we can see BTC/USDT is currently trading inside the symmetrical triangle pattern which is a bullish triangle pattern,
According to the current scenario, btc is trading above the green MA (MOVING AVERAGE) if btc breaks the upper trend line and retests then we will see some good rally.
If BTC rejects from the green ma then we expect that btc will once again touch the $38200 - $37700 level.
Sorry for my English it is not my native language.
Do hit the like button if you like it and share your charts in the comments section.
thank you.

BTC/USDT 1DAY UPDATE BY CRYPTOSANDERSWelcome to this quick BTC /USDT 1day analysis in the chart
I have tried my best to bring the best possible outcome in this chart.
Hello folks,
BTC is likely to retest the $34500k level and continue its uptrend till $38300k. Looks like there's a power for $34500k retest from here
When that happens, we'll measure that in the next chart.
I was Bullish at $34500K, I was Bullish at $38500K, BTC is taking Bullish movement from here.
If BTC breaks below $33k this chart will become invalid.
This is not a piece of financial advice.
Sorry for my English it is not my native language.
Do hit the like button if you like it and share your charts in the comments section.
thank you.

BTC/USDT 4HOUR UPDATE BY CRYPTOSANDERSWelcome to this quick BTC/USDT 4hour analysis in the chart
I have tried my best to bring the best possible outcome in this chart.
BTC/USDT According to current scenario BTC can bounce right from the support zone from $42500 - $43000.
Show your views on this chart in comment section and don’t forget to like
And follow .
This is not a piece of financial advice.
Sorry for my English it is not my native language.
Do hit the like button if you like it and share your charts in the comments section.

BTC/USDT 1HOUR UPDATE BY CRYPTOSANDERSWelcome to this quick BTC /USDT analysis.
I have tried my best to bring the best possible outcome in this chart
Hello friends
I didn't even think that in a few hours BTC is so low power but can't do anything to the market
But the main which is the down greenline, if the use line breaks, then if BTC will dump in a few hours, then BTC's support line can be $36270, $34080, and $33030
But it's good if it bounces
Stop-loss was hit due to dumping some of my premium cal bitcoins
This is not a piece of financial advice.
Sorry for my English it is not my native language.
Do hit the like button if you like it and share your charts in the comments section.
thank you.

BTC/USDT 2HOUR UPDATE BY CRYPTOSANDERSWelcome to this quick BTC /USDT analysis.
I have tried my best to bring the best possible outcome in this chart.
Hello friends
As I mentioned in the previous chart, BTC may reverse from here
BTC has bounced to 21ma which can only come once for 21ma retest and BTC retest confirms Done thanks
As I mentioned, btc has bounced from here and it has pumped altcoins in USD pair as well.😊😊😊
This is not a piece of financial advice.
Sorry for my English it is not my native language.
Do hit the like button if you like it and share your charts in the comments section.
thank you.
