#BTCUSDT: Minor Correction In Price Then $150,000?Hi everyone,
Hope you are doing great we are witnessing some minor bearish correction in the price and think this might be a sellers trap. We think $110,000 can be a good area to buy. Our target is at $150,000 area which look possible after looking at how price recently behaved.
Btcusdtoday

Double Bullish Flag on Bitcoin — Next Rally to $135K?📊 BTCUSDT (12H) In-Depth Analysis: Major Momentum Brewing
Bitcoin (BTC) is currently exhibiting a very promising technical structure — a Double Bullish Flag, a rare yet powerful continuation formation that often precedes strong upside momentum.
This dual-pattern structure reflects market strength and smart accumulation, with bulls maintaining control while allowing for healthy pauses before potential expansion to higher levels.
---
🔍 Technical Breakdown: Double Bullish Flag Structure
🔸 1. Primary Bullish Flag:
Formed after a sharp rally from around $95,000 to $113,000 (flagpole).
Price then consolidated within a clear descending channel, forming a classic Bullish Flag pattern.
Breakout from this pattern occurred in early July, confirming bullish continuation.
🔸 2. Secondary Bullish Flag (Mini Flag):
After the breakout from the main flag, BTC formed a second smaller flag pattern — a narrow descending channel from ~$123K to ~$119K.
This is known as bullish flag stacking — a pattern of "flag on top of flag", signaling trend strength and smart consolidation.
This mini-flag now acts as a launchpad for the next potential breakout.
---
🚀 Bullish Scenario: Preparing for a Breakout
If BTC breaks above the upper resistance of the mini flag (~$123,200), it will signal a fresh bullish continuation.
🎯 Potential Upside Targets:
Conservative target: $126,000 – $128,000
Full measured move target (from flagpole): $132,000 – $135,000
✅ Confirmation criteria:
Strong candle close above $123.2K
Accompanied by rising volume and upward RSI momentum (but not overbought)
---
🧨 Bearish Scenario: Breakdown and Retest
If BTC fails to break above the flag and instead drops below the flag support (~$119,400), we may see a short-term correction.
🔻 Key Support Levels:
$117,000 – minor horizontal support
$113,000 – $115,000 – strong demand zone and previous breakout area
⚠️ As long as price holds above $113K, the broader bullish trend remains intact. A pullback to this zone could offer a prime retest-buying opportunity.
---
📌 Key Price Levels to Watch:
Level Role
$123,200 Mini-flag resistance (breakout trigger)
$121,600 Mid-range resistance
$119,400 Flag support
$117,000 Horizontal retest zone
$113,000 Major support (trend invalidation if lost)
$132K – $135K Projected breakout target
---
💡 Conclusion: BTC in Critical Zone Before Potential Expansion
This Double Bullish Flag formation is one of the most technically constructive setups BTC has shown in weeks. It reflects a strong, patient market — with bulls preparing for another leg higher.
If the breakout from the second flag confirms, Bitcoin could rally toward $135,000, backed by momentum, volume, and clean structure. However, a breakdown would only signal a short-term cooldown unless support at $113K is lost.
🧭 Stay focused on breakout confirmation, volume spikes, and market sentiment. This could be the calm before a bullish storm.
#BTCUSDT #BitcoinBreakout #BullishFlag #TechnicalAnalysis #DoubleBullFlag #BTCMomentum #BitcoinRally #CryptoOutlook #BitcoinTo135K

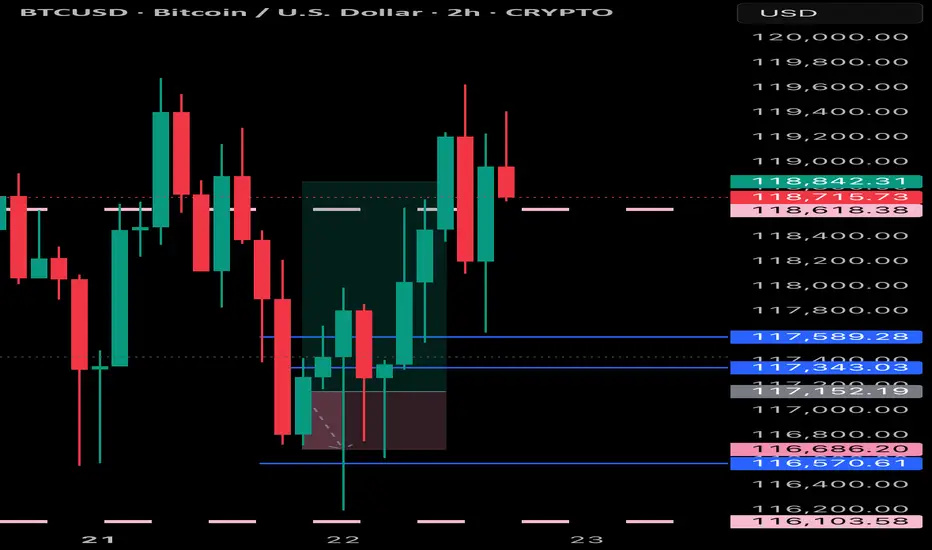
BTCUSD Daily Analysis – Golden Pocket Hold Before a Bullish?🧠 Chart Description & Market Structure:
The BTCUSD daily chart is showing a consolidation phase after forming a local high near $123,231. Currently, the price is retracing and approaching a key Fibonacci retracement zone between the 0.5 level ($115,557) and 0.618 level ($113,740) — also known as the Golden Pocket, which is often a strong reversal area.
---
📈 Bullish Scenario:
If the price holds within or just above the 0.5–0.618 Fibonacci zone (highlighted in yellow) and forms a bullish reversal candlestick (like a hammer, bullish engulfing, or pin bar), there’s a high probability for BTC to resume its uptrend.
Bullish upside targets include:
$119,842 as minor resistance.
$123,231 as the previous swing high and a key breakout confirmation.
A successful break above $123,231 could send BTC toward the next major targets around $128K–$132K.
---
📉 Bearish Scenario:
If the price fails to hold the 0.618 Fibonacci level ($113,740) and breaks down below the key psychological support at $111,500, a deeper correction may occur.
Downside targets:
$108K–$106K as the next major support zone.
A break below this could lead to the formation of a lower high structure and potentially trigger a bearish continuation.
---
📊 Pattern Observations:
Potential Bullish Flag or Rectangle Consolidation: The price action suggests horizontal consolidation after a strong rally — possibly a re-accumulation zone before a bullish continuation.
Golden Pocket Retest: Price is currently testing the Fibonacci 0.5–0.618 zone, often targeted by institutional buyers and technical traders as a potential entry point.
---
🧭 Key Levels to Watch:
Major Resistance: $123,231 (swing high)
Minor Resistance: $119,842
Fibonacci 0.5: $115,557
Fibonacci 0.618: $113,740
Key Support: $111,500
---
🔖 Conclusion:
BTC is currently in a decision zone. Price action within the $115,500–$113,700 range will be crucial. Will this be a healthy retracement before the next leg up — or the beginning of a deeper correction?
#BTCUSD #BitcoinAnalysis #CryptoTA #FibonacciRetracement #CryptoChart #BitcoinDaily #BullishSetup #BearishSetup #CryptoMarket

BTCUSD RECAPBITCOIN has preformed as expected in short period of time can continue even more to the up side but will wait for good entries
#BTCUSDT(BITCOIN): Another Small Correction And Bounce Straight Bitcoin reached a record high of 125k, but then its price started to drop and is currently trading at 115k. We expect the price to reverse from the 110k area and continue its bull move towards the potential next target of 150k. Keep an eye on the price to see if it falls below our area of interest.
Good luck and trade safely!
Team Setupsfx_
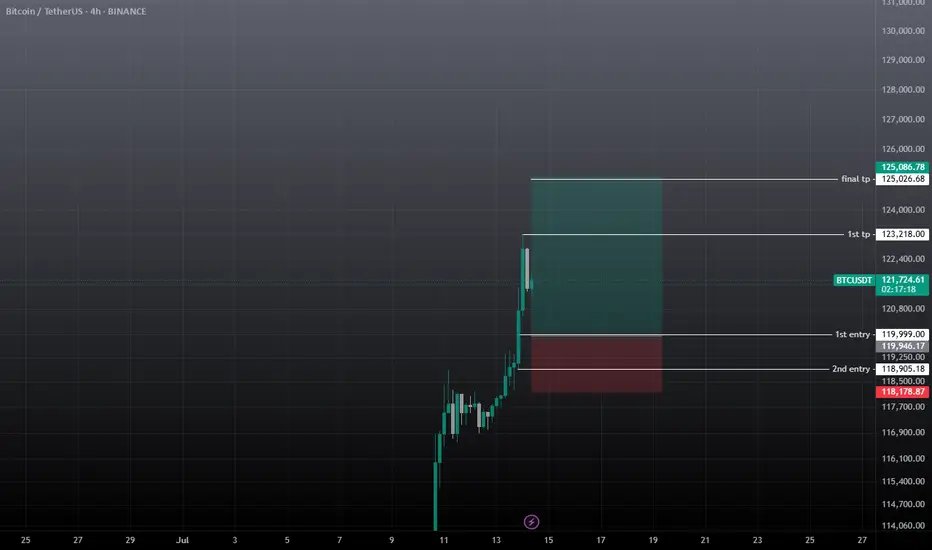
btcusdt buy / long scalp setupWait for the entry and must use sl on all trades, if tp achieves first then ignore it.
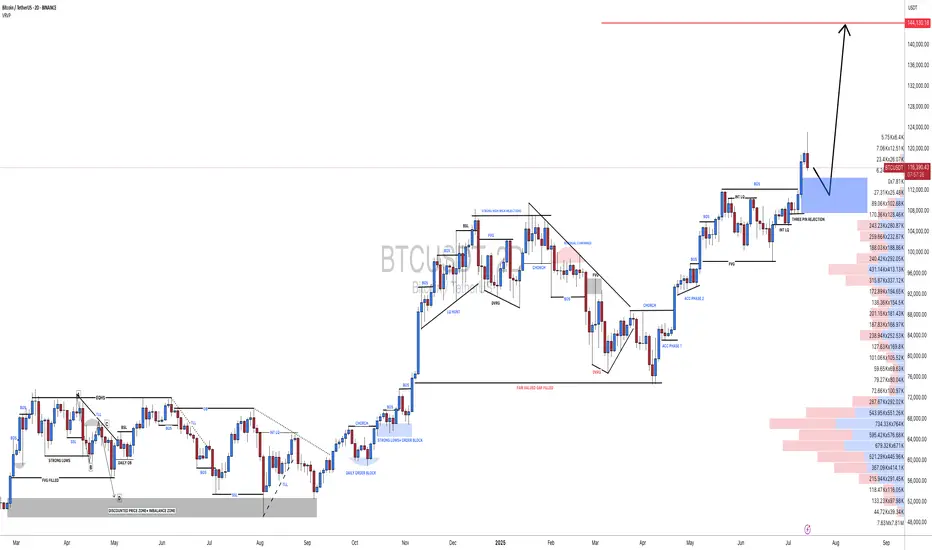
BTCUSDT[BITCOIN]:Price is Likely to be Heading Towards $144,000.Recently, Bitcoin has shown extreme bullish price behaviour, and there’s no sign of bearish influence in the market. After monitoring the price since May 4th, we believe there’s a high possibility of price hitting the 120k region first. This could be followed by a small correction around 105k, where a strong bullish price influence will lead the price to our final target at 140k. Both fundamental and technical factors support this view, but it doesn’t guarantee the price will follow our expectations.
Before investing or trading cryptocurrencies, do your own research as they carry significant financial risk. This chart analysis is for educational or secondary purposes only.
Good luck and trade safely.
If you want to support and encourage us, you can do the following: ❤️
-Like the idea
-Comment the idea
-Share ;)
Team Setupsfx_

#BITCOIN: Accumulated Volume, Time For $150,000Bitcoin has accumulated nicely, but we don’t expect the price to distribute strongly towards $150k. We have set two targets: 125k and a swing target at 150k. Remember to have a confirmation before entering.
Good luck and trade safely,
Team Setupsfx_

#BTCUSDT: Major Bearish Correction?Bitcoin is currently undergoing a correction following its recent peak. While the initial price decline appeared insignificant, it has since experienced a substantial drop, suggesting a substantial volume of selling activity in the market.
We anticipate two potential areas where the price could reverse and resume its upward trajectory. These areas could lead to a price of 110,000, followed by 120,000, and ultimately reaching 150,000.
We strongly recommend that you implement rigorous risk management measures and conduct your own analysis before making any investment decisions.
Best regards,
Team Setupsfx_

Bitcoin – Ritual Latency & Tactical Tension.⊢
⟁ BTC/USD – Binance – (CHART: 1H) – (June 21, 2025).
⟐ Analysis Price: $103,909.52.
⊢
⨀ I. Temporal Axis – Strategic Interval – (H1):
▦ EMA9 – ($103,783.82):
∴ The price oscillates around EMA9 with marginal bullish slope;
∴ Two candle rejections confirmed the EMA9 as a reactive short-term axis;
∴ Current close is above, but lacking directional follow-through.
✴️ Conclusion: Momentum attempt, yet unsupported – fragility persists.
⊢
▦ EMA21 – ($103,869.74):
∴ Flattened trajectory overlapping EMA9;
∴ Indicates tactical compression – a latency band rather than trendline;
∴ No breakout confirmation.
✴️ Conclusion: Equilibrium zone – direction undecided.
⊢
▦ EMA50 – ($104,212.18):
∴ Serves as immediate dynamic resistance;
∴ Price has not closed above since June 20, 13:00 UTC;
∴ Requires sustained move to invalidate micro-downtrend.
✴️ Conclusion: Key reversal barrier – price remains below structural trigger.
⊢
▦ SMA100 – ($104,552.65):
∴ Downsloping, acting as mid-term ceiling;
∴ No candle engagement in recent sessions;
∴ Confluence zone with EMA50 adds density.
✴️ Conclusion: Inertial resistance zone – trend continuity until breach.
⊢
▦ SMA200 – ($105,197.18):
∴ Highest structural ceiling on H1;
∴ Remains untouched, reinforcing broader tactical bearish bias.
✴️ Conclusion: SMA200 maintains bearish structure – trend remains capped.
⊢
▦ Bollinger Bands - (20,2):
∴ Bands tightened – low volatility configuration;
∴ Upper band slightly expands – minor opening signal;
∴ Price contacts upper range without strength.
✴️ Conclusion: Potential breakout pattern – requires volume ignition.
⊢
▦ RSI (14, smoothed by EMA9) – (11.00 | Avg: 13.85):
∴ RSI at historical low – indicative of exhaustion rather than momentum;
∴ EMA of RSI confirms suppressed structure;
∴ Hidden divergence plausible but not confirmed.
✴️ Conclusion: Latent reversal conditions – needs confirmation from RSI reclaim.
⊢
▦ MACD (12,26,9) – (MACD: 88.35 | Signal: -159.25 | Histogram: -247.60):
∴ Histogram remains negative but is narrowing;
∴ MACD line curling upward, approaching signal;
∴ No crossover yet – early recovery signal under surveillance.
✴️ Conclusion: Bullish divergence forming – reversal not validated.
⊢
▦ ATR (14, RMA) – (372.44):
∴ Volatility decreasing after a local spike;
∴ Range-bound structure indicates compression, not impulse.
✴️ Conclusion: Tactical latency – volatility may reawaken post-volume.
⊢
▦ Volume (21):
∴ Faint increase in last bullish candle – still below strategic threshold;
∴ Lacks institutional confirmation.
✴️ Conclusion: Spot activity insufficient – neutral, vulnerable structure.
⊢
🜎 Strategic Insight – Technical Oracle:
∴ H1 presents structural compression between EMA9/21/50, confirming tactical latency;
∴ RSI at deep oversold – signal of exhaustion, not yet momentum;
∴ Bollinger and MACD show early signs of kinetic preparation;
∴ The market is postured, not reactive – awaiting a directional event.
✴️ Tactical View: Structurally Neutral – Momentum Suspended, entry only upon RSI/Volume confirmation and MACD validation.
⊢
∫ II. On-Chain Intelligence – (Source: CryptoQuant):
∴ Update as of June 21, 2025 – Synchronized to H1 Structural Reading.
▦ Exchange Netflow Total – (All Exchanges) – (+692 BTC):
∴ Positive net inflow detected over 24h;
∴ Suggests moderate sell-side liquidity entering exchanges;
∴ Reflects defensive posturing, not panic-driven behavior.
✴️ Conclusion: Mild bearish pressure – not sufficient to invalidate structural base.
⊢
▦ Spot Taker CVD - (Cumulative Volume Delta, 90-day):
∴ Dominance of Taker Sell Volume confirmed – aggressive sellers remain in control;
∴ Pattern consistent over the last 6 sessions;
∴ No divergence between volume behavior and price structure.
✴️ Conclusion: Market remains tactically sell-biased – momentum driven by taker aggression.
⊢
▦ Spent Output Profit Ratio (SOPR) – (1.009):
∴ Marginally above 1.00 – coins being spent in mild profit;
∴ Absence of capitulation, but also no sign of deep conviction among holders;
∴ Stable rotation, not breakout-driven.
✴️ Conclusion: Structural neutrality – market is churning without direction.
⊢
▦ Adjusted SOPR (aSOPR) – (≈1.00):
∴ Flat – confirms lack of distribution or panic;
∴ Historically aligns with consolidation regimes.
✴️ Conclusion: Supply behavior is balanced – trend-neutral reading.
⊢
▦ Open Interest – All Exchanges – ($34.01B):
∴ Remains elevated – indicative of speculative leverage;
∴ Elevated risk of liquidation cascade on directional volatility;
∴ OI rising faster than spot volume = synthetic exposure dominating.
✴️ Conclusion: Market structurally exposed – fragile to external triggers.
⊢
▦ Funding Rate – All Exchanges – (-0.003):
∴ Slightly negative – shorts funding longs;
∴ Suggests bearish bias among leveraged participants;
∴ Conditions ripe for short squeeze if spot demand increases.
✴️ Conclusion: Contrarian setup building – tactical upside risk exists.
⊢
🜎 Strategic Insight – On-Chain Oracle:
∴ Metrics reflect a market under cautious speculative tension;
∴ No broad liquidation, no long-term holder exit – base intact;
∴ Taker dominance and leverage build-up suggest reactive positioning;
∴ System is neutral-leaning fragile – vulnerable to both triggers and traps.
✴️ Tactical Note: "Structurally Stable – Tactically Unsettled"
⊢
⧉ III. Contextvs Macro–Geopoliticvs – Interflux Economicus:
∴ Macro Landscape Reference – June 21, 2025.
▦ United States – Federal Policy & Risk Layer:
∴ Treasury Yield Curve remains slightly positive (+0.44%), removing short-term recession signal;
∴ 10Y yield elevated at 4.42% – reflects sustained inflation resistance and risk demand;
∴ Fed maintains QT stance – no rate cuts expected before September;
∴ Tension with Iran intensifying – military rhetoric entering fiscal discourse.
✴️ Conclusion: U.S. macro acts as compression catalyst – neutral on surface, volatile underneath.
⊢
▦ Strategic Bitcoin Reserve – (Executive Order – Trump):
∴ Recent Executive Order establishes BTC as sovereign asset class;
∴ Adds policy-level legitimacy to institutional accumulation;
∴ Reflects shift from “hedge” to “strategic reserve logic”.
✴️ Conclusion: Structural bull signal – narrative transition confirmed.
⊢
▦ China – Internal Stimulus & Soft Deflation:
∴ PPI negative at -3.3%, Retail Sales up 6.4% – stimulus-driven divergence;
∴ Fiscal revenue declining YTD – systemic drag despite easing;
∴ Not a current volatility driver.
✴️ Conclusion: China is neutral to crypto – reactive, not directive.
⊢
▦ European Union – Disinflation & Monetary Drift:
∴ HICP falls to 1.9%, ECB cuts deposit rate to 2.00%;
∴ PMI Composite < 50 – economic contraction quietly progressing;
∴ Forward guidance hesitant.
✴️ Conclusion: EU remains marginal – supportive for risk, but not catalytic.
⊢
▦ Global Fragmentation & SWIFT Erosion:
∴ Geopolitical blocs continue diverging – dollar-reliant systems weakening;
∴ Bitcoin seen increasingly as transactional hedge in sanctioned environments;
∴ De-dollarization dynamic accelerating.
✴️ Conclusion: Bitcoin positioned as neutral monetary rail – volatility shield and escape valve.
⊢
🜎 Strategic Insight – Interflux Macro Oracle:
∴ U.S. remains the dominant macro variable – its monetary and geopolitical stance defines volatility posture;
∴ Bitcoin structurally benefits from institutional legitimacy, but tactically suspended by risk-off layers;
∴ The system is internally calm, externally tense – volatility is downstream of Powell and geopolitical shock.
⊢
⌘ Codicillus Silentii – Strategic Note:
∴ Temporal structure remains compressed, yet technically reactive;
∴ On-chain behavior supports latent structural integrity, but reveals synthetic tension;
∴ Macro axis introduces dual asymmetry – stability in policy, instability in conflict;
∴ The system is in latency – not due to certainty, but due to mutual hesitation.
⊢
𓂀 Stoic-Structural Interpretation:
▦ Structurally Bullish.
∴ The underlying structure - long-term moving averages, exchange reserves, macro narrative, and holder behavior - remains intact and upward-biased;
∴ There is no technical breakdown or structural disassembly;
∴ It is the silent foundation - the “floor” of the chart remains elevated.
⊢
▦ Tactically Suspended.
∴ Although the structure points to strength, the present moment neither demands nor validates action;
∴ There is no volume, no ignition signal, no confirmation flow;
∴ Thus, the tactic is suspended - the trader (or observer) is in a disciplined state of observation, not execution.
⊢
⧉
⚜️ Magister Arcanvm (𝟙⟠) – Vox Primordialis!
𓂀 Wisdom begins in silence. Precision unfolds in strategy.
⧉
⊢

BTC Trend Analysis and Trading Recommendations for TodayThe BTC market continues its sideways-down trend, with notably insufficient rebound momentum during the session. Although there were brief signs of stabilization in the early trading, bearish forces continued to exert pressure during the European session, and the index showed a staircase decline.
From the 4-hour chart analysis, the price once fell to touch the middle Bollinger Band support during the Asian session, followed by a technical rebound. However, the rebound strength was obviously weak, encountering strong resistance near the middle band. The current candlestick pattern presents a typical Dark Cloud Cover, the MACD indicator continues to release volume below the zero axis, with fast and slow lines in bearish alignment.
Technically, the price remains significantly pressured near the middle band, and the US session is likely to extend the existing downtrend. Investors are advised to maintain a bearish stance. If the price effectively breaks below the middle band support, the next target is targeted at the lower Bollinger Band. Strategically, fading rallies remains the preferred approach.
BTCUSD
sell@106500-106000
tp:105000-104000

Evening BTC Trend Analysis and Trading RecommendationsDuring the morning session, the Bitcoin price continued its upward momentum from the previous night, surging to an intraday high of 110,653. Subsequently, as bullish momentum gradually waned, the price entered a volatile downward channel. Consecutive bearish candles triggered a significant retracement of earlier gains. In the afternoon, supported by the hourly moving average, Bitcoin saw a brief rebound, climbing to 109,852 as U.S. stocks opened. However, bears quickly regained control, pushing the price down to 108,282 before stabilizing, after which it entered horizontal consolidation. The current price remains around 109,000. Notably, our previous short strategy at 109,800 precisely aligned with the trend, successfully realizing the expected profit.
Current trading advice: Consider light short positions within 109,400–109,700, targeting around 108,500. If the price effectively holds support and stabilizes at 108,500, you may attempt light long positions to speculate on a rebound.
BTCUSD
sell@109400-109700
tp:108500-107500

Analysis of the Current BTCUSD Trend and Trading RecommendationsFrom a technical perspective, the bearish trend in BTC is temporarily dominant. On the four-hour chart, the price has trended downward with consecutive negative candles after being pressured, clearly indicating a bearish trend. Although small lower shadows suggest that bulls and bears are still locked in a tug-of-war, the RSI indicator is near the overbought zone at 70, and while the MACD remains positive, its momentum continues to weaken—both signals imply insufficient upward momentum and lingering adjustment pressure.
On the hourly chart, BTC has entered a consolidation phase with alternating positive and negative candles after a unilateral downward move. Currently, the Bollinger Bands are narrowing and moving sideways, indicating that future volatility may be limited. The price is now hovering near the upper band of the range, facing technical resistance.
In terms of the afternoon trading strategy, given the bearish dominance and fading upward momentum, the focus should remain on shorting at highs. Aggressive traders can lightly position for short-term rebounds but must use small positions and set strict stop-losses; prudent traders should wait patiently for higher levels to initiate short positions.
BTCUSD
sell@109800-110300
tp:108500-107500
Investment itself is not the source of risk; it is only when investment behavior escapes rational control that risks lie in wait. In the trading process, always bear in mind that restraining impulsiveness is the primary criterion for success. I share trading signals daily, and all signals have been accurate without error for a full month. Regardless of your past profits or losses, with my assistance, you have the hope to achieve a breakthrough in your investment.

earish trand analysis Read The ChaptianSMC trading point update
Technical analysis of (BTC/USDT) based on the 4-hour timeframe. Here’s a detailed breakdown of the analysis and the idea behind it:
---
Key Components of the Analysis:
1. Resistance Zone (FVG - Fair Value Gap):
The yellow zone marked as “fvg resistance level” indicates an area where price previously dropped quickly, suggesting inefficiency or imbalance in the market.
Price is approaching this zone again, which acts as a strong resistance.
2. Trendline & Lower Highs:
A descending trendline (with red arrows) shows consistent lower highs, indicating ongoing bearish pressure.
Each rejection from the trendline reinforces sellers’ dominance.
3. CHOCH (Change of Character):
The label “choch” signifies a market structure break, where bullish structure turned bearish.
This marks the transition to a downtrend.
4. EMA 200 (Exponential Moving Average):
The EMA (currently around 102,753) acts as dynamic support.
Price is currently trading above it, but a rejection from the resistance may push it below.
5. Target Zone:
A yellow box near 100,817.99 is labeled “target point”, indicating a possible short-term bearish target if price gets rejected at resistance.
6. RSI (Relative Strength Index):
RSI is around 47.11, slightly below neutral (50), suggesting bearish momentum could be building.
No clear oversold or overbought conditions yet.
---
Trade Idea Summary:
Bias: Bearish
Scenario:
If price reaches the resistance zone (~106,800–107,500) and fails to break above, a sell-off is expected.
First target: 100,800–101,000 zone
Price may also dip below EMA 200 confirming bearish strength.
Confirmation:
Rejection candle or bearish engulfing pattern near resistance.
RSI staying below 50 and starting to dip.
Invalidation:
Clean breakout and close above the resistance zone and trendline (~108,000+).
Mr SMC Trading point
---
Conclusion:
This chart sets up a high-probability short trade around the resistance area, leveraging both structural and momentum indicators. It suggests waiting for confirmation of rejection before entering, targeting the previous support and imbalance zone below.
Pales support boost 🚀 analysis follow)

BTC/USD) Make some trand analysis Read The ChaptianSMC trading point update
Technical analysis of Bitcoin (BTC) against USDT on a 4-hour timeframe using key price action concepts. Here's a breakdown of the idea conveyed:
Key Elements in the Chart:
1. Support and Resistance Zones:
Support Level (Yellow Boxes): Indicate areas where buying interest is strong enough to prevent the price from falling further.
Resistance Level: Zones where selling interest is strong enough to halt upward price movement.
These zones have been respected multiple times and serve as potential trade entry or exit points.
2. Breakout Strategy:
The chart highlights breakout points (black circles) above resistance zones, signaling strong bullish momentum.
After breaking resistance, price typically retests the zone as new support before moving higher—this is a classic breakout and retest structure.
3. Target Projection:
The vertical lines represent measured move projections, likely using the height of the prior consolidation range to estimate the next move.
The target point is marked around $112,559.59, indicating a bullish target following the breakout.
4. 200 EMA (Exponential Moving Average):
The 200 EMA at $96,827.38 acts as dynamic support, showing the overall bullish trend is intact.
5. RSI (Relative Strength Index):
RSI values (54.97 and 52.87) suggest neither overbought nor oversold conditions, implying room for further upside.
Mr SMC Trading point
---
Conclusion:
The analysis suggests a bullish continuation setup:
BTC has broken out from a consolidation range.
Retesting previous resistance as support.
The bullish target is $112,559.59 based on the breakout projection.
The trend remains bullish as long as price stays above the support zone and 200 EMA.
Pales support boost 🚀 analysis follow)

Shorting Analysis on Bitcoin - Fxdollars- {15/04/2025}Educational Analysis says that BTCUSD may give countertrend opportunities from this range, according to my technical analysis.
Broker - BITSTAMP
So, my analysis is based on a top-down approach from weekly to trend range to internal trend range.
So my analysis comprises of two structures: 1) Break of structure on weekly range and 2) External pushback to fill the remaining fair value gap
Let's see what this pair brings to the table for us in the future.
Please check the comment section to see how this turned out.
DISCLAIMER:-
This is not an entry signal. THIS IS ONLY EDUCATIONAL PURPOSE ANALYSIS.
I have no concerns with your profit and loss from this analysis.
I HAVE NO CONCERNS WITH YOUR PROFIT OR LOSS,
Happy Trading, Fx Dollars.

BTCUSDT: Drops Towards $53000 region may help us hitting $80000.BINANCE:BTCUSDT price currently in making of AB=CD pattern, it is likely to touch and reject at the $53000 which area remain crucial for most of the swing investors. The following news we can significant impact in the crypto market also 50k to 53k area remain extremely bullish. With accurate entry at 530000 area when we can target 80-100k possibly.

BTCUSDT: Safe Zone Vs Risk Zone, Which one would you choose? Dear Traders,
WE have possible buying opportunities, with the first entry, the only reason that we think that price would reverse is, possible end of year bullish push which may take price to another record higher high. Although, since the price already has rejected we think price is unlikely to reject at the level, and may drop to 75k region.
good luck.

#BITCOIN: Another drop and then Swing Bounce $125,000The current market sentiment is bearish, indicating a potential further decline towards the 65k price point. However, we anticipate a rebound towards the 125k region. As we approach the 65k threshold, we expect a substantial price increase.
To make informed investment decisions, it is crucial to observe a strong bullish trend before considering any bullish entries.
For more insights and market analysis, please like and comment.🚀❤️
Team Setupsfx_

Trading suggestions for BTCTwo days ago, I accurately predicted that the price of BTC would break through 97,500! 🚀
Currently, BTC is finding it difficult to break through the resistance level of 98,000 ⚠️. Given the current situation, it is recommended to decisively adopt a short-selling strategy at a high price level 📉.
⚡⚡⚡ BTCUSD ⚡⚡⚡
🚀 Sell@97500
🚀 TP 96000 - 95000 - 94000
Accurate signals are updated every day 📈 If you encounter any problems during trading, these signals can serve as your reliable guide 🧭 Feel free to refer to them! I sincerely hope they'll be of great help to you 🌟

The decisive day of major data (BTCUSD)Yesterday, it was mentioned that the expectation of continuing to buy after a retracement of 96k was completely correct. Followers also made good profits.
BTCUSD bulls are still strong. The retracement is mainly long trading, which needs to be paid attention to at present. 96k/95k are both good buying opportunities.
TP98K-100K

Can BTCUSD continue to be purchased? The answer is definitely.Can BTCUSD continue to be purchased? The answer is definitely.
The current trend is a rebound trend after a volatile decline. The space for a short-term increase of 1,500 points is very simple. The target position is 94,700-95,200. Friends who like to do short-term swing trading can follow.

In - depth Analysis of BTC: Can the 97,000 Target be Achieved?96000: This is the resistance level near the upper trend - line of the current ascending wedge. The price has tested this area several times but failed to break through effectively, indicating strong selling pressure at this level 💥.
⚡⚡⚡ BTCUSD ⚡⚡⚡
🚀 Buy@92000 - 93000
🚀 TP 95000 - 96000 - 97000
Accurate signals are updated every day 📈 If you encounter any problems during trading, these signals can serve as your reliable guide 🧭 Feel free to refer to them! I sincerely hope they'll be of great help to you 🌟
