BTC BREAKOUT!! READY TO PUMP!! Hi guys, This is CryptoMojo, One of the most active trading view authors and fastest-growing communities.
Do consider following me for the latest updates and Long /Short calls on almost every exchange.
I post short mid and long-term trade setups too.
Let’s get to the chart!
I have tried my best to bring the best possible outcome in this chart, Do not consider it as FINANCIAL ADVICE.
BTC UPDATE:
In short a time, BTC is making this descending broadening wedge pattern or currently, it is retesting it.
let's see how the market reacts in a few hours.
This chart is likely to help you in making better trade decisions if it did consider upvoting this chart.
Would also love to know your charts and views in the comment section.
Thank you
Btcusdtoday

BTC UPDATE: LOOKING LIKE BTC IS AT RESISTANCE Hi guys, This is CryptoMojo, One of the most active trading view authors and fastest-growing communities.
Do consider following me for the latest updates and Long /Short calls on almost every exchange.
I post short mid and long-term trade setups too.
Let’s get to the chart!
I have tried my best to bring the best possible outcome in this chart, Do not consider it as FINANCIAL ADVICE.
#BTC/USDT ANALYSIS
It is currently rejecting from the marked horizontal resistance, where EMA55 and MA100 are also acting as resistance. RSI is showing hidden bearish divergence. MACD crossover is showing bullish momentum. We've to wait for a sustain breakout above the horizontal resistance to confirm it's bullish trend.
This chart is likely to help you in making better trade decisions if it did consider upvoting this chart.
Would also love to know your charts and views in the comment section.
Thank you

BTC WILL BOUNCE OR IT WILL RETEST THE 30K LEVEL?Hi guys, This is CryptoMojo, One of the most active trading view authors and fastest-growing communities.
Do consider following me for the latest updates and Long /Short calls on almost every exchange.
I post short mid and long-term trade setups too.
Let’s get to the chart!
I have tried my best to bring the best possible outcome in this chart, Do not consider it as FINANCIAL ADVICE.
#BTC exclusive update:
In 3-Days timeframe, Bitcoin is Moving Above the 39k Crucial Support line & MA200 (39.8k)
RSI is Still Moving below the Trendline Resistance.
If Bulls reclaimed the 45k S/R level, It'll Open the Doors for 51.8k
If Bitcoin lost the 39k Support then Next Stop would be 33k Area.
Let's see how the daily candle closes.
This chart is likely to help you in making better trade decisions if it did consider upvoting this chart.
Would also love to know your charts and views in the comment section.
Thank you

BTCUSDT - Lets do itmy last idea
What do you think of this idea? What is your opinion? Share it in the comments📄🖌
If you like the idea, please give it a like. This is the best "Thank you!" for the author 😊
P.S. Always do your own analysis before a trade. Put a stop loss. Fix profit in parts. Withdraw profits in fiat and reward yourself and your loved ones

BTC DAILY TF UPDATE Hi guys, This is CryptoMojo, One of the most active trading view authors and fastest-growing communities.
Do consider following me for the latest updates and Long /Short calls on almost every exchange.
I post short mid and long-term trade setups too.
Let’s get to the chart!
I have tried my best to bring the best possible outcome in this chart, Do not consider it as FINANCIAL ADVICE.
Welcome to this BTC /USDT update
As you see in the chart, BTC is trading inside a rising channel and currently sitting at the support of the 100ma. In the past scenarios, we have seen BTC bounce and reject many times after breaking and retesting this 100ma. So I'm expecting a bounce in the market from this Support.
Let’s see how the market react in a few hours.
This chart is likely to help you in making better trade decisions if it did consider upvoting this chart.
Would also love to know your charts and views in the comment section.
Thank you

BTC BREAKDOWN THIS DESCENDING TRIANGLE!!Hi guys, This is CryptoMojo, One of the most active trading view authors and fastest-growing communities.
Do consider following me for the latest updates and Long /Short calls on almost every exchange.
I post short mid and long-term trade setups too.
Let’s get to the chart!
I have tried my best to bring the best possible outcome in this chart, Do not consider it as FINANCIAL ADVICE.
BTC update:-
As per my previous chart, BTC breakdown this descending triangle pattern currently is retesting the 39.2k resistance if it retest successfully then we can expect a drop up to
if it breaks the upper resistance then the chart will become invalid.
let's see how the market reacts in a few hours.
This chart is likely to help you in making better trade decisions if it did consider upvoting this chart.
Would also love to know your charts and views in the comment section.
Thank you

BTC DO OR DIE CONDITION!!!Hi guys, This is CryptoMojo, One of the most active trading view authors and fastest-growing communities.
Do consider following me for the latest updates and Long /Short calls on almost every exchange.
I post short mid and long-term trade setups too.
Let’s get to the chart!
I have tried my best to bring the best possible outcome in this chart, Do not consider it as FINANCIAL ADVICE.
BTC update:-
As per my previous chart, BTC is making this symmetrical triangle pattern and currently, it is making this bullish flag pattern but for both patterns, we have to wait for breakouts.
Here we have two scenarios
First scenario: If BTC breakout this symmetrical triangle pattern with confirmation then we can expect a bounce from here.
The Second scenario: In the second scenario we can see that it is making a bearish Flag pattern but currently, it is on the support of the Lower Level of a symmetrical triangle also if it breaks this level with confirmation then we can accept a drop up to 49,400k level.
if it breaks the lower important support then the chart will become invalid.
let's see how the market reacts in a few hours.
This chart is likely to help you in making better trade decisions if it did consider upvoting this chart.
Would also love to know your charts and views in the comment section.
Thank you

BTCUSDT time to big entryWhat do you think of this idea? What is your opinion? Share it in the comments📄🖌
If you like the idea, please give it a like. This is the best "Thank you!" for the author 😊
P.S. Always do your own analysis before a trade. Put a stop loss. Fix profit in parts. Withdraw profits in fiat and reward yourself and your loved ones

BTCUSDT - a triangleWhat do you think of this idea? What is your opinion? Share it in the comments📄🖌
If you like the idea, please give it a like. This is the best "Thank you!" for the author 😊
P.S. Always do your own analysis before a trade. Put a stop loss. Fix profit in parts. Withdraw profits in fiat and reward yourself and your loved ones

BTC/USDT: Possible trendsHi guys, This is CryptoMojo, One of the most active trading view authors and fastest-growing communities.
Do consider following me for the latest updates and Long /Short calls on almost every exchange.
I post short mid and long-term trade setups too.
Let’s get to the chart!
I have tried my best to bring the best possible outcome in this chart, Do not consider it as FINANCIAL ADVICE.
BTC UPDATE:
In short a time, BTC is making this SYMMETRICAL triangle pattern but it's not confirmed because we have 2 scenarios.
First scenario: In the first scenario, it is looking like it's all ready broken the triangle and currently retesting it.
The second scenario: It looks like it will retest the lower support level then it will bounce from there.
if it breaks the lower important support then the chart will become invalid.
let's see how the market reacts in a few hours.
This chart is likely to help you in making better trade decisions if it did consider upvoting this chart.
Would also love to know your charts and views in the comment section.
Thank you

BTC/USDT 4 HOUR ANALYSISHi guys, This is CryptoMojo, One of the most active trading view authors and fastest-growing communities.
Do consider following me for the latest updates and Long /Short calls on almost every exchange.
I post short mid and long-term trade setups too.
Let’s get to the chart!
I have tried my best to bring the best possible outcome in this chart, Do not consider it as FINANCIAL ADVICE.
BTC UPDATE:
In short a time, BTC is making this bullish expanding triangle pattern but it's not confirmed yet.
if it breaks the important support then the chart will become invalid.
let's see how the market reacts in a few hours.
This chart is likely to help you in making better trade decisions if it did consider upvoting this chart.
Would also love to know your charts and views in the comment section.
Thank you

BTC BREAKOUT!! READY TO PUMP!!Hi guys, This is CryptoMojo, One of the most active trading view authors and fastest-growing communities.
Do consider following me for the latest updates and Long /Short calls on almost every exchange.
I post short mid and long-term trade setups too.
Let’s get to the chart!
I have tried my best to bring the best possible outcome in this chart, Do not consider it as FINANCIAL ADVICE.
BTC UPDATE:
In short a time, BTC is making this descending broadening wedge pattern or currently, it is retesting it.
let's see how the market reacts in a few hours.
This chart is likely to help you in making better trade decisions if it did consider upvoting this chart.
Would also love to know your charts and views in the comment section.
Thank you

BTC/USDT SHORTER TF UPDATE!!Hi guys, This is CryptoMojo, One of the most active trading view authors and fastest-growing communities.
Do consider following me for the latest updates and Long /Short calls on almost every exchange.
I post short mid and long-term trade setups too.
Let’s get to the chart!
I have tried my best to bring the best possible outcome in this chart, Do not consider it as FINANCIAL ADVICE.
BTC UPDATE SHORTER TF UPDATE:
In short a time, BTC is making this bullish black pattern but it's not confirmed yard it's better to wait for a certain break out to confirm the pattern.
If it breaks the lower support of this flat pattern then the chart will
invalid.
Let's see if BTC holds the $39k level or not.
This chart is likely to help you in making better trade decisions if it did consider upvoting this chart.
Would also love to know your charts and views in the comment section.
Thank you

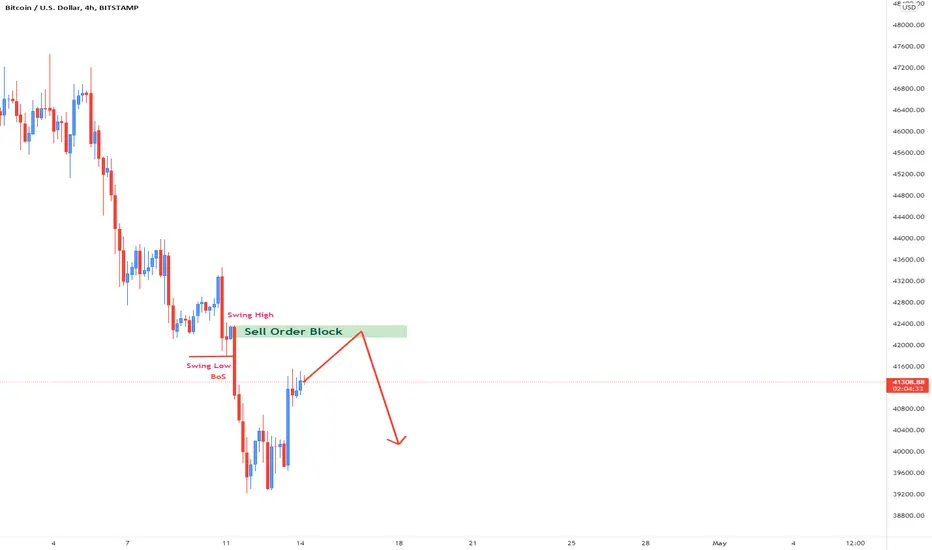
Bitcoin Prediction H4Here is my view for BTCUSD on H4. The price should go down, you can put a pending order on the Order block or find an entry on LTF within OB Zone. Trade Safe!
#BTC/USDT 1D UPDATE BY Trader_SL #BTC/USD Chart Update
2022/04/13
1D TIME FRAME
As you see in the chart, BTC is trading inside a rising channel and currently sitting at the lower level of the channel. In the past scenarios, we have seen BTC bounce many times after hitting the lower level of this channel also we can see Bitcoin now is with hidden bullish divergence So I'm expecting a bounce in the market from this level and making another Higher low.
If any daily candle closes below this channel then this scenario becomes invalidated. Let's see. I'll update you.
This is not a piece of financial advice.
Do hit the like button if you like it and share your charts in the comments section.
Thank you!

BTC IS READY FOR ANOTHER MOVE!!Hi guys, This is CryptoMojo, One of the most active trading view authors and fastest-growing communities.
Do consider following me for the latest updates and Long /Short calls on almost every exchange.
I post short mid and long-term trade setups too.
Let’s get to the chart!
I have tried my best to bring the best possible outcome in this chart, Do not consider it as FINANCIAL ADVICE.
Welcome to this BTC /USDT update. In my previous BTC update, I told you that if BTC does not hold 100D MA ($42k) then be ready for $38k-$39k so everything goes as planned so far.
So what I'm expecting now?
As you see in the chart, BTC is trading inside a rising channel and currently sitting at the lower level of the channel. In the past scenarios, we have seen BTC bounce many times after hitting the lower level of this channel. So I'm expecting a bounce in the market from this level and making another Higher low.
If any daily candle closes below this channel then this scenario becomes invalidated.
Let's see if BTC holds the $39k level or not.
This chart is likely to help you in making better trade decisions if it did consider upvoting this chart.
Would also love to know your charts and views in the comment section.
Thank you

BTC WILL BOUNCE OR IT WILL RETEST THE 30K LEVEL?Hi guys, This is CryptoMojo, One of the most active trading view authors and fastest-growing communities.
Do consider following me for the latest updates and Long /Short calls on almost every exchange.
I post short mid and long-term trade setups too.
Let’s get to the chart!
I have tried my best to bring the best possible outcome in this chart, Do not consider it as FINANCIAL ADVICE.
#BTC exclusive update:
As per my previous chart, BTC bounced from the lower support level of this ascending channel pattern currently we have two scenarios.
The first scenario:- if we hold this support then we can accept A Bounce from here up to 45k resistance.
The second scenario:- if BTC will not be able to hold this support and It Breaks this support with confirmation then we can accept a drop up to the 30k support level IMO.
Let's see how the daily candle closes.
This chart is likely to help you in making better trade decisions if it did consider upvoting this chart.
Would also love to know your charts and views in the comment section.
Thank you

BTC DO OR DIE CONDITION!!!Hi guys, This is CryptoMojo, One of the most active trading view authors and fastest-growing communities.
Do consider following me for the latest updates and Long /Short calls on almost every exchange.
I post short mid and long-term trade setups too.
Let’s get to the chart!
I have tried my best to bring the best possible outcome in this chart, Do not consider it as FINANCIAL ADVICE.
BTC UPDATE:
My previous BTC chart has been invalided.
Currently, BTC is making this ascending channel pattern and we have 2 support over here like 40.8k to 41.5k.
We have 100ma as local support but it has a broker this support already if the daily candle closes above this level.
S1- If the daily candle closes above this 100ma then we can expect to abound from here up to the 48.5k level.
S2- If the daily candle closes below this 100ma and 40.8k level then it can drop up to the 39.6k level. which is a very important key level.
39.6k level is this very important support if it breaks this level then close all positions.
Let's see how the daily candle closes.
This chart is likely to help you in making better trade decisions if it did consider upvoting this chart.
Would also love to know your charts and views in the comment section.
Thank you

IS BTC IS GOING TO RETEST THE 39k LEVEL?Hi guys, This is CryptoMojo, One of the most active trading view authors and fastest-growing communities.
Do consider following me for the latest updates and Long /Short calls on almost every exchange.
I post short mid and long-term trade setups too.
Let’s get to the chart!
I have tried my best to bring the best possible outcome in this chart, Do not consider it as FINANCIAL ADVICE.
#BTC UPDATE
It is currently losing bullish momentum but I am still bullish on it currently 100MA is acting as strong support. MACD crossover is showing bearish momentum. If we see weekly candles close below this 41.8k level support Henan that would be a bearish sign for the market.
Let's see how the market reacts in a few hours.
Stay tuned
This chart is likely to help you in making better trade decisions if it did consider upvoting this chart.
Would also love to know your charts and views in the comment section.
Thank you

BTC IS READY TO ANOTHER MOVE!!Hi guys, This is CryptoMojo, One of the most active trading view authors and fastest-growing communities.
Do consider following me for the latest updates and Long /Short calls on almost every exchange.
I post short mid and long-term trade setups too.
Let’s get to the chart!
I have tried my best to bring the best possible outcome in this chart, Do not consider it as FINANCIAL ADVICE.
In shorter TF BTC breakouts this symmetrical triangle pattern and currently it May can retest this level then we can expect a bounce up to 2.50% from here.
Let's see how the market reacts in a few hours.
Stay tuned
This chart is likely to help you in making better trade decisions, if it did do consider upvoting this chart.
Would also love to know your charts and views in the comment section.
Thank you

BTCUSDT Short into 41000 1:3RRBroke below the strong resistance where buyers struggled.
Wait for a retest of that zone
Target: 42250 and 41000 (Final target)

WILL BTC BE ADLE TO HOLD THE LEVEL?Hi guys, This is CryptoMojo, One of the most active trading view authors and fastest-growing communities.
Do consider following me for the latest updates and Long /Short calls on almost every exchange.
I post short mid and long-term trade setups too.
Let’s get to the chart!
I have tried my best to bring the best possible outcome in this chart, Do not consider it as an
#BTC/USDT ANALYSIS
My previous BTC chart got invalid currently it is on the support of this upper trendline of this symmetrical triangle pattern or we have 100 am as local support.
we can expect a bounce from here
Let's see how the market reacts in a few hours.
If it breaks this two support then the chart will be invalided.
This chart is likely to help you in making better trade decisions, if it did do consider upvoting this chart.
Would also love to know your charts and views in the comment section.
Thank you

BTCUSD SELLHi fellow traders, BTCUSD is ready to move lower from here. The trade will be invalidated if we break the red line. Target de support levels. Goodluck!
