BTC may drop back to 90,000 pointsBTC is likely to pull back to around 90,000 points before starting to rebound.
In terms of capital flow, the upward momentum of XAU/USD has been temporarily halted ⏸️, and a large amount of capital is rapidly flowing into the virtual currency market 💸! As the leader of virtual currencies, Bitcoin has undoubtedly become an important destination for capital inflows 🌟. The injection of a large amount of capital has directly driven a significant surge in the price of BTC 📈. Capital chases profits just like water flows 🌊. Against the backdrop of the phased adjustment in the gold market, Bitcoin, with its unique technological attributes and market vitality, has attracted the attention of many investors, laying a solid capital foundation for its subsequent price increase 🏗️.
At the macro policy level, Trump's remarks have had a strong impact on the financial market 😲! His change in attitude towards Fed Chairman Powell has triggered the reallocation of market funds 🔄. When he previously threatened to remove Powell, investors' concerns about the Fed's policy intensified, and they flocked to the gold market for hedging, pushing up the gold price 🚀. However, Trump's latest statement that he will not fire Powell and his call for interest rate cuts have alleviated some of the investors' anxiety, prompting funds to flow back into US dollar - denominated assets 📉. It should be noted that during this process, some of the funds withdrawn from the gold market have not fully returned to traditional US dollar assets but have flowed into the virtual currency field such as Bitcoin 💥. As an emerging digital asset, Bitcoin has both certain hedging and speculative attributes, and has become a new safe haven and value - added target for funds 💰.
In international trade, Trump has shown signs of easing in the trade negotiations with China and is trying to reach an agreement quickly to reduce tariffs (although not to zero) 🤝. The past uncertainty in trade relations was one of the important factors driving up the gold price ⚠️. With the expected easing of trade tensions, potential future trade easing measures may suppress the market demand for gold as a safe haven asset ⏳. In contrast, the Bitcoin market is less directly affected by trade policies. Instead, due to its characteristics such as decentralization and global circulation 🌐, it has gained more favor during the process of capital reallocation. When the attractiveness of traditional safe haven assets declines, the scarcity and innovation of Bitcoin make it a new choice for investors to diversify risks and pursue returns 🎯, further stimulating the market demand for BTC 📈.
⚡⚡⚡ BTCUSD ⚡⚡⚡
🚀 Sell@92000 - 92500
🚀 TP 91000 - 90000
The market has been extremely volatile lately 📈📉 If you can't figure out the market's direction, you'll only be a cash dispenser for others 💰
Btcusdtoday

BTCUSD hourly trend analysis for April 09, 2025BTCUSD made a double bottom formation. Any upward move will test the resistance at 80,047 and there is a strong support at 73,481. The Timing indicator is bullish from April 10th onwards. Trade with stop loss.

TC/USD Bearish Flag Breakdown Targeting 81,660 Support ZoneThis is a 1-hour BTC/USD (Bitcoin/US Dollar) chart showing a bearish setup. Here's the breakdown:
---
Key Observations:
1. Bearish Rejection Zone (Purple Box - ~83,174.62):
Price is showing rejection at a key resistance zone.
Both the 30 EMA and 200 EMA are above current price, adding downward pressure.
2. EMA Analysis:
30 EMA (Red Line): ~83,174.62 – acting as dynamic resistance.
200 EMA (Blue Line): ~83,715.92 – strong long-term resistance.
Price is below both EMAs, reinforcing bearish sentiment.
3. Pattern Analysis:
Bearish flag/wedge breakdown has already occurred.
Target projection based on measured move suggests a ~1.44% downside.
Anticipated drop towards 81,660.29, which aligns with prior support zone.
4. Price Action:
Recent breakdown from a small rising channel (bear flag).
Pullback to resistance (purple zone) seems complete, and continuation downward is expected.
---
Strategy Summary:
Bias: Bearish
Entry Zone: Near 83,174.62 (already rejected)
Target: 81,660.29
Stop Loss Idea: Above 83,715.92 (EMA 200)

BTCUSD hourly trend analysis for April 04, 2025It is in a bearish trend. Sell signal has confirmed the Stop Loss at 83382. This pair has a strong support at 82074 and 80900.

Is Bitcoin going to start rising?The latest U.S. economic data has brought significant impacts. The core PCE inflation witnessed a 0.4% month - on - month increase, hitting the highest growth in a year, with a year - on - year rise of 2.8%, exceeding market anticipations. Meanwhile, the long - term inflation expectation from the University of Michigan has soared to a 32 - year high, intensifying market concerns about inflation's resurgence. Currently, the market remains enveloped in macro - risks, pending a softening of market sentiment.
Turning to the Bitcoin market, as depicted in today's price trend (the current BTCUSDT price is $82,338.01, dropping by $2,086.37, a 2.47% decline), the K - line chart analysis indicates a downward trend. The Williams indicator signals an oversold condition. Additionally, trading volume has contracted recently, with both price and volume decreasing, suggesting a sluggish and inactive market.
Nevertheless, if Bitcoin can stabilize above $82,000 and there are signs of capital reflux, gradual position - building may be considered, with a target price set above $90,000. Investors must recognize that the Bitcoin market brims with uncertainties. Variables such as forthcoming U.S. economic data, regulatory policies, and geopolitical scenarios will all sway Bitcoin prices. In this volatile financial landscape, meticulous analysis and judicious decision - making are of utmost importance for investors navigating the Bitcoin market.
BTCUSDT
buy@82000-83000
tp:84500-86500
I will share trading signals every day. All the signals have been accurate for a whole month in a row. If you also need them, please click on the link below the article to obtain them.

BTC:Seize the opportunity to go long
BTC broke below 83,000 and continued to decline, reaching around the lowest level of 82,000. Currently, it generally shows a downward trend.
In my opinion, the entire bearish trend is merely a well-structured catalyst. Its function is to attract breakout sellers, create the illusion of a sustained downward trend, and trap liquidity at the low points before the true direction becomes apparent. Retail traders who short this structure are providing momentum for the next upward rally.
Before that, BTC can still be regarded as bullish, and each pullback to the demand zone can be considered as an opportunity to go long.
BTC Trading strategy:
buy@82000-82300
TP:83000-85000
Get daily trading signals that ensure continuous profits! With an astonishing 90% accuracy rate, I'm the record - holder of an 800% monthly return. Click the link below the article to obtain accurate signals now!

BTC:Today's Profit-making StrategyThe price of BTCUSDT has been moving steadily for many days and is now forming a potential bullish continuation setup.
A retracement to the 86,500 area is expected. If the price respects this area and shows a bullish reaction, a long - position opportunity emerges.
BTC Trading strategy:
buy@86500
TP:87500-88500
Get daily trading signals that ensure continuous profits! With an astonishing 90% accuracy rate, I'm the record - holder of an 800% monthly return. Click the link below the article to obtain accurate signals now!

BTC's Bull Run: Profit Realized, Resistance AheadCurrently, BTC is hovering around $88,000. We had already achieved our profit target yesterday. Ever since BTC broke through the $85,000 mark, it has been rising continuously. The market is in a bullish - dominated trend, with strong buying power driving the price up steadily. Although it's in an uptrend, there's uncertainty about its future movement as it hasn't broken through the $89,000 - $90,000 resistance range. If it fails to break through this resistance zone effectively, the price may decline again eventually.
I will share trading signals every day. All the signals have been accurate for a whole month in a row. If you also need them, please click on the link below the article to obtain them.

BTC:Today's trading strategyBitcoin is currently in a continuous fluctuating situation. Yesterday's temporary rally also indicates that it is still unable to break through the resistance level of 89,000 for the time being, and there is a downward extension trend.
The strategy of shorting at the high level yesterday has already yielded profits. Today, on the rebound at a high level, continue to take short positions.
BTC Trading strategy:
Sell@88000-88500
TP1:85500
TP2:84000
Get daily trading signals that ensure continuous profits! With an astonishing 90% accuracy rate, I'm the record - holder of an 800% monthly return. Click the link below the article to obtain accurate signals now!

BTCUSD:BTCUSD: SHORT, TP86600-85600BTCUSD now has an obvious double-head pattern, and the short opportunity is worth a try. There is support near 86600, followed by 85800. These can be used as two targets. If the support is strong during the fluctuation process, the order can be closed in advance.

BTCUSD:Wait for a rebound before going shortThe fluctuations are not big now, judging from the structure of the 30M icon. The probability of rebounding and then falling later is relatively high. My trading idea is to wait for the rebound to go short. The short orders entered near 88K yesterday are now generally profitable. They can be closed first and then entered after the rebound to prevent the price from rising directly.
Losing profits is a trivial matter, but turning from profit to loss would be very uneconomical.

BTCUSDT Rally: From $85K to $88K+, What's NextToday, the price of BTCUSDT has shown a robust upward trend. Bullish forces are extremely active, steadily propelling the price to continuously climb, demonstrating a sharp offensive momentum.
From a technical perspective, upon in - depth analysis, the current price is gradually approaching the crucial resistance range of 89,000 - 90,000.
This range has played a significant role in past price movements. Its breakthrough situation will be a pivotal turning point determining the subsequent price trend.
Once a successful breakthrough occurs, it is highly likely to attract more capital inflows, driving the price to initiate a new round of upward price action.
I will share trading signals every day. All the signals have been accurate for a whole month in a row. If you also need them, please click on the link below the article to obtain them.

BTCUSDT: Target Achieved, What's Next for 87,500 Resistance?Upon reviewing the trading strategy devised last week, the current market price has successfully rallied to the targeted level. Bitcoin against Tether (BTCUSDT) is quoted at 86,780, registering an intraday gain of 0.84%. From the vantage points of technical analysis and market dynamics, the robust resistance level in the vicinity of 87,500 above emerges as a pivotal factor in determining whether the price can sustain its upward trajectory.
I will share trading signals every day. All the signals have been accurate for a whole month in a row. If you also need them, please click on the link below the article to obtain them.
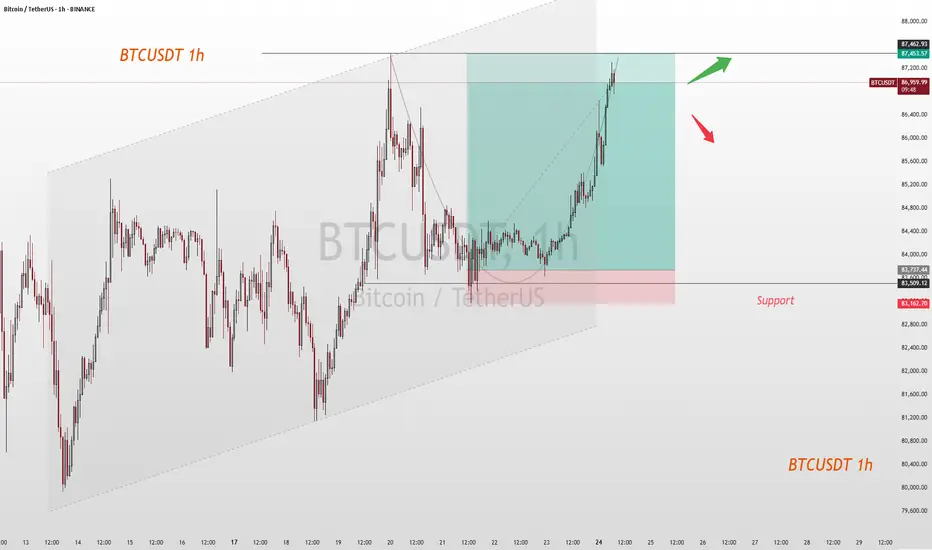
3/24 BTCUSD Trading Signal: LongThis is a relatively healthy rebound. After breaking through the first resistance, it slowly rose to the second resistance, where it has been tested many times. The current shape is good and there is room for further rise.
Therefore, in the current transaction, it is recommended to take long as an important reference direction, and the target is near the resistance of 86K.
When the price rises to this point, the market is likely to confirm the validity of the area near the 85K support. If the support is confirmed to be valid, the price may rise to 86.8K-88K.

BTC Nears Key Breakout: Can It Push Past 84.5K?Right then, BTC/USDT is at a bit of a crucial point at the moment. The buying range we flagged earlier, 82,000 - 83,500, has been left behind, with the price now sitting at 84,139.51 – up 0.06% on the day.
The target for taking profits is still 84,500 - 86,000, and we’re currently hovering near the lower end of that at 84,500. If it manages to break through that level, there’s a decent chance it could push higher – but it’s worth keeping an eye on whether the rally’s got enough steam to keep going.
Things to watch:
84,500 Breakout: If it cracks this level and holds, we could be in for more upside.
Momentum: Keep tabs on volume and market sentiment to see if this move’s got legs.
Pullback Risk: If it doesn’t break through, don’t be surprised if we see a bit of a dip.
BTCUSDT
Buy82000-83500
tp:84500-86000
I will share trading signals every day. All the signals have been accurate for a whole month in a row. If you also need them, please click on the link below the article to obtain them.

BTC Today's strategySo far, BTC has fluctuated around 84K today, and it still fluctuates within our marked range. The strategy of selling high and buying low still works.
Today's BTC trading strategy:
btcusdt buy@83K-83.5K
tp:84.5K-85.5K
There is no large-scale selling by long-term holders in the market. Short-term holders have a significant impact on short-term movements. At present, geopolitical conflicts continue, trade frictions continue, and bitcoin and gold have historically performed well in times of economic uncertainty
Our investment strategy has achieved significant returns in the past two weeks. If you also want to double your capital, you can click on my link to get my trading strategy

BTC/USD hourly trend using Market Timing AnalysisAccording to the analysis, the BTC/USD looks bearish. Trade with the stop loss.

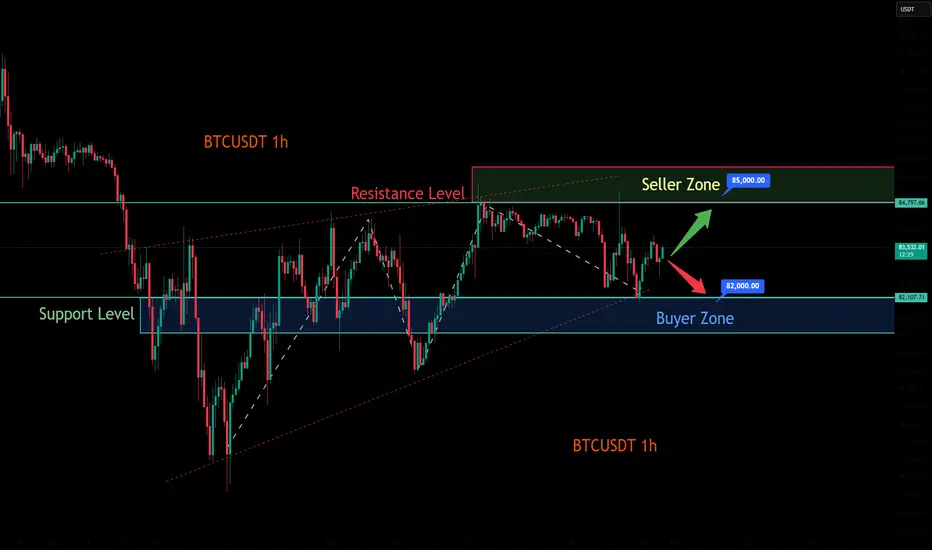
Today's Trading Strategy Analysis for BTCUSDTThe uncertainty within the global macroeconomic landscape wields a substantial influence over the trajectory of BTCUSDT.
On one hand, the escalating anticipation of a deceleration in global economic growth has spurred investors' appetite for safe - haven assets. Bitcoin, characterized by its capped supply and decentralized nature, has been singled out by a segment of investors as a viable safe - haven alternative. This perception, to a notable degree, props up its price.
Conversely, the monetary policy maneuvers of central banks globally, including potential interest rate hikes or liquidity - tightening initiatives, can markedly sway the direction of capital flows. Should funds reverse course from the high - volatility cryptocurrency sphere back into the traditional financial domain, Bitcoin's price is likely to encounter downward momentum.
Moreover, the recent upsurge in international trade tensions has thrown the global economic equilibrium into disarray. The consequent spike in market anxiety has compelled investors to re - assess their portfolio allocations, thereby exerting an indirect but significant impact on the price gyrations of BTCUSDT.
BTC trading strategies:
buy@82500-83000
tp:84500
sell@83800-84300
tp:82000
Traders, if this concept fits your style or you have insights, comment! I'm keen to hear.
For those who are seeking professional guidance in trading trend analysis, strategy formulation, and risk management, please click below to get the daily strategy updates.

BTCUSD SELL signal. Don't forget about stop-loss.
Write in the comments all your questions and instruments analysis of which you want to see.
Friends, push the like button, write a comment, and share with your mates - that would be the best THANK YOU.
P.S. I personally will open entry if the price will show it according to my strategy.
Always make your analysis before a trade

BTC:Today's Trading StrategyThis morning, BTC has challenged the 84,000 price level. Currently, it has been fluctuating around 83,000 for a certain period. There is a high likelihood that it may witness another wave of upward movement at any moment. Today, I still adhere to the long-position trading strategy.
BTC Trading strategy:
buy@82600
TP1:83600
TP2:84500
I always firmly believe that profit is the sole criterion for measuring strength. I will share accurate trading signals every day. Follow my lead and wealth will surely come rolling in. Click on my profile for your guide.

BTC Today's strategyThe support level of Bitcoin has begun to move upward. Currently, the market is still trading in the range of $80,000 to $85,000. The short-selling strategies I continuously provided have also made profits many times.
This week's BTC trading range could be broken at any time. We just need to wait for the market to show a new direction and then adjust our strategy
Today's BTC trading strategy:
btcusdt sell@85K-87K
tp:83K-81K
We will share various trading signals every day. Fans who follow us can get high returns every day. If you want stable profits, you can contact me.

Today's Strategic Layout for BTC Currently, the price of Bitcoin is fluctuating around $83,000, and the trading activity has declined. At present, the forces of bulls and bears are in an equilibrium state. Looking ahead to the subsequent market conditions, it is necessary to pay close attention to the performance of the support range between $80,000 and $82,000.
BTC trading strategies:
btcusdt sell@85K-86K
tp:82.5K-81K
sl:87K
I firmly believe realized profit and a high win - rate are the best measures of trading skill.
Daily, I share highly precise trading signals. These include clear entry points, stop - loss levels for risk control, and profit - taking targets from in - depth analysis.
Follow me for big financial market returns.
Click my profile for a trading guide on trends, strategies, and risk management.
BTC:The latest trading strategyPreviously, BTC continued to decline after approaching the resistance level.
However, it has now started to recover, and a small upward rally is expected in the short term. We can seize this opportunity and go long.
The latest trading strategy for BTC:
buy@82600
TP1:83600
