BTC/USDT 4 HOUR ANALYSISWelcome to this quick update, everyone.
If you are reading my updates for the first time do follow me to get more complex charts in a very simplified way.
I also post altcoin setups on Spot, Margin, and Futures.
I have tried my best to bring the best possible outcome in this chart.
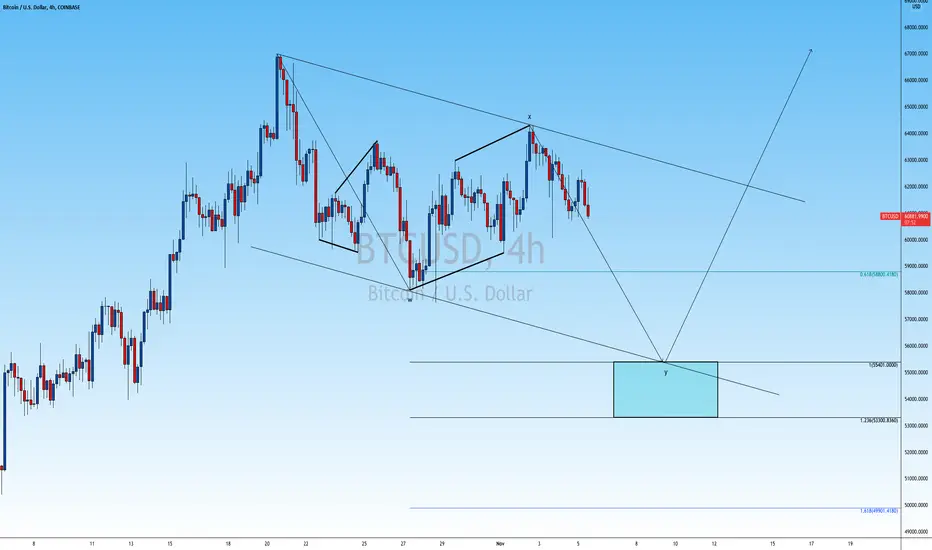
In a shorter timeframe, descending channel upside broke out was done as expected now we are bouncing from the support level.
What's your thought on this?
Do hit the like button if you like this update and share your views in the comment section.
Thank you
Btcusdtoday

BTC/USDT 1 DAY ANALYSISWelcome to this quick update, everyone.
If you are reading my updates for the first time do follow me to get more complex charts in a very simplified way.
I also post altcoin setups on Spot, Margin, and Futures.
I have tried my best to bring the best possible outcome in this chart.
In a higher time frame like daily, I am expecting a little bet correction up to $47400 and then we can expect a bounce from there.
What's your thought on this?
Do hit the like button if you like this update and share your views in the comment section.
Thank you

BTC/USDT 1 HOUR UPDATE Welcome to this quick update, everyone.
If you are reading my updates for the first time do follow me to get more complex charts in a very simplified way.
I also post altcoin setups on Spot, Margin, and Futures.
I have tried my best to bring the best possible outcome in this chart.
In a shorter timeframe, descending channel upside broke out was done as expected now we are bouncing from the support level.
let see how the daily candle closes.
What's your thought on this?
Do hit the like button if you like this update and share your views in the comment section.

btcusdt - fall soonP.S. Always do your analysis before you make a trade. Set a stop loss. Fix the profit in installments. Withdraw profit in fiat, and enjoy yourself and your loved ones

BTCUSDTWith the break of the long-term trend line, the annual decline of bitcoins to the range of 28,000 is definite

BTC next impulse coming!Hi fellow traders, BTC is making it's last wave down within this flag correction. Look for buy opportunities near the blue box. Goodluck!
BTCUSD Wait for the Trigger 🔥🔥Hello Traders , Welcome to this analysis, we are looking at the BTCUSD, the 1-hour timeframe.
My trading strategy is based on the simplicity .
Please don't forget to FOLLOW , LIKE and COMMENT .
If you like my analysis.
Thank you and Good Luck!

bitcoin 1 day price has adjusted from wave 3 what next ?? 🔥🔥bitcoin 1 day price has adjusted from wave 3 down, next wave 4 will be around 50 - 53K.
This line is both support and trendline, can buy in that area.
Wave 5 if it follows FIBO. 1.27 The target will be around 80 K.
Let's see if I can continue to wave 5 or not.
SL below trendline
Goodluck
Ton Trader
🚀🚀🚀🔥🔥🔥

Bitcoin: This week's BULLISH scenariosI explored two scenarios which could take BINANCE:BTCUSDT to 68k by next week . Use this as a guideline of what to look for during a short-term pullback.
By using resistance levels originating from its all-time high in combination with these strong Fibonacci channels, we can identify where BTC might find support in case of a short-term pullback. I marked out a potential entry zone, must such a scenario arise.
This would mark an opportunity for bitcoin to build up momentum in order to finally reach new all-time highs.
Let me know your thoughts and ideas.

BTC/USDTBTC make a H&S pattern on 4H and now breakout to downside measure is approximately 10% to red line /support.. but there is also a golden pocket like potencial support also.. and we se now is making potencial bull flag pattern where can be successful because RSI and Stoch are in oversold area.. lets see how 4h close.. cheere

BTCUSDT 1D: Possible SHORTFollowing the rebound from level 67000, there may be a fall to the support level of 54000

BTC PRICE ACTION PREDICTION⚜️Hello mates, it's been a while since i made updates on Cryptocurrencies. Miss you guys and trust you enjoyed the last massive pump in bitcoin with its reflection on alts coins. Lately, bitcoin has been consistently making huge downtrends with quick uptrend reversals after the end of the massive pump to $52.9k. This downtrend process is known as correction period because price has successfully reached the target it failed to retest in the penultimate pump to a new ATH so it's high time it started falling. As the chart implies on daily timeframe, btc is likely to retest $45.6k - $46.3k before the correction to the specified targets on chart continues. Eke, Bitcoin is probable to hit a new high but the probability is mild based on long term perspective of cryptocurrency as a whole. A weekly close above the previously retested target (52.9k) and by holding above $40k will validate a new trend to a new ATH. Otherwise, the next price action will follow the specified trend on chart and as listed on chart, three patterns are likely play out if bitcoin fails to hold $40k. They are:
1. Descending Channel Breakout
2. Double Bottom
3. Inverse Head and Shoulder
Trajectories of these patterns have been provided on chart. You can drop a line if you've got questions.
Your likes and opinions would be much appreciated, you can follow up for more helpful contents and do follow my comment sections too for quick updates.

BITCOIN TO 54K OR 44KBtc followed the last analysis i published and its currently trading at the previous high ($50.5k), chart indicates a strong resistance zone that'd make it vulnerable to a huge fall to 44k in the event it fails to break. Double top pattern also seems feasible as the uptrend was effected by a double bottom which is basically how a double top evolves. Before taking a new long position wait for a close above the previous high with a valid retest. All other vital have neen provided on chart.
Your likes and opinions would be much appreciated, you can follow up for more helpful contents and do follow my comment sections too for quick updates.

BTCUSDT ASCENDING CHANNEL -$51K OR $42KBTC/USDT - The start to the current position of bitcoin in the rising channel indicates the price action with bullish patterns formation. Most of these listed patterns that have played out are double bottom and bullish divergence. Presently, the two patterns are in play but the second bottom got rejected at its first trial to break the resistance level($48.1k - $48.5k). Bitcoin seems to be making a pullback to $46.8k(support level), if support fails to hold price is plausible to fall drastically to the indicated spots on chart and if support holds, it's likely we see an uptrend reversal for another trial to break above the resistance level. All info on patterns, price targets and all have been provided on chart so observe well before taking any position.
Your likes and opinions would be much appreciated, you can follow up for more helpful contents and do follow my comment sections too for quick updates.


BITCOIN: Bull run, or no...?Are we just going to high five each other as this thing goes on its bullish trek?
Or ....
Are we going to recognize the huge bearish divergence that has developed?
Are we going to ignore the D1 bearish order block price is swimming in right now?
What about that retracement right to a fib golden zone level?
Is this the time now for more buys??
Or...
Should we consider TP if in longs? Taking partials, perhaps?
Maybe even taking short term sells??
Hmm.....

BTCUSDT start correctionBTCUSDT start correction!
Accuracy 95%
1. Rising Wages.
2. Hidden Bearish Divergence

BTC DESCENDING CHANNEL - 19K or NEW ATHThis analysis has been listed on my published post since june and its currently in play. The chart shows a vivid price movement of btc since the onset of the last ath and presently we are close to the lower high of the channel where btc could possibly get rejected or breakout. Price is at a strong resistance zone ($45.5k), failure to break could take price down to 42.5K and a reversal to the lower high of the channel is highly expected. The pattern implies a price trend to 50K - 51K then to a new ATH or back down to 19k which is a essential demand zone for btc to retest. All vital info have been provided on chart, take your time to delve.
Your likes and opinions would be much appreciated, you can follow up for more helpful contents and do follow my comment sections too for quick updates.

BTCUSDT 1D: Possible SHORTBTCUSDT 1D: Possible SHORT
Rebound from resistance level 47000 and fall to support level 29000

BTCUSDT gonna Short!BTCUSDT pullback done!
Now, its create hidden bearish divergence formation! And i anticipated she gonna create Classical Head & Shoulder.

BTC AT CRUX STATEThe current state of btc is crucial and a lot are probable at the moment. As indicated on chart, btc was rejected twice at 46.5k and ending up with a double top. In the event we see a breakdown in btc, the indicated support line should hold and a bounce back is probable which could give rise to an ascending channel (hidden fact for a continuation pattern to the upside). If current support hold then btc might bounce from here to the moon but the double top is likely to play out. Before taking position, watch out for confirmation of the possible scenarios.
Your likes and opinions would be much appreciated, you can follow up for more helpful contents and do follow my comment sections too for quick updates.

BTCUSDT UPCELLAR TREND - 50K OR 39KAs illustrated on chart, btc has been following a rising channel with a breakdown along line and back inside the channel in a stair way trajectory. The current position indicates a strong support but could go either way to the specified target if support fails to hold. Btc might be up for a new trend but until then let wait for the next price action.
Your likes and opinions would be much appreciated, you can follow up for more helpful contents and do follow my comment sections too for quick updates

BTC DETAILED ANALYSISBtc continues to follow the predictions on my previous chart which insinuates short term bullish and long term bearish. Yesterday, BTC broke out of the descending trendline analysed from the previous ATH and this clearly show sign of bulls in short term to the previous highs. Considering a break from the descending channel, does that insinuate a reversal trend back to bticoin's ATH at $64.5k, well that's probable if only btc can break into the ascending channel formation at the last bull season. My expectation is a kiss at the higher low of the channel then we'll be back to bear season but that'll be sad. You can checkout my full chart analysis of "BTC SHORT TERM BULLISH & LONG TERM BEARISH" in related ideas at the bottom page.
Your likes and opinions would be much appreciated, you can follow up for more helpful contents and do follow my comment sections too for quick updates.
