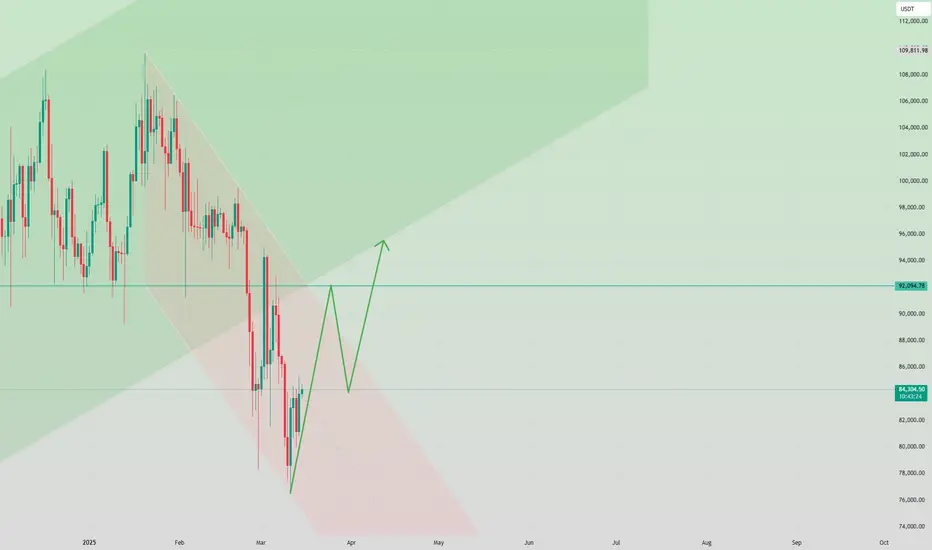
BTC: Daily AnalysisThe chart shows a bullish reversal pattern, likely an inverse head and shoulders or a bullish triangle breakout.
The price has broken out of the triangle formation, indicating a potential continuation of the uptrend.
The setup suggests a bullish outlook with a well-defined entry, stop loss, and take-profit levels.
If the price holds above the entry level and breaks resistance, the next targets could be achieved.
If BTC drops below the stop loss, the trade would be invalidated, signaling a potential downtrend or retest of lower support.
Trading Plan:
BUY@83,710 USDT
SL: Placed around 83,256 USDT to manage risk.
Targets:
1st Target: ~84,500 USDT
2nd Target: ~85,500 USDT
I always firmly believe that profit is the sole criterion for measuring strength. I will share accurate trading signals every day. Follow my lead and wealth will surely come rolling in. Click on my profile for your guide.
Btcusdtoday

Analysis of the Recent Price Trend of BitcoinRecently, the price of Bitcoin has been fluctuating wildly, and the market is in a fierce battle between bulls and bears. Currently, the price of Bitcoin is fluctuating around $85,000, showing a convergent triangle pattern, which indicates that significant fluctuations may occur in the short term.
In terms of capital flow, the main funds are quite active. Although there are large market - price sell orders suppressing the price, the buying signals are also very obvious, and the bullish power is gradually increasing. If Bitcoin can break through the $86,000 mark, it may trigger a more substantial increase. Moreover, since the rebound from the low point, Bitcoin has been stable above $84,000, providing certain support for the upward trend.
From a macro perspective, global liquidity is closely related to the price of Bitcoin. It is expected that major central banks will continue to cut interest rates in the next two years, and the M2 money supply is likely to expand, which is good news for Bitcoin. Since February 2024, the global M2 has been rising continuously, laying a solid foundation for risky assets such as Bitcoin. In addition, if the U.S. fiscal policy, the change of the U.S. dollar, and the adjustment of the money supply develop in a favorable direction, it will also boost the demand for Bitcoin.
However, the market is not without risks. Retail investors need to be vigilant against the backlash of selling. At the same time, there is still selling pressure in the range above $96,500. Overall, in the next half - month, if the bulls can continue to exert force with the help of capital and macro - level positive factors, Bitcoin is expected to hit higher prices.
BTC Trading Strategy:
BTCUSDT sell@87K-89K
tp:83K-81K
I firmly believe realized profit and a high win - rate are the best measures of trading skill. Daily, I share highly precise trading signals. These include clear entry points, stop - loss levels for risk control, and profit - taking targets from in - depth analysis. Follow me for big financial market returns. Click my profile for a trading guide on trends, strategies, and risk management.
BTCUSDT SHORT M15At the moment, the BTCUSDT trading pair is experiencing a distribution moment. Taking into account the liquidity collected at the top, I open a position in SHORT from the POI and FGV m15 I indicated with the target:
80,607.65$
79,058.00$
76,606.00$
Risk for stop order -1%

BTCUSD buy signal. Don't forget about stop-loss.
Write in the comments all your questions and instruments analysis of which you want to see.
Friends, push the like button, write a comment, and share with your mates - that would be the best THANK YOU.
P.S. I personally will open entry if the price will show it according to my strategy.
Always make your analysis before a trade

Bitcoin Collapses $80K, What’s Next?Its price briefly stabilized around $86K over the weekend before heading south at the start of the business week. It dropped to around $80K, leaving millions in liquidations on a 24-hour basis. Later, bulls stepped in and pushed the valuation to nearly $84K. The resurgence, however, was short-lived and was followed by another free fall to as low as $79,500. As of this writing, BTC is trading around $79,000, representing a 5% drop on the day. Its market cap dropped below $1.6 trillion.
While many industry players are hopeful that this is another temporary pullback that can be replaced by a new bull run, others are not so optimistic. Next up is a re-estimation of $78K for BTCUSD, “if that fails, the next $76300, 75,500 in the crosshairs.” BINANCE:BTCUSDT BITSTAMP:BTCUSD COINBASE:BTCUSD BYBIT:BTCUSDT.P

BTC/USD Ready for a BIG DROP? Next Target: Demand Zone!Bitcoin Showing Weakness – Smart Money Preparing a Move!
BTC/USD is struggling to hold key resistance levels, signaling potential distribution before a larger sell-off. Institutional players have grabbed liquidity, and a Break of Structure (BOS) to the downside confirms bearish momentum.

BTCUSDT: On the way back up to $110k!Dear traders,
Hope you are doing great, we have an excellent buying opportunity coming up or currently forming. Price has reversed with strong bullish volume, indicating a strong bullish impulse. A possible entry will be at breakthrough of inducement trend line.
If you agree with the idea, then please consider liking and commenting the idea which will encourage us to post more such ideas.
❤️

BTC Bitcoin - Upside Likely THIS WEEK (Thanks Retail Liquidity)Here's a challenge for you:
How many places of built-up liquidity can you spot on this chart that indicated where price is heading to...?
Post your chart below.
Admittedly this isn't the easiest environment to trade in, but still the clues are there.
Plus: DXY Dollar is weak for now, so XXXUSD seem more likely to be Bullish.
Now we stalk it and wait to see the flip to the Upside (if it happens). The invalidation point is the clear last Wick low.
There could be more opportunities later to scale in.
------------------
Are you seeing price action here the same as I am?
If not, comment below and tell me if I'm missing something...

There are unexpected profits after BTCUSD dropped sharply.Many people work hard to save money and manage their finances, but their assets continue to shrink. In fact, you have not mastered the correct asset allocation method. For example, the current price of Bitcoin is 94738, so should you short or go long now? How do you make a decision?
David believes that the current support point of Bitcoin is 94100. Combining technical indicators and basic factors, David believes that Bitcoin will bottom out and rebound.
BUY:94738
TP:9600
TP:9700
SL:94100
COINBASE:BTCUSD BITSTAMP:BTCUSD BITSTAMP:BTCUSD

Comprehensive analysis of BitcoinAt present, the 50-day and 200-day moving averages of Bitcoin form a "golden cross", which usually indicates a medium- to long-term bullish trend.
David's suggestion to buy long is reasonable. If you like the following profits, you can buy
Buy: 95600
TP: 95700
TP: 95800
SL: 95555
If you agree with my analysis, please continue to pay attention. I will share my views for free later - (David)
If you don't know which time to trade and want to avoid risks, you can continue to pay attention BITSTAMP:BTCUSD COINBASE:BTCUSD

Comprehensive analysis of Bitcoin (exclusive)Bitcoin is currently in a critical consolidation period. Both technical and fundamental factors point to the approaching change. The short-term trend needs to focus on the choice after the volatility rebounds. If it breaks through $109,000, it will accelerate the rise. If it falls below $91,000, it will cause a correction. However, David believes that the 50-day and 200-day moving averages form a "golden cross", which usually indicates a medium- to long-term bullish trend. In the long run, the price of Bitcoin may continue to rise.
If you agree with my analysis, please keep paying attention. I will share my views for free later-(David). BITSTAMP:BTCUSD COINBASE:BTCUSD BITSTAMP:BTCUSD

Scenario on BTCUSD 12.2.2025With btc, we are currently in such a situation that if I were to think about a possible long, I need the price to fall at least to the price range of 93-94k, then it is possible to expect a market reaction, if the market does not react to this price, it is possible to count on a price drop somewhere around 90k, where the s/r zone is, on the contrary, if I want to take a short, then somewhere around the price of 103k

BTCUSD - M15 Short-Term Downside - Timing Today's USD NewsAnalysis of overall situation:
We had a strong push up (to the left)
We're now in a retracement phase.
Usually there are 3 pushes down before the retracement is done. We're on that 3rd push phase.
I'm looking to Buy overall, so this is a short-term scalp in line with the retracement. (The Buy scenario is the orange SnDR zone lower)
H4 candles still showing weakness, indicating the retracement isn't done yet. Also, the spike from the previous M15 low happened at the new day, which hints it's not the real low.
Waiting for the market to first take liquidity off the high of today, ideally enter into the gap (blue zone) then create strong Bearish candles.
Entry will be on any M5/M15 retracement - after a break of structure. Also eventually breaking the current upward trendline.
Targeting the M15 low
Timing for this entry is after the USD News at NY Session.
If market hits the invalidation level marked, then this idea is discarded.

BITCOIN - Recovery? or Collapse?BTC-USDT (1D Timeframe)
Long trade targets achieved, but Bitcoin is looking bearish based on the Risological Trading Indicator.
The price is retracing after a strong uptrend.
Key Levels:
Entry: $64,464
Stop-Loss (SL): $61,682
Take Profit (TP) Levels:
TP 1: $67,903 ✅
TP 2: $73,467 ✅
TP 3: $79,032 ✅
TP 4: $82,470 ✅
What’s Next?
Pullback or Trend Reversal?
If support holds, we could see a bounce back for another bullish leg.
If momentum weakens, Bitcoin might see a rude reversal toward lower levels.
Iam not getting into a short position as yet, till I see the first candle close on Daily time frame below the Risological dotted trendline.
FOMO is a profitable trader's No.1 enemy! I am not going to fall for this, at the moment.
Wish you all the best, and do follow and upvote if this update has helped you.
Namaste!

BTC/USDT "Bitcoin vs Tether" Crypto Market Bullish Heist Plan🌟Hi! Hola! Ola! Bonjour! Hallo!🌟
Dear Money Makers & Robbers, 🤑 💰
Based on 🔥Thief Trading style technical and fundamental analysis🔥, here is our master plan to heist the BTC/USDT "Bitcoin vs Tether" Crypto market. Please adhere to the strategy I've outlined in the chart, which emphasizes long entry. Our aim is the high-risk Red Zone. Risky level, overbought market, consolidation, trend reversal, trap at the level where traders and bearish robbers are stronger. 🏆💸Be wealthy and safe trade.💪🏆🎉
Entry 📈 : "The heist is on! Wait for the breakout (102,000.0) then make your move - Bullish profits await!"
however I advise placing Buy limit orders within a 15 or 30 minute timeframe. Entry from the most recent or closest low or high level should be in retest.
Stop Loss 🛑: Thief SL placed at 97,500.0 (swing Trade) Using the 2H period, the recent / nearest low or high level.
SL is based on your risk of the trade, lot size and how many multiple orders you have to take.
Goal 🎯: 117,000.0 (or) Escape Before the Target
Scalpers, take note 👀 : only scalp on the Long side. If you have a lot of money, you can go straight away; if not, you can join swing traders and carry out the robbery plan. Use trailing SL to safeguard your money 💰.
📰🗞️Fundamental, Macro, COT, Sentimental Outlook:
BTC/USDT "Bitcoin vs Tether" Crypto Market is currently experiencing a bullish trend,., driven by several key factors.
💡 Fundamental Analysis
- Bitcoin's historical monthly returns data shows BTC generally yielded the third highest returns for traders in February, averaging 15.66%
- The total market capitalization of cryptocurrencies grew to $1.77 trillion in 2023, with Bitcoin's dominance increasing to 47.8%
💡 Macro Economics
- The US Federal Reserve's monetary policies and interest rate decisions will impact the cryptocurrency market.
- Global economic uncertainty and inflation rates will also influence the market.
💡 COT Report
- Unfortunately, I couldn't find the latest COT report data for BTC/USDT. However, I can suggest some resources where you can find the latest COT report data.
💡 Market Sentiment
- The Crypto Fear & Greed Index is currently at 44, indicating fear in the market
- 62% of traders are bullish on BTC/USDT, while 31% are bearish and 7% are neutral
💡 Institutional and Retail Banks Positioning
- Institutional traders are currently net-long on BTC/USDT, while retail traders are net-short.
- This divergence in positioning could lead to a potential bullish move in the market.
💡 Overall Outlook
- Based on the analysis, the BTC/USDT market is expected to move in a bullish trend, with a 60% chance of an uptrend and a 40% chance of a downtrend.
💡 Trader Sentiment
- Bullish Traders: 62% (Institutional: 70%, Retail: 55%)
- Bearish Traders: 31% (Institutional: 20%, Retail: 40%)
- Neutral Traders: 7% (Institutional: 10%, Retail: 5%)
💡 Positioning
- Institutional Traders: Net Long (Ratio: 2.5:1)
- Retail Traders: Net Short (Ratio: 1.2:1)
- Leverage: Average leverage used by traders is 10:1
⚠️Trading Alert : News Releases and Position Management 📰 🗞️ 🚫🚏
As a reminder, news releases can have a significant impact on market prices and volatility. To minimize potential losses and protect your running positions,
we recommend the following:
Avoid taking new trades during news releases
Use trailing stop-loss orders to protect your running positions and lock in profits
📌Please note that this is a general analysis and not personalized investment advice. It's essential to consider your own risk tolerance and market analysis before making any investment decisions.
📌Keep in mind that these factors can change rapidly, and it's essential to stay up-to-date with market developments and adjust your analysis accordingly.
💖Supporting our robbery plan will enable us to effortlessly make and steal money 💰💵 Tell your friends, Colleagues and family to follow, like, and share. Boost the strength of our robbery team. Every day in this market make money with ease by using the Thief Trading Style.🏆💪🤝❤️🎉🚀
I'll see you soon with another heist plan, so stay tuned 🤗

BTCUSDT 30-Min Chart - Market Analysis & Trading Strategy📊 BTCUSDT 30-Min Chart - Market Analysis & Trading Strategy
Alright, bro, let’s break this BTC chart down and see what’s cooking. 🚀
📉 Trend & Market Sentiment
Uptrend Facing Resistance
Price made a strong push from demand (around 91K-94K USDT)
EMA 20, 50, and 100 all aligned bullish but facing resistance at 102.5K USDT
EMA 200 rejection means we need a strong breakout for continuation
Key Levels to Watch
Support Zone: 98K - 95.8K USDT (Demand Area)
Resistance Zone: 101.5K - 102.5K USDT (Supply Zone)
🎯 Trading Strategy
1️⃣ Bullish Scenario (If BTC Breaks 102.5K USDT)
Entry: 102.5K USDT 📍
Targets (TP):
TP1: 103.5K USDT
TP2: 105K USDT
TP3: 107K+ USDT
SL (Stop-Loss): 100.5K USDT
2️⃣ Bearish Scenario (If BTC Gets Rejected at 102.5K USDT)
Short Entry: 101K - 102.5K USDT 🎯
TP Levels:
TP1: 98.9K USDT
TP2: 96K USDT
TP3: 94K USDT (Deep pullback)
⚠️ Risk & Warnings
BTC is testing major resistance—if it breaks, we could see a strong pump! 🚀
If BTC fails 101K, bears could take control and send it back to 95K or lower.
EMA 200 is a make-or-break level—watch price action carefully!
🔥 Final Thoughts
Right now, BTC is at a critical resistance—it either breaks 102.5K and runs, or fails and retraces back to demand zones. Stay sharp, set your SLs, and don’t get rekt! 💎🙌
What’s your take on this? You thinking long or short? 🤔

#BTCUSDT: Three Entries Going On Good, Next Target 150k! Dear Traders,
Three of our entries going good so far, where our third entry reversed and moved on nicely. We are now focusing on 120k first and then we will moving forward toward 150k. Correction is not likely to happen in meantime. Please use accurate risk management while trading BTC.

BTC Price Forecast: Will Accumulation Zones Lead to a 50% Surge?We are analyzing a BTC/USD weekly chart where the price is holding strong support above the rising trendline, marked in blue.
First Scenario:
After breaking out of the resistance trendline, the price rallied by 135%, as shown in the first green box. Notably, there was a small accumulation phase in the red-marked zone before the breakout.
Second Scenario:
Currently, the price is steadily moving upward, forming another small accumulation zone within the red-marked area. This pattern suggests a potential continuation of the bullish trend.
Outlook:
Based on these observations, the price could potentially rise an additional 50% from current levels. The Stochastic RSI supports this view, aligning well with the momentum seen in both scenarios.
Conclusion: The strong trendline support, recurring accumulation zones, and favorable momentum indicators point to further upside potential.

BTC 1H Setup This setup expects the price to move according to my previous 4H analysis, and we are rising up on the right shoulder of a bearish H+S on the way to ~98k.
Pink lines define the buy zone uptrend. There should be final accumulation/consolidation around 95.2 as the next bullish move after that is going to be trying to punch thru 96k into the bear accumulation territory.
Watch carefully to ensure theres no funny business when 96K comes around and also if price action is congruent to the rising wedge implied in the chart drawings(until $95200). Buy between the pink lines and anticipate closing at any of the fib levels above 97k. So far my entries within the buy zone did alright with 30x leverage with tight stops well inside the zone.

BTCUSDT 1DBTC Update ~ 1D
#BTC Closing the price below GETTEX:92K , will bring Bitcoin price to retest this golden ratio. Don't Worry, it's still Bullish for Bitcoin.

1/8 BTCUSD Trading StrategyAfter a sharp correction, BTCUSD has now reached support and shows signs of building a bottom, so in the current transaction, long transactions are the main focus.
Buy@94900-93800, (TP) 96000/96650/97200/97700

Will Bitcoin Hold $91,600 Support or Drop to $86K?The BTC/USD 4-hour chart highlights a key support zone at $91,600–$92,200, acting as a strong barrier against further downside. The price is consolidating near this level, with a descending trendline adding bearish pressure.
A bounce from this support could retest the trendline around $94,000–$95,000, while a break below $91,600 may trigger a decline toward $86,000 or lower. Traders should watch for confirmation of a bounce or breakdown.

BtCUSD Outlook I'm expecting the sweep of that Inducement before the Open and close level of the last H4 bearish candle. A short buy from there then I'm anticipating the seell continuation
